Dust and the Type II-Plateau Supernova 2004dj
Abstract
We present mid-infrared (MIR) spectroscopy of a Type II-plateau supernova, SN 2004dj, obtained with the Spitzer Space Telescope, spanning 106–1393 d after explosion. MIR photometry plus optical/near-IR observations are also reported. An early-time MIR excess is attributed to emission from non-silicate dust formed within a cool dense shell (CDS). Most of the CDS dust condensed between 50 d and 165 d, reaching a mass of M⊙. Throughout the observations much of the longer wavelength (m) part of the continuum is explained as an IR echo from interstellar dust. The MIR excess strengthened at later times. We show that this was due to thermal emission from warm, non-silicate dust formed in the ejecta. Using optical/near-IR line-profiles and the MIR continua, we show that the dust was distributed as a disk whose radius appeared to be shrinking slowly. The disk radius may correspond to a grain destruction zone caused by a reverse shock which also heated the dust. The dust-disk lay nearly face-on, had high opacities in the optical/near-IR regions, but remained optically thin in the MIR over much of the period studied. Assuming a uniform dust density, the ejecta dust mass by 996 d was M⊙, and exceeded M⊙ by 1393 d. For a dust density rising toward the center the limit is higher. Nevertheless, this study suggests that the amount of freshly-synthesized dust in the SN 2004dj ejecta is consistent with that found from previous studies, and adds further weight to the claim that such events could not have been major contributors to the cosmic dust budget.
Subject headings:
circumstellar matter — dust, extinction — supernovae: general — supernovae: individual (SN 2004dj (catalog ))1. Introduction
Massive stars explode via core collapse and ejection of their
surrounding layers (e.g. Arnett et al., 1989, and references therein). The
extent to which core-collapse supernovae (CCSNe) are, or have been, a
major source of dust in the Universe is of great interest. Of
particular concern is the evidence of enormous amounts of dust
() in galaxies at high redshifts
(). This comes from a variety of observations such as
sub-mm and near-infrared (NIR) studies of the most distant quasars
(Bertoldi et al., 2003; Maiolino et al., 2004), obscuration by dust of quasars in damped
Ly- systems (Pei et al., 1991), and measurements of metal
abundances in these systems (Pettini et al., 1997). Until recently, the
scenario of dust from AGB stars tended to be rejected since it was
thought that their progenitors would not yet have evolved off the main
sequence. However, Valiante et al. (2009) and Dwek & Cherchneff (2011) have argued that,
under certain circumstances, asymptotic giant branch (AGB) stars may
make some contribution to the dust budget at high redshifts. Both
studies nevertheless cannot rule out a supernova contribution. In
this paper, we examine the supernova option through observations of a
nearby core-collapse event.
CCSNe arising from short-lived Population III stars might seem to be a
viable alternative. It is estimated that each supernova (SN) must
produce 0.1–1 of dust to account for the
high-redshift observations (Dwek et al., 2007; Meikle et al., 2007). Such masses have been
predicted in models of dust formation in CCSNe (Todini & Ferrara, 2001; Nozawa et al., 2003),
although more recent calculations by Cherchneff & Dwek (2010) revise such
estimates downward by a factor of 5. Perhaps even more
problematic is the fact that actual dust-mass measurements in CCSNe
and SN remnants yield values not exceeding, respectively,
and , although only a
handful of such measurements exist. (For a summary of this topic see,
for example, Kotak et al. 2009, §1.) The Spitzer Space Telescope
(hereafter, Spitzer; Werner et al., 2004) provided an excellent
opportunity for us to test the ubiquity of dust condensation in a
larger number of CCSNe.
Newly-condensed dust in CCSNe can be detected by its attenuating
effects on optical/NIR light and/or via thermal emission from the
grains in the ejecta. Prior to Spitzer, the only evidence of
dust condensation in typical CCSNe was in the Type II-plateau
(IIP) SN 1988H (Turatto et al., 1993) and SN 1999em (Elmhamdi et al., 2003). However the
light curve data used to type SN 1988H was sparse. In the case of
SN 1999em, Elmhamdi et al. used optical line suppression to infer a
dust mass lower limit of about M⊙. With the launch
of Spitzer, we were at last provided with a facility for
high-sensitivity spectroscopy and imaging of nearby CCSNe over the
mid-infrared (MIR) range, covering the likely peak of the dust thermal
emission spectrum. This can provide a superior measure of the total
flux, temperature, and possibly dust emissivity than can be achieved
at shorter wavelengths. Moreover, the longer-wavelength coverage of
Spitzer allow us to detect cooler grains and see more deeply
into dust clumps than was previously possible for typical nearby
CCSNe. In this paper, we present our late-time Spitzer
observations of the Type IIP SN 2004dj. We use these observations to
study the dust production in this supernova.
The paper is arranged as follows. In §1.1 we summarize and discuss
previous observations of SN 2004dj. In §2 we present MIR (Spitzer) photometric and spectroscopic observations of SN 2004dj,
extending to more than 3 years after the explosion. This MIR coverage
is one of the most extensive ever achieved for a SN IIP. We also
present late-time optical and NIR photometry and spectra of
SN 2004dj. In §3 we analyze these data. Corrections are derived in
§3.1 for the effects of the line-of-sight cluster S96, and in §3.2
the mass of ejected 56Ni is determined. We compare the data with
blackbodies in §3.3, in order to assess the likely number and nature
of the contributing sources. In §3.4 the origins of the IR radiation
are examined in detail. The work is then summarized in §4.
1.1. SN 2004dj
SN 2004dj was discovered in the nearby spiral galaxy NGC 2403 on 2004
July 31 by Nakano et al. (2004) and was classified as a normal Type IIP SN by
Patat et al. (2004). It was the nearest such event in over three decades;
the host galaxy lies within the M81 group. In Kotak et al. (2005) we adopted
a distance to NGC 2403 (and the SN) of Mpc (statistical
errors only), this being the Cepheid-derived, zero metallicity value
reported by Freedman et al. (2001) using the Udalski et al. (1999) period-luminosity
slopes. We continue to use this distance in the work presented here.
Vinkó et al. (2006) have estimated the distance to SN 2004dj using a
combination of the Freedman et al. value plus their own expanding
photosphere method (EPM) and standard candle estimates. This yields
an average distance of Mpc, implying that the SN
luminosity could be 20% larger than the values used herein.
The progenitor of SN 2004dj was almost certainly a member of the
compact star cluster Sandage 96 (S96)
(Sandage, 1984; Bond et al., 2004; Filippenko et al., 2004; Maíz-Apellániz et al., 2004; Wang et al., 2005; Vinkó et al., 2006). The cluster age is
variously estimated to be Myr (Maíz-Apellániz et al., 2004), 20 Myr
(Wang et al., 2005), and 10–16 Myr (Vinkó et al., 2009). The main-sequence mass
of the progenitor is estimated at 15 M⊙
(Maíz-Apellániz et al., 2004; Kotak et al., 2005), 12 M⊙ (Wang et al., 2005), and
12–20 M⊙ (Vinkó et al., 2009). Maíz-Apellániz et al. (2004) and Kotak et al. (2005)
favor a red supergiant (RSG) progenitor.
Guenther & Klose (2004) used echelle spectroscopy of Na I D absorption lines in
NGC 2403 along the line of sight to SN 2004dj to infer a heliocentric
velocity of . This is somewhat larger than the
heliocentric velocity of the nuclear region of NGC 2403 of
130 given in the SIMBAD and NED databases, but this is not
surprising given the likely dispersion of velocities within the host
galaxy. Indeed, Vinkó et al. (2006) point out that H I mapping of NGC 2403
(Fraternali et al., 2001) suggests that the true radial velocity of the SN 2004dj
barycenter is about +221 . We adopt this value here.
There is no firm consensus about the value of the reddening to
SN 2004dj. Stellar population fitting for S96 yields total (Galactic +
host) values of mag (Maíz-Apellániz et al., 2004),
mag (Wang et al., 2005), and mag (Vinkó et al., 2009).
Direct color comparisons of SN 2004dj with other CCSNe yield
values of 0 mag (Zhang et al., 2006), 0.06 mag (Chugai, 2006), and
mag (Vinkó et al., 2006). Perhaps most significantly, the
resolved Na I D observations of Guenther & Klose (2004) yield a host-only
value of just mag. The smaller values of
obtained using direct measurements toward SN 2004dj suggests that the
SN actually lies near the front of S96. Based on the
extinction maps of Schlegel et al. (1998), Chugai et al. (2005) find a Galactic
reddening of mag while Zhang et al. (2006) report
mag (the same value as obtainable from NED). We
therefore adopt a Galactic mag. If we add the
Guenther & Klose (2004) host value to the Galactic value, we obtain
mag, or mag for a
Cardelli et al. (1989) extinction law with . Given the range of
published values, in the present work we used a total extinction
mag, the same as that preferred by Vinkó et al. (2009). Adoption
of even the largest published value of would increase our
shortest MIR wavelength (3.6 m) flux by just a few percent.
Estimates of the explosion date of SN 2004dj vary by several weeks.
On the basis of an early-time spectrum, Patat et al. (2004) placed the explosion
at about 2004 July 14. This is consistent with the date obtained by
Beswick et al. (2005), who used the radio versus rise-time relation
(Weiler et al., 2002) to yield an explosion date between 2004 July 11 and July
31. On the other hand, based on the EPM method, Vinkó et al. (2006) derive
an explosion date as early as 2004 June 30. On the assumptions that
the light curve of SN 1999gi was typical of SNe IIP and that
the SN 2004dj plateau was of similar length, Chugai et al. (2005) obtained an
even earlier explosion date: 2004 June 13. Likewise, assuming similar
evolution between SN 2004dj and SN 1999em, Zhang et al. (2006) find an
explosion date of 2004 June 11. Nevertheless, partly as a compromise
with the later Patat et al. (2004) value, Chugai (2006) subsequently adopted
2004 June 28 as the date of the explosion. Chugai et al. (2007) also used
this explosion date. Given the weight of evidence for a later
explosion date, we reject that preferred by Zhang et al. (2006). In
Kotak et al. (2005) we adopted an explosion date of 2004 July 10, or
MJD = 53196.0. We use the same explosion date here but recognize that
there is an uncertainty of about d. All epochs will be with
respect to MJD = 53196.0 (i.e., d).
Optical light curves of SN 2004dj are presented by
Korcáková et al. (2005); Chugai et al. (2005); Leonard et al. (2006); Vinkó et al. (2006); Zhang et al. (2006); Vinkó et al. (2009). The light curves
fell by 10% and 90% of the total decline from the plateau to the
start of the radioactive tail at, respectively, epochs d
and d. At the start of the radioactive tail the SN
luminosity was about 15% of the plateau value. During the early
nebular phase (up to 300 d) the band declined at about 1.1
mag (100 d)-1 (Vinkó et al., 2006), which is typical for a SN IIP. On
the basis of the light curves, the mass of ejected 56Ni has been
estimated at 0.02–0.03 M⊙ (Chugai et al., 2005; Kotak et al., 2005; Vinkó et al., 2006; Zhang et al., 2006).
Notwithstanding, in the present work we argue that these authors have
overestimated the 56Ni mass and that the true mass is more like
0.01 M⊙.
At the end of the plateau phase, SN 2004dj exhibited a remarkable and
rapid change in some of its prominent optical lines, especially
H. At 89 d the H profile still had a typical P Cygni
morphology with a symmetric peak blueshifted by only about
after correction for the heliocentric velocity of the SN.
Yet, by just 10 d later the profile had developed a strong
asymmetric profile with a peak at (Chugai et al., 2005). As time
went by during the first year, this blueshift gradually decreased and
the asymmetry became less pronounced. Chugai (2006) interpreted this
unusual behavior as being due to the gradual emergence of an
asymmetric, bipolar jet whose more massive component is travelling
towards the observer. They propose that the lines are driven by the
radioactive decay of spherical fragments of 56Co cocooned in
metals and helium, lying within the core. Using spectropolarimetry
Leonard et al. (2006) also found evidence for departure from spherical
symmetry. The polarization was observed to increase dramatically at
the end of the plateau phase, implying the presence of significant
asphericity in the inner regions of the ejecta.
Early-time evidence of a significant circumstellar medium (CSM) around
the progenitor of SN 2004dj has also been reported. Radio emission
was detected by Stockdale et al. (2004) at 23 d, by Beswick et al. (2005) between 26 d
and 145 d, and by Chandra & Ray (2004) at 33 d and 43 d. The SN was also
detected at X-ray wavelengths (Pooley & Lewin, 2004) at 30 d. The X-ray
luminosity was about three times that of the Type IIP SN 1999em and
nearly fifteen times that of the Type IIP SN 1999gi at similar epochs.
Beswick et al. (2005) point out that both types of emission arise from a
shocked CSM. Chugai et al. (2007) have used the presence of a high-velocity
absorption component in the H line during the late
photospheric phase to deduce the presence of a cool dense shell (CDS),
with a mass of M⊙, produced by interaction
of the ejecta with the pre-existing CSM. To this evidence for a CDS
we add our observation of an early-time IR echo in SN 2004dj (see
§3.4.2).
In Kotak et al. (2005) we presented MIR photometric and spectroscopic
observations of SN 2004dj at epochs 97–137 d after explosion. Simultaneous
modelling of the fundamental (1–0) and first overtone (2–0) of CO
was carried out. The results favor a 15 M⊙ RSG progenitor and
indicate post-explosion CO formation in the range 2000–4000 .
Kotak et al. (2005) also noted an underlying NIR continuum. A possible
origin in CSM dust was suggested, but RSGs in S96 were favored as the
more likely cause. Nevertheless, in the present work (§3.2.2) we find
that the bulk of the early-time NIR and MIR continuum is most
plausibly explained as an IR echo from CDS dust. The presence of
M⊙ of Ni+ in the ejecta was also deduced
by Kotak et al. (2005).
In summary, while the early-time optical light curves and spectra of
SN 2004dj are typical of a Type IIP event, its early radio, MIR, and
X-ray behavior point to an exceptionally strong ejecta/CSM
interaction. Moreover its earlier nebular-phase spectra imply an
atypically asymmetric core. SN 2004dj is only “typical” in some
respects.
2. Observations
2.1. Mid-Infrared Photometry
Imaging at 3.6, 4.5, 5.8, and 8.0 m was obtained with the
Infrared Array Camera (IRAC) (Fazio et al., 2004), at 16 and 22 m with
the Peak-up Array (PUI) of the Infrared Spectrograph (IRS)
(Houck et al., 2004), and at 24 m with the Multiband Imaging Photometer
for Spitzer (MIPS) (Rieke et al., 2004). Imaging observations spanned epochs
89.1 to 1393.3 d, plus four observations, at 3.6 m only, covering
1953.9–2143.5 d. Aperture photometry was performed on the images
using the Starlink package GAIA (Draper et al., 2002). A circular aperture of
radius was used for the photometry. The background
flux was measured and subtracted by using a concentric sky annulus
having inner and outer radii of 1.5 and 2.2 times the aperture radius,
respectively. These parameters were chosen as a compromise between
maximizing the sampled fraction of source flux and minimizing the
effects of the bright, complex background. The aperture radius
corresponds to 55 pc at the distance of SN 2004dj. The aperture
was centered according to the SN WCS coordinates. Aperture
corrections were derived from the IRAC and MIPS point-response
function frames available from the Spitzer Science Center, and ranged
from 1.16 at 3.6 m to 2.79 at 24 m. A
2 clipped mean sky estimator was used, and the statistical
error was estimated from the variance within the sky annuli. Fluxing
errors due to uncertainties in the aperture corrections are about
.
The MIR photometry is presented in Table 1. The Spitzer programs from which the imaging data were taken are listed in
the caption. The pre-explosion MIR flux of S96 has not been measured,
so the tabulated values are uncorrected for S96. An estimate of the
S96 contribution is given at the bottom of the Table. The effect of
emission from S96 is discussed in §3.1. A temporally varying point
source at the SN position is clearly visible in all bands.
Figure 1 shows a sequence of images at 8.0 m at 257,
621, and 996 d. The SN is clearly brighter at 621 d (about
relative to 257 d). This is due to the epoch being close to the peak
of the thermal emission from the dust (see §3.4.4.2). It can also be
seen that the SN lies in a region of relatively bright, complex
background emission. The MIR photometry is displayed as light curves
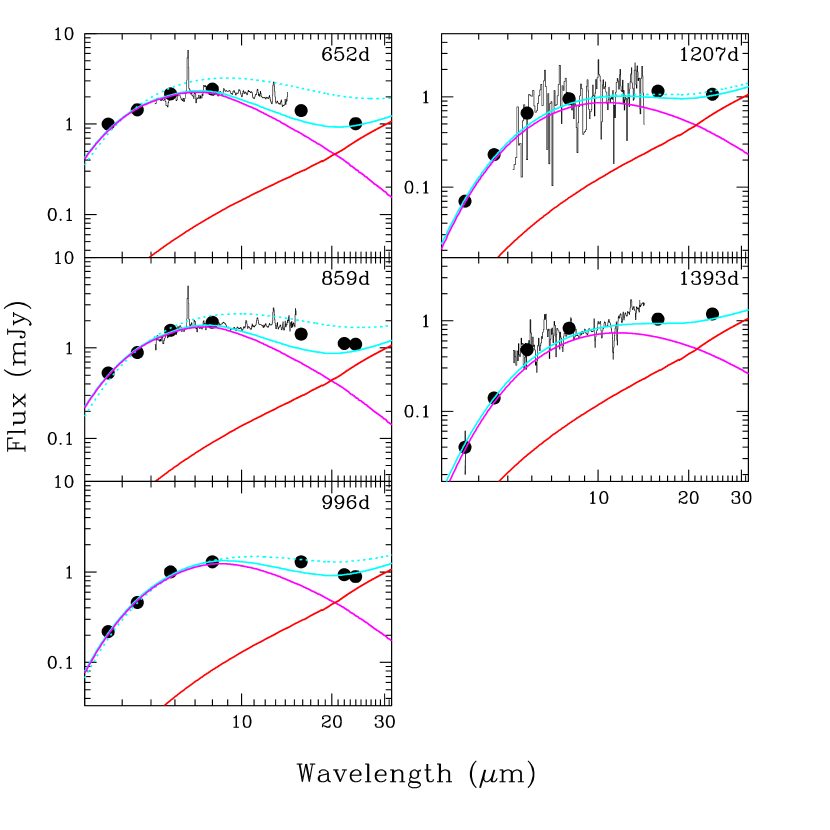
and spectral energy distributions (SEDs) in Fig. 2 and
Fig. 3, respectively.
In Fig. 2, a rapid initial decline is seen at wavelengths 3.6–8.0 m. With the exception of 4.5 m, all of the light curves (with sufficient temporal coverage) exhibit secondary maxima, with the peak emission occurring at epochs of 450 d at 3.6 m to 850 d at 24 m. As will be discussed later, these second maxima constitute strong evidence of dust formation. The absence of a delayed peak at 4.5 m is due to the earlier appearance and dominance of CO fundamental emission in this band. After 1000 d, the 24 m light curve starts to climb again. The evolution of the 24 m flux is complex, as it is a combination of the detailed behaviors of emission from the ejecta dust and from an interstellar (IS) IR echo (see §3.4.3.1). In Fig. 3 we see a steady reddening of the MIR SED with time. It is argued below (§3.4.4.2) that this effect also constitutes strong evidence of dust formation and cooling in the SN ejecta. The large peak at 4.5 m at 114 d and 257 d is due to the aforementioned dominance of CO fundamental emission in this band. As in Table 1, neither Fig. 2 nor Fig. 3 have been corrected for S96.
2.2. Optical and Near-Infrared Photometry
NIR imaging of SN 2004dj was obtained using LIRIS (Long-slit
Intermediate Resolution Infrared Spectrograph) on the 4.2 m William
Herschel Telescope (WHT), La Palma, and at an effectively single epoch
(spanning two days) with the OSU-MDM IR Imager/Spectrograph on the
2.4 m Hiltner Telescope of the MDM Observatory, Arizona. The wavebands
are (1.033 m), (1.250 m), (1.635 m), and
(2.15 m). The LIRIS data were reduced using standard IRAF
routines.111IRAF is written and supported by the IRAF
programming group at the National Optical Astronomy Observatories
(NOAO) in Tucson, Arizona, which are operated by the Association of
Universities for Research in Astronomy (AURA), Inc., under cooperative
agreement with the National Science Foundation (NSF). The jittered
on-source exposures were median-combined to form sky frames. In each
band the sky-subtracted frames were then aligned and
median-combined.
Aperture photometry was performed on the reduced
images using the Starlink package GAIA (Draper et al., 2002) with the same
aperture and sky annuli as for the MIR photometry. The aperture was
centered by centroiding on the sources. The magnitudes at , , and
were obtained by comparison with four field stars lying within
of SN 2004dj. The field-star magnitudes were
acquired by measurement of 2MASS images (Skrutskie et al., 1997). For the single
-band measurement, the magnitude was obtained by comparison with the
four field stars with their SEDs extrapolated to the
band. The resulting SN photometric measurements are listed in
Table 2 and plotted in Fig. 4.
Errors shown include uncertainties in the magnitudes of the four 2MASS
comparison field stars. Pre-explosion fluxes of S96 were
measured from the 2MASS survey (see Table 2) and used to
correct the light curves. Also shown for comparison is the
3.6 m light curve from the present work. In and the
slopes flatten after 300 d accompanied by a rise at
3.6 m. This is suggestive of radiation from warm, newly-forming
dust.
Optical photometry was taken from Vinkó et al. (2006, 2009). The optical
light curves are displayed in Fig. 4 and have been corrected
for emission from the S96 cluster using the magnitudes given by
Vinkó et al. (2006). In addition, the and points of Zhang et al. (2006)
around the end of the plateau were added to enhance the detail of this
phase. Also shown for comparison (labelled “Rad”) is the temporal
evolution of the radioactive energy deposition for SN 1987A as
specified by Li et al. (1993) (0 to 1200 days) and Timmes et al. (1996) (500 to
3500 days) with the addition of the early-time contribution of
56Ni decay assuming complete absorption. The radioactive isotopes
include 56Ni, 56Co, 57Co, 60Co, 22Na, and
44Ti. (In subsequent use of the Li et al. and
Timmes et al. deposition specifications, our addition of the
early-time contribution of 56Ni decay is assumed.) In the
optical light curves, for about 35 d (115–150 d) after the end of the
fall from the plateau the decline rate matches the radioactive
deposition quite closely, indicating that this was powering the
emission during this phase. The optical decline rates then flatten
during 150–250 d, indicating the emergence of an additional
power source (see below). After about 250 d, the optical light curves
exhibit a steepening (possibly also present in the band) which
increases up to the final observations.
2.3. Mid-Infrared Spectroscopy
Low-resolution (–127) MIR spectroscopy between 5.2 and
14.5 m was acquired at nine epochs between 106.3 d and 1393.3 d
with the IRS in low-resolution mode. Long-Low (LL; 14–38 m)
observations were also attempted. Unfortunately, the LL observations
were unusable. The LL slit lies at to the SL slit. This
meant that, given the scheduling constraints, the LL slit always lay
across the host galaxy, resulting in heavy contamination. The MIR
spectroscopic observations were drawn from the MISC programs plus one
epoch at 1207 d from the SEEDS program. The log of spectroscopic
observations is given in Table 3.
The data were processed through the Spitzer Science Center’s pipeline
software, which performs standard tasks such as ramp fitting and
dark-current subtraction, and produces Basic Calibrated Data (BCD) frames.
Starting with these data, we produced reduced spectra using both the
SPICE and SMART v6.4 software packages. We first cleaned individual
frames of rogue and otherwise “bad” pixels using the IRSCLEAN
task. The first and last five pixels, corresponding to regions of
reduced sensitivity on the detector, were then removed. The individual
frames at each nod position were median-combined with equal
weighting on each resolution element. Sky background was removed from
each combined frame by subtracting the combined frame for the same
order taken with the other nod position. We also experimented with
background removal by subtracting the adjacent order. In general,
nod-nod subtraction was preferred, as the background sampled in this
way is expected to most closely represent the background underlying
the SN. Any residual background was removed by fitting low-order
polynomials to regions immediately adjacent to the SN position.
One-dimensional spectra were then extracted using the optimal
extraction tool within the SPICE software package, with default
parameters. We found that in all cases the source was point-like, with
a full width at half-maximum intensity (FWHM) that was never wider
than the point-spread function (PSF). This procedure results in
separate spectra for each nod and for each order. The spectra for
each nod were inspected; features present in only one nod were treated
as artifacts and removed. The two nod positions were subsequently
combined. The nod-combined spectra were then merged to give the final
spectrum for each epoch. Overall, we obtained excellent continuum
matches between different orders.
Despite our careful reduction procedure, the fluxes of the IRS spectra
and the IRAC photometry were not completely consistent. This was due
to (a) differences in the fixed sizes of the spectrograph aperture
slits and the circular apertures used for the image photometry, and (b)
the fact that the spectra were generally taken some days before or
after the imaging data, during which time the SN flux changed. We
therefore recalibrated the IRS spectra against contemporaneous
photometry in the 8 m band obtained by interpolation of the light
curve. This band was chosen since it was completely spanned by the
short-low (SL) spectrum. For each epoch, the IRAC 8 m
transmission function was multiplied by the MIR spectra and by a model
spectrum of Vega222The R. Kurucz Stellar Atmospheres Atlas,
1993, ftp://ftp.stsci.edu/cdbs/grid/k93models/standards.. The
resulting MIR spectra for the SN and for Vega were integrated over
wavelength. The total SN spectral flux in the 8 m band was then
obtained from the ratio of the two measurements using a zero (Vega)
magnitude of 64.1 Jy (IRAC Data Handbook, Table 5.1). These were then
compared with the 8 m photometry to derive scaling factors by
which the spectra were multiplied. The spectra are plotted in
Fig. 5, together with contemporary photometric data.
The MIR spectra comprise both continua and emission features. Up to at least 281 d, strong emission from the CO fundamental was present in the IRS spectra and IRAC photometry. This had disappeared by 500 d. Strong lines of H I, [Ni I], [Ni II], [Co II], and [Ne II] were also present during the first year, but by 500 d only [Ni II] 6.64 m, [Ni I] 7.51 m, and [Ne II] 12.81 m were still relatively strong (see Fig. 5). Apart from the CO region during 106–281 d, the 5–14 m region was dominated by continuum emission. Moreover, simple extrapolation below and above the spectral coverage to the limits of the photometric coverage suggests that the continuum dominated over at least 3.6–24 m.
2.4. Optical and Near-Infrared Spectroscopy
We acquired optical spectra using ISIS on the WHT, La Palma, and
DEIMOS (Faber et al., 2003) on the 10 m Keck 2 telescope, Hawaii. The
895 d Keck spectrum has already been presented by Vinkó et al. (2009). We
also made use of earlier post-plateau optical spectra obtained by
Vinkó et al. (2006) at 89 d and 128 d, Leonard et al. (2006) at 95 d, and
Chugai et al. (2005) at 100 d. NIR spectroscopy of SN 2004dj was obtained
using LIRIS on the WHT and with the OSU-MDM IR Imager/Spectrograph on
the 2.4 m Hiltner Telescope of the MDM Observatory, Arizona. The data
were reduced using standard procedures in Figaro (Shortridge, 2002) and
IRAF. The observing log for the optical and NIR spectra is given in
Table 4. The post-100 d spectra are plotted in
Figs. 6 and 7.
The earlier post-plateau spectra still exhibited pronounced P Cygni
features in H, He I 5876 Å + Na I D, He I 10830 Å,
He I 20581 Å, and O I 7771 Å + K I 7665/99 Å. By 461/467 d the
absorption components had largely vanished, with a broad-line emission
spectrum now being observed. A few lines persisted to as late as the
final optical spectroscopy epoch at 925 d. We examined in detail the
evolution of the more isolated of these lines, specifically H,
Pa, [O I] 6300 Å, [Fe II] 7155 Å, and [Fe II] 12567 Å.
Table 5 lists the line luminosities (dereddened) versus
epoch, together with the radioactive deposition power specified by
Li et al. (1993) and Timmes et al. (1996) for SN 1987A, but scaled down to an
initial 0.0095 M⊙ of 56Ni (see §3.2). The evolution of
the luminosities is plotted in Fig. 8.
This indicates that from just after the plateau phase to 460 d,
the H and Pa luminosities declined at a rate roughly
comparable to that of the radioactive deposition. In contrast, from
their earliest observation at 300 d, the [O I] and [Fe II] lines
decline significantly more slowly than the radioactive rate.
Moreover, by 895 d the summed luminosity of just the H,
[O I] 6300 Å, and [Fe II] 7155 Å lines exceeds that of the
radioactive input by 40%, rising to over 60% by 925 d.
Thus, as with the optical light curves, we deduce the appearance
of an additional source of energy, possibly earlier than 300 d.
Table 6 lists profile parameters expressed as velocities for
the more isolated lines over a range of epochs, shifted to the
center-of-mass rest frame of SN 2004dj. Also listed (Col. 7) for
461–925 d are the maximum blue-wing velocities derived from profile
model matches (see §3.4.4.1). Preliminary inspection indicated that
for lines within a given element (e.g., H and Pa), the
velocities exhibited similar values and evolution. Therefore, in order
to improve the temporal coverage and sampling, H and Pa
were grouped together, as were [Fe II] 7155 Å and
[Fe II] 12570 Å. The evolution of the line velocities (shifted to
the center-of-mass rest frame of the SN) is plotted in
Fig. 9, and in more detail in Fig. 10. These plots
reveal a complex velocity evolution.
Up to 138 d, of the three elements considered, only hydrogen lines
could be reliably identified. At 89 d (corresponding to about
half-way down the plateau-edge), the half width at half-maximum (HWHM)
velocity was , although the red and blue wings
extended to much higher values. In addition, the peak emission
exhibited a blueshift of . Then, as already described
in §1, a strong asymmetry rapidly developed, this being attributed to
the emergence of an asymmetric, bipolar core (Chugai, 2006). Rather
than being entirely due to the bulk motion of the ejecta however, some
of the width of the H and Pa lines may also have been
produced by scattering from thermal electrons as in the cases of
SN 1998S (Chugai, 2001) and SN 2006gy (Smith et al., 2010), but this effect is
unlikely to have a significant influence at later epochs. By the time
of the next observation at 283 d, the asymmetry had diminished, with
the blueshift of the peak now only . By this time the
lines of [O I] and [Fe II] had emerged, also with asymmetric
blueshifted profiles. As the SN continued to evolve, the line widths
narrowed and by 461 d we see the first signs of a sharp suppression of
the red wing. By the time of the next season’s observations (895 d,
925 d), this suppression is very pronounced in all three species.
This phenomenon suggests dust formation resulting in the obscuration
of the far side of the ejecta and will be examined in more detail in
§3.4.4.1.
By 895 d and 925 d a second, weaker peak redshifted by 170 had also appeared in the H and [O I] 6300 Å profiles
(Fig. 10). (The redshifted peak can also be seen in the
weaker [O I] 6364 Å component lying at +3000 in the
[O I] 6300 Å rest-frame plots.) The previous observations of these
lines were at 467 d when the line luminosities were about a factor of
20 greater (Table 5) as well as being much wider
(Table 6). Therefore an underlying, weaker, redshifted
component could have been present at 467 d or earlier, but was swamped
by the main component of the line. The 895 d spectrum has a blueshift
in the main peak in H of with the minor peak
showing a redshift of about . In [O I] 6300 Å the
corresponding velocities are, respectively, and
. Thus, the main (blueshifted) peak and the weaker
(redshifted) peak lie roughly symmetrically about the local zero
velocity. This suggests that a minor fraction of the line flux
originates in an emission zone centered on the SN and having the
geometry of an expanding ring, jet, or cone. The [Fe II] 7155 Å line also shows a secondary peak but at a much larger redshift of
. There may actually be a peak also at around
+170 , similar to those seen in H and [O I] 6300 Å, but
which is swamped by the stronger peak at the larger redshift. The
profiles are analyzed in §3.4.4.1.
We do not consider the MIR line-profile kinematics due to the much lower resolution (). The formation and evolution of the MIR lines will be analyzed in a future paper.
3. Analysis
The evolution of the MIR spectral continuum indicates IR emission from dust playing a major role in the post-plateau flux distribution of SN 2004dj. We now make use of the observations described above to explore the origin, location, distribution, energy source(s), and nature of these grains. This will be done by comparison of a variety of simple models with the observations.
3.1. Correction of the Supernova Flux for S96.
The position of SN 2004dj coincides with that of the compact star
cluster S96 (Sandage, 1984), and it seems likely that the progenitor was
a member (Wang et al., 2005). Regardless of whether or not this is
the case, it is still important to correct for the contribution of the
cluster to the photometry and spectra, especially at the later epochs,
before we embark on modelling the observed SED. To do this, in the
optical region we made use of the pre-explosion optical photometry
compiled in table 4 of Vinkó et al. (2009). NIR photometry of S96 was
obtained from 2MASS (see Table 2). Unfortunately there are
no pre-explosion MIR images of S96 and so its contribution to the flux
had to be assessed indirectly.
We found that longward of 0.4 m the optical/NIR
photometric points could be fairly represented by a combination of two
blackbodies, reddened according to the Cardelli et al. (1989) law with
mag and . This is illustrated in
Fig. 11.
In this representation, the fluxes longward of 1 m are
dominated by a component with a temperature of 3500 K. At shorter
wavelengths, the hotter component (50,000 K) becomes increasingly
important. This hot blackbody is not intended as an explanation for
the shortwave radiation, but rather it simply serves as a means of
representing and extrapolating the optical SED. The contribution of
S96 to the MIR photometric points was then obtained by extrapolation
of the cooler blackbody. (We did not make use of the Vinkó et al. (2009)
models to correct for S96 as it was unclear how they should be
extrapolated into the MIR region.) Some support for the effectiveness
of our estimation method, at least for the shorter wavelengths, comes
from four serendipitous 3.6 m images of the SN 2004dj field
spanning 1954–2143 d (Table 1), obtained in Spitzer
program 61002 (PI W. Freedman). These show that, by this period, the
light curve at this wavelength had levelled out at a mean value of
mJy which in good agreement with our estimate for S96 of
mJy (see Fig. 2).
It is possible that the above procedure could underestimate a
contribution from cooler material but it is unlikely that S96 would be
the source of such emission. Maíz-Apellániz et al. (2004) estimate a cluster age of
13.6 Myr and point out that by this age its parent molecular cloud
should have been dispersed by stellar winds and SN explosions.
Wang et al. (2005) find an age of 20 Myr while Vinkó et al. (2009) obtain
Myr. This suggests that the flux contribution from S96 to
longer MIR wavelengths would be small. On the other hand a significant
SN-driven IR echo from the general IS dust of the host
galaxy is quite likely (see §3.4.3.1).
We conclude that the 3500 K blackbody extrapolation provides a reasonable estimate of the MIR flux contributions from S96. The inferred S96 fluxes in the m range are shown in Table 1. The values are insensitive to the extinction over the ranges of ( mag) suggested in the literature. It can be seen that the contribution of S96 at 3.6 m is significant as early as 250 d, and dominates by 1000 d. As we move to longer wavelengths, the effect of S96 declines, becoming negligible for wavelengths longward of 10 m even at the latest epochs. In the optical-NIR-MIR continuum modelling (see §3.4.4.2), we use the S96 blackbody representation to correct for its contribution to the SED.
3.2. Mass of 56Ni in the Ejecta
It is important to establish the mass of 56Ni in the ejecta of
SN 2004dj since this will allow us to test for the presence of energy
sources, other than radioactive decay, which might be responsible for
the SN luminosity.
In Fig. 12 we show the bolometric light curves (BLCs) of
Vinkó et al. (2006) (open circles) and Zhang et al. (2006) (open triangles). The
phases of these have been shifted to our adopted explosion date of
MJD=53196.0. This date is nearly one month later than that of
Zhang et al. reducing their derived 56Ni mass by about
25%. The explosion date of Vinkó et al. is about 10 d earlier
than ours but it is not clear if this would significantly
affect the 56Ni mass they derived. In addition to the phase
shifts, the BLCs of these authors have been scaled downward to our
adopted distance of 3.13 Mpc. This has the effect of reducing the
56Ni masses of Vinkó et al. and Zhang et al. by 19%
and 10% respectively. We scaled the Vinkó et al. (2006) BLC by a further
in order to allow approximately for the higher total
extinction ( mag) adopted by Vinkó et al. (2009) and the present
work. We scaled the BLC of Zhang et al. (2006) by a further factor of
0.68 to force agreement with our adjusted version of the
Vinkó et al. BLC. The need for this was due to the much larger
extinction, mag, adopted by Zhang et al., compared
with the mag adopted in the present work. It was found
that these adjustments brought our 89 d, 106 d and 129 d blackbody
total luminosities (see §3.3 and Table 7, col. 11.) into
fair coincidence with the other two BLCs (see Fig. 12).
Vinkó et al. (2006) constructed their BLC by integrating observed
fluxes in the bands and then extrapolating linearly from the
and fluxes assuming zero flux at 3400 Å and
23,000 Å. Their BLC extended to 307 d. Zhang et al. (2006) simply
integrated the observed fluxes in 12 narrow bands between 4000 Å and 10,000 Å. Their BLC extended to 154 d, with five additional
points to 180 d obtained by interpolation within a reduced number of
bands. Thus, neither of these BLCs included unobserved excess flux
beyond about 1 m. However, for 89–129 d the unobserved MIR flux
made up no more than 10% of the total luminosity (see
§3.4.2). Moreover, the optical/NIR region was dominated by continuum
emission at this time. Consequently, the hot+warm continuum
luminosities obtained from the present work via blackbody matching
(see §3.3 and Table 7 col. 12.) and plotted in
Fig. 12 (solid squares) agree well with the two adjusted
BLCs. (We exclude the cold component because, as argued in §3.4.3.1,
it is due to an IS IR echo which was predominantly powered by the
peak luminosity of the SN prior to the earliest epoch of observation.)
By 251/281 d our hot+warm continuum luminosities make up only
60% of the adjusted Vinkó et al. BLC. This is due to the
relatively strong contribution of line emission to the total
luminosity during this time. Line emission luminosity was not included
in our blackbody matches (see §3.3).
In Fig. 12, the SN BLCs are compared with the radioactive
deposition power in SN 1987A, as specified by Li et al. (1993) &
Timmes et al. (1996). These radioactive decay light curves are scaled to,
respectively, 0.0095 M⊙ (solid line) and 0.016 M⊙
(dashed line) of 56Ni. Also shown (red) is the total radiocative
luminosity in the case of 0.0095 M⊙. We also show (dotted
lines) the actual UV-augmented BLCs of SN 1987A (Pun et al., 1995) derived
from observations at ESO and CTIO, scaled to an initial 56Ni mass
of 0.0095 M⊙. It can be seen that the 0.0095 M⊙
case provides a good match to the SN 2004dj BLC during d,
just after the end of the plateau phase. After 150 d, unlike SN 1987A,
the SN 2004dj BLC begins to exceed the luminosity of the
0.0095 M⊙ case with the discrepancy growing steadily with
time. Indeed, even the total radioactive luminosity of the scaled
SN 1987A is exceeded by the SN 2004dj light curve, implying that
an additional source of energy has appeared.
Our 0.016 M⊙ deposition plot corresponds approximately to
the 0.02 M⊙ case of Vinkó et al. (2006) in their Fig. 18. We
agree that this case provides a fair match to the BLC during
d. Nevertheless, viewed within the context of the whole
BLC, it can be seen that this “match” is actually due to an
inflection section during the growth of the BLC excess relative to the
true radioactive deposition. Adoption of the 0.016 M⊙ case
would imply an unexplained BLC deficit during d.
Given the phase of the event and the unexceptional progenitor mass it
is difficult to see how such a discrepancy would come about.
Consequently, we argue that only during the d phase was the
BLC of SN 2004dj actually dominated by radioactive decay. Beyond this
period, and as deduced also in §2.2 and §2.3, an additional
luminosity source emerged. We therefore reject the 56Ni mass
deduced by Vinkó et al. (2006).
We also reject larger 56Ni masses reported by other authors.
Kotak et al. (2005) used the band exponential tail method of
Hamuy (2003) to derive a 56Ni mass of M⊙.
This was based on the magnitude at 100 d which the subsequently
more complete database shows was not quite yet on the radioactive tail
(see Fig. 4), thus leading to an overestimate of the
56Ni mass. This method was also one of those used by
Zhang et al. (2006) who obtained M⊙ of 56Ni.
As already indicated, their larger value was due mostly to their much
earlier explosion epoch and much larger extinction, neither of which
we view as likely. Chugai et al. (2005) obtained M⊙
of 56Ni based on comparison of the magnitude at 200 d with
that of SN 1987A. The difficulty here is that by this epoch (as also
in the Vinkó et al. (2006) case) an additional power source had appeared in
SN 2004dj, biasing the derived 56Ni mass to higher values. In
addition, Chugai et al. (2005) used an exceptionally early explosion date,
pushing their result even higher. Finally we note that both
Chugai et al. (2005) and Zhang et al. (2006) also used the -light curve
“steepness” method of Elmhamdi et al. (2003), which is insensitive to
distance and extinction uncertainties. Chugai et al. obtained
M⊙, consistent with our result.
Zhang et al. applied the same method to a number of wavebands,
including , but obtained a larger M⊙.
Their steepness parameter at just yields about M⊙
suggesting that their use of multiple bands is not the cause of the
apparent disagreement with Chugai et al. However, the difference
between the Chugai et al. and Zhang et al. determinations
is only at the level of significance.
We conclude that, taking into account the uncertainties in fluxing, adopted distance, extinction and explosion epoch (see §1.1) the mass of 56Ni ejected by SN 2004dj was M⊙. We adopt this value for the rest of the paper.
3.3. Comparison of Observed Continua with Blackbody Radiation
Here we begin to consider the location and energy source of the SN
continuum, especially longward of 2 m where thermal emission from
dust would appear. To take an initially neutral standpoint on the
interpretation, we compared optical, NIR and MIR spectra and
photometry with blackbody continua. This provides us with the minimum
radii of the emitting surfaces. The epochs were selected primarily as
those for which MIR spectra were available, although the earliest such
epoch, 106 d, was already during the nebular era. The earliest MIR
photometry was acquired at 89 d when the SN light curve was only about
half way down the fall from the plateau to the nebular level. Given
the potential interest of this epoch we began our model comparisons at
this epoch despite the lack of an MIR spectrum. In addition, to
compensate for the large gap between 859 d and 1207 d we also
considered the 996 d SED based on MIR photometry only. Optical
photometry was taken from Vinkó et al. (2006, 2009); Zhang et al. (2006). Details about the
sources of the other data are given in Tables 1–4.
Apart from 89 d and 996 d, all the optical and NIR data plus the MIR
photometry were flux-scaled by interpolation of the light curves to
the epochs of contemporaneous MIR spectra.
The contribution of S96, represented by a 3500 K blackbody of radius
cm (see §3.1), was first subtracted from all the
data. To model the resulting m SN continuum it was found
to be necessary to use three blackbodies (“hot”: K,
“warm”: K and “cold”: 200 K). These were
reddened and then matched visually to the continua. The hot blackbody
was first added and adjusted to match the optical continuum. While the
hot blackbody provides some information about the energy budget of the
shorter wavelength part of the spectrum, the main reason for its
inclusion in this study was to allow correction for its effect on the
net continuum in the NIR where, up to about 500 d, it is comparable in
strength to the warm component. The warm blackbody was then added and
adjusted to match the m continuum plus the long
wavelength end (m) of the NIR continuum. It was found
that, starting at the earliest epoch, as the SN evolved the hot+warm
blackbody flux longward of 10 m increasingly fell below that of
the observations. Therefore a cold blackbody was added and adjusted
to provide the final match. For epochs where photometry but no
spectra were available we used the temporally nearest spectral matches
to indicate the likely position of the underlying continuum. The
expansion velocities of the blackbody surfaces, ,
and , and temperatures, , and
, for these matches are tabulated in Table 7. The
warm blackbody radii, are also listed. The model matches
are displayed in Figs. 13 ( d) and 14
( d). In Table 7 we also show the luminosities,
, and , of the three blackbody
components together with the sum of the hot and warm components
(). We exclude the cold component because, as will be
argued in §3.4.3.1, it is due to an IS IR echo which was predominantly
powered by the peak luminosity of the SN prior to the earliest epoch
of observation. In the final column is listed the radioactive
deposition power corresponding to the ejection of 0.0095 M⊙
of 56Ni, scaled from the SN 1987A case specified by Li et al. (1993)
& Timmes et al. (1996).
We stress that the blackbody matches were to the underlying spectral
continua where this could be reasonably judged, and not to the
photometric points which also contained flux from line emission.
Thus, the models sometimes lie below the average level of the spectra.
This is particularly so for later epochs at wavelengths shortward of
2 m where the spectra are dominated by broad, blended emission
lines. This tends to mask most of the underlying thermal continuum,
leading to a possible overestimation of the hot
continuum. Nevertheless, the blackbody luminosities tend to underestimate the total luminosity as they do not allow for the total
line emission. This is particularly the case around d when
the relative contribution of nebular line emission to the total
luminosity is at a maximum. There is less of a problem before this
era when the hot continuum is relatively strong, or afterwards when
the warm/cold continuum increasingly dominates. Also, by 652 d, the
relative weakening of the hot continuum means that it has a negligible
effect at wavelengths longward of 2 m. In the m region
the true continuum level is easier to judge. By 251 d and later, the
total m flux exceeds that of the continuum model by no more
than 25%.
The hot continuum declined monotonically and dominated the total SN
continuum luminosity up to about a year post-explosion. It presumably
arose from hot, optically-thick ejecta gas. At 89 d most of the hot
continuum was probably still driven by the shock-heated photosphere,
with the remainder being due to radioactive decay (see
Table 7 and Fig. 12). After 500 d the hot continuum
became relatively weak and of low S/N. In addition, the NIR spectral
dataset ended on 554 d. For subsequent epochs the strength of the hot
component was estimated by extrapolation. At 500 d the hot blackbody
match was achieved with a temperature of 10,000 K. Between 251 d and
500 d the blackbody velocity declined exponentially with an e-folding
time of 130 d and so, for epochs after 500 d the hot blackbody
temperature was fixed at 10,000 K and the velocity obtained by
extrapolation of the earlier exponential behavior (see
Table 7). While this is likely to be increasingly inaccurate
with time, it is unlikely to be a serious source of error in
determining the warm continuum; for example, by 500 d the hot
blackbody contributed barely 1% of the flux at
3.6 m. Consequently, and in order to illustrate the MIR behavior
in more detail, the optical/NIR region is not shown in the later plots
(Fig. 14).
The warm component luminosity declined monotonically to 281 d but
then, unlike the hot component, increased by a factor of 3.5
by 500 d. By that time the hot+warm SN continuum luminosity exceeded
that of the radioactive energy input by a factor of 4 and this
excess continued to increase with time. The cause of the growing
excess was the warm component luminosity. We also note that
more than doubled between 281 d and 500 d, but remained
roughly constant thereafter. In fact, as we show later (§3.4.4.1,
§3.4.4.2), after 500 d slow shrinkage in the size of the warm emission
region occurred.
The cold component is primarily defined by the 24 m point, and
can be fairly reproduced using a range of temperatures ( K)
and velocities. Its luminosity remained roughly constant throughout
the observations. In Table 7 we show the case with the
temperature fixed at 200 K.
It is interesting that, even as early as 89 d, warm and cold
blackbodies had to be included to achieve a fair match to the observed
fluxes in the NIR-MIR region. This will be discussed in §3.4.2 and
3.4.3.1. By 106 d, the nebular phase was just beginning and by 129 d
the hot+warm luminosity was driven predominantly by radioactive decay.
By 251 d and 281 d, the radioactive deposition exceeded the sum of the
hot+warm blackbody luminosity by about 15%. This excess probably went
into powering the line emission not included in the blackbody matches.
As already indicated, the nebular line emission was particularly
strong at this time. Indeed it was responsible for a
excess of the total bolometric luminosity relative to the radioactive
deposition (Fig. 12), indicating the emergence of an
additional energy source, probably the reverse shock (§3.4.4.2). The
appearance of an additional power source has already been indicated by
the flattening of the optical light curves (§2.2). Indeed, after
150 d the true BLC exhibited a steadily growing excess relative
to the radioactive deposition (see Fig. 12).
The hot and warm blackbody velocities never exceeded 1750 ,
indicating continuum emission consistent with an origin in the ejecta
or ejecta/CSM interface. The cold component exhibits velocities
between 4500 and 8500 during the earlier phase pointing
to an origin more likely to be outside the ejecta, specifically an IR
echo from pre-existing dust.
We conclude that the IR continuum comprised at least two components.
The temperatures and temporal variation of these components point to
thermal emission from dust whose energy source is ultimately the
supernova. The surge in the luminosity of the warm component by 500 d
suggests the emergence of an additional source of radiation — i.e.,
that the warm component was driven by different energy sources at,
respectively, early and late times. It also raises the possibility
that distinct dust populations were responsible for the early and
late-time warm components.
3.4. Origin of the Infrared Radiation
We now explore the origin of the IR continuum radiation from SN 2004dj, especially the warm component. To do this we have constructed a model continuum comprising hot gas, warm local dust, and cold IS dust. We also made use of spectral line red-wing suppression in the study of the warm dust. The continuum model was adjusted to provide visual matches to the observations.
3.4.1 The Hot Component
As in §3.3, the hot continuum component, presumably due to optically-thick ejecta gas, was represented using a hot blackbody having a temperature of 5300–10000 K. This blackbody radius and temperature was adjusted to obtain a match to the optical-NIR continuum. The warm component model (see §3.4.2 and §3.4.4.2) was then added and adjusted to match the 5–10 m continua plus the long-wavelength end (2–2.4 m) of the NIR continuum. As with the pure blackbody matches it was found that, at all epochs, the warm component model flux longward of 10 m increasingly fell below that of the observations. This excess is attributed to an IS IR echo (see §3.4.3.1).
3.4.2 The Warm Component: Early Phase IR Excess due to a CDS
As pointed out above, a striking result from the hot-blackbody matches
is that an NIR-MIR excess (relative to the hot component flux) was
present as early as 89 d post-explosion. (For brevity we henceforth
refer to the NIR-MIR continuum excess as the “IR excess”.) The MIR
spectra from 106 d onward show that this was primarily due to
continuum emission. We have no reason to suspect that the IR excess in
the 89 d SED was not also due to continuum emission. Indeed, the CO
peak at 4.5 m is noticeably suppressed at this epoch, compared
with 106 d (Fig. 3). The obvious interpretation of the IR
excess is that it arose from warm dust heated by the supernova. The
very early appearance of this emission, when the H-recombination front
had not yet reached the He-metal core, argues against an origin in
newly-formed ejecta dust. In addition, SN-ejecta dust-formation
models (e.g. Todini & Ferrara, 2001; Nozawa et al., 2003) suggest that dust formation in a
CCSN is unlikely to occur until after one year post-explosion. A
second possibility of direct shock-heating of pre-existing
circumstellar dust is also ruled out. The SN UV flash would evaporate
dust out to cm ( pc) (see
§3.4.3.1). To reach this distance by 89 d would require a shock
velocity of at least 65,000 . Yet the velocities of the H
trough (Korcáková et al., 2005; Vinkó et al., 2006) as well as of the extreme blue-profile edge
(our measurements of the spectra of Korcáková et al. (2005); Vinkó et al. (2006)) during the
period d suggests that the bulk of the ejecta never exceeded
velocities much more than 15,000 . Indeed Chugai et al. (2007)
adopt a velocity of 13,000 as the boundary velocity in their
treatment of SN 2004dj. A third possibility, CSM dust heating by
X-rays, is also implausible. The luminosity of the warm continuum
component at 89 d was (Table 7) but
the X-ray luminosity at 30 d was only about 1% of this (Pooley & Lewin, 2004).
In the case of dust in a CDS, collisional heating is ruled out as the
energy available in the CDS is about a factor of less than that
required to account for the observed IR excess. The heat capacity
of the grains is also insufficient to account for required energy.
The most likely explanation for the early-phase IR excess is an IR
echo of the SN early-time luminosity from circumstellar dust. There
are two possible scenarios here. In the first of these, the IR echo is
from pre-existing dust in the CSM. Such early IR echoes have been
suspected before in other CCSNe. Wooden et al. (1993) found an IR excess in
SN 1987A as early as 260 d and possibly also at just 60 d. They
hypothesised that the origin of the excess was warm, SN-heated dust in
the CSM. Wooden (1997) reiterates that the cause was CSM dust
“echoing the light curve”. Fassia et al. (2000) reported a strong
excess in the emission from the Type IIn SN 1998S at 130 d. They
attributed this to pre-existing CSM dust heated either by the SN
luminosity (a conventional IR echo) or by X-rays from the CSM-shock
interaction. Pozzo et al. (2004) argued in favor of the former scenario.
In the second IR echo scenario, as the fast moving ejecta collides
with the CSM, a CDS forms between the forward and reverse shocks. As
noted in §1, Chugai et al. (2007) have used the H spectrum to deduce
the existence of a CDS in SN 2004dj. Within the CDS conditions can
allow new dust to form (Pozzo et al., 2004). CDS dust has been invoked as the
origin of the early-time IR excess of SN 2006jc
(Smith et al., 2008; Di Carlo et al., 2008; Mattila et al., 2008). Mattila et al. (2008) showed that the IR emission
was probably an IR echo from the CDS dust. IR excesses in CCSNe at
later times have also been attributed to emission from newly-condensed
CDS dust viz. in the Type IIn SN 1998S (Pozzo et al., 2004) and the Type IIP
SN 2007od (Andrews et al., 2010).
We explored the possibility that the early IR excess was due to an IR
echo of the SN luminosity from spherical distributions of either
pre-existing circumstellar dust or newly-formed CDS dust. Details of
the model are given in Meikle et al. (2006). It fully allows for the effects
of light-travel time across the dust distribution. Versions of this
model have also been used in Meikle et al. (2007); Mattila et al. (2008); Botticella et al. (2009); Kotak et al. (2009). The
model assumes a spherically symmetric cloud of grains centered on the
SN, with a concentric dust-free cavity at the center. The SN is
treated as a point source. For simplicity, a single grain radius, ,
is adopted. For ease of computation, we assumed that the grain
material was amorphous carbon where, for wavelengths longer than , the grain absorptivity/emissivity can be well-approximated as
being proportional to (Rouleau & Martin, 1991). For shorter
wavelengths, an absorptivity/emissivity of unity was used. The
material density is 1.85 g cm-3 (Rouleau & Martin, 1991). Free parameters
are the grain size, grain number density, radial density law and
extent. The input luminosity is a parametrized description up to
550 d of the BLC shown in Fig. 12 viz.:
, where
, d for d,
, d for d,
, d for d,
, d for d.
, d for d
for d
is in units of . The brief but
highly luminous first term represents the energy in the UV flash. The
second term, which covers the pre-discovery phase, was estimated by
using the BLC of SN 1999em (Elmhamdi et al., 2003), adjusted so that the epoch
and luminosity of the beginning of its plateau phase coincided
approximately with the earliest observed point on the SN 2004dj BLC.
For the third, fourth and fifth terms, the adjusted BLCs of
Vinkó et al. (2006) and Zhang et al. (2006) were used (see §3.2). As already
pointed out, these BLCs did not include excess flux beyond about
1 m, nor any flux beyond 2.3 m; virtually all of the warm
and cold components were excluded. Thus, use of the above parametrized
description avoids “double-counting” of a putative CSM/CDS IR echo.
Indeed the BLC description slightly underestimates the true SN
luminosity input as it excludes all IR emission longward of 2.3 m,
as well as all UV emission shortward of 0.34 m. Consequently the
input luminosity was scaled by a factor of about 1.1 to allow
for unobserved UV and IR fluxes.
For the case of pre-existing CSM dust the model was adjusted to
reproduce the IR-excess SEDs for the three earliest epochs (89, 196
and 129 d). The outer limit of the circumstellar dust was initially
set at 10 times that of the cavity radius, and a (steady
wind) density profile was assumed. However, it was impossible to
reproduce the quite rapid temporal decline of the IR excess without
raising the temperature of the hottest grains to above their
evaporation temperature. While a better match to the SED shape and
evolution was obtained by setting the density profile to steeper than
, the best match was achieved with a discrete, thin shell. We
therefore adopted this configuration, setting the shell thickness at
the cavity radius.
We investigated a range of cavity radii. For pre-existing CSM dust
the minimum size of the concentric dust-free cavity is fixed by the
extent to which the dust was evaporated by the initial UV flash from
the supernova. In this scenario, while the bolometric light curve (BLC)
dominates the heating of the surviving dust, the size of the dust-free
cavity is determined by the luminosity peak of the UV flash, with
(Dwek, 1983). For a Type IIP SN the
flash luminosity is estimated to peak at about (Klein & Chevalier, 1978; Tominaga et al., 2009) although it has never been observed directly. A
similar peak luminosity is estimated for the Type IIpec SN 1987A
(Ensman & Burrows, 1992). Dwek (1983) provides an approximate estimate of the
flash-evaporated cavity size for a Type II supernova. More recently,
in a detailed study Fischera et al. (2002) determined that for SN 1987A the UV
flash would have totally evaporated graphite CSM dust out to a radius
of cm ( pc). We therefore adopt
the Fischera et al. estimates and apply them to the case of
SN 2004dj. In any case, matches to the data are fairly insensitive to
the cavity radii. Fair matches to the early-time IR-excess SEDs were
obtainable with cavity radii cm
( pc) and corresponding grain radii of
m. For cavity radii exceeding 0.05 pc the model
continuum slopes were inconsistent with the observations.
As an example of a pre-existing CSM dust model match we have:
cavity radius: cm (0.023 pc),
shell thickness: cm (0.0023 pc),
grain size: 0.07 m,
grain number density: cm-3,
total grain mass: M⊙.
The optical depth through the shell in the optical band is 0.006,
which is easily encompassed within the observed total extinction of
mag. For a dust/gas mass ratio of 0.005 (see §3.4.3.1), the
dust mass corresponds to a total shell mass of
M⊙. For the adopted shell thickness and
a typical RSG wind velocity of 20 , this mass would be produced by
a mass loss event about 1100 years ago, lasting for 110 years, with a
mass loss rate rate of M⊙ yr-1.
However, while this mass loss and loss rate are plausible for RSGs,
such discrete events are not thought to occur in this type of star.
This prompts us to seek a more natural explanation for the thin dust
shell. An obvious candidate is the CDS inferred by Chugai et al. (2007).
For the CDS scenario the size of the cavity is essentially the radius of the CDS. From Chugai et al. (2007), the CDS radius is given by
| (1) |
where (in days) is with respect to our explosion epoch. Thus,
at the earliest of our epochs, 89 d, the CDS radius was just
cm, or about one tenth of the pre-existing CSM dust
cavity. This is only 3 light days implying that light travel time
effects are small. Nevertheless, for convenience and ease of comparison
with the pre-existing dust case, we applied the IR echo model to the
CDS case. Although the Chugai et al. study terminates at just
99 d, we assume that the CDS radius continues to increase as described
in equation (1) until at least 500 d, by which time its
contribution to the IR excess is small.
We compared the CDS case of the IR echo model with the observations,
with the dust lying in a thin shell of radius as given
above. We found that setting the dust mass at a constant value
produced a poor match to the observations. With a match at 106 d, the
model at 89 d yielded a continuum which matched the observed IR excess
at 8 m but exceeded the IR excess by nearly at
3.6 m. On the other hand, at 129 days, while the model continuum
slope was similar to that of the observed IR excess, it significantly
underproduced it with the deficit being as large as 35% at
8 m. We propose that this problem is due to the unjustified
assumption of a fixed CDS dust mass. CDS dust could not form until
the supernova flux at the CDS had faded sufficiently for proto-dust
material to cool below the condensation temperature. This occurred at
about 50 d, assuming amorphous carbon dust. Therefore, following
Mattila et al. (2008) we allowed the CDS dust mass to grow as
where is time, is the time at
which dust condensation began (set at 50 d), is the
characteristic grain growth timescale and is the
asymptotically-approached final mass. (We note that
Mattila et al. also deduced an epoch of 50 d for the start of the
CDS dust condensation in SN 2006jc.) No attempt was made to simulate
the growth of individual grains which were assumed to appear
instantaneously at their final size. Owing to the light travel time
differences across the CDS, the grain condensation is seen to commence
during the epochs () to () days.
Yet, even as late as 500 d, was only about 12 light days
and so this effect was ignored.
In Fig. 15, we compare the CDS model light curves and spectra
with, respectively, the observed MIR excess fluxes at 3.6 m and
8.0 m (LH panel), and with the 89, 106 and 129 d MIR excess SEDs
(RH panel). The free parameters for the CDS case were the dust mass
scaler, the grain radius and the grain growth timescale. Satisfactory
reproduction of the IR excess was achieved for all five epochs
spanning 89–281 d with d, a grain radius of 0.2 m and a
final dust mass of M⊙, similar to the
dust mass derived in the pre-existing CSM case above. The CDS mass is
M⊙ (Chugai et al., 2007) indicating a plausible
final dust/gas mass ratio of 0.01. The hottest dust ranged from 1330
K at 89 days declining to about 640 K at 281 days. The optical depth
in the UV/optical range was 0.077 at 89 d falling to 0.011 by 500 d
— i.e., consistent with the observed total extinction of
mag. By 500 d the MIR excess exceeds that of the model by a
significant factor (especially at longer wavelengths)
(Fig. 15) implying the appearance of an additional energy
source. The CDS contribution to the SN continua for 89–500 d is
plotted in Fig. 18. The luminosity contribution of the CDS
IR echo, , is listed in Table 9, Col. 3. For epochs after
500 d the CDS component was negligible and so was ignored.
We conclude that the early-time IR excess was probably due primarily
to an IR echo from newly-formed dust lying within the CDS. The rapid
decline of the IR excess flux, especially between 89 d and
106 d, is due largely to the ongoing fall from the BLC plateau,
tempered by the growth of CDS dust during this period. Owing to the
small size of the CDS, light travel time effects are small. In
contrast, in the pre-existing CSM dust scenario, the rapid decline of
the input luminosity is tempered by the larger size of the dusty shell
which produces significant light travel time effects, smoothing the
observed IR excess light curve over longer timescales. Nevertheless,
given the natural explanation by the CDS model of the required thin
shell dust distribution, in the completion of the analysis below we
use the CDS scenario.
3.4.3 The Cold Component
3.4.3.1 An Interstellar Echo
The cold component is defined primarily by the 24 m data and can
be fairly reproduced using a range of temperatures ( K) and
velocities. As described above (§3.3), the luminosity of the cold
component remained roughly constant throughout the observations. In
addition, the cold blackbody velocities were high, arguing against an
origin in ejecta dust. An obvious alternative is an IS IR echo. The
possibility of detecting the reflection of SN optical light from IS
grains was first suggested by van den Bergh (1965). In the IR a potentially
much more important phenomenon is the absorption and re-radiation by
the grains of the SN BLC energy (the “IR echo”). The possibility of
detecting an IS IR echo from a SN was first proposed by
Bode & Evans (1980).333Wright (1980) also considered an IR echo from
a SN but only in the more restricted case of an explosion within a
molecular cloud. The occurrence of cold dust IS IR echoes should be
relatively common for SNe occurring in dusty, late-type galaxies. The
SEDs of such echoes tend to peak in the m region, allowing
echo detection in nearby galaxies by Spitzer during its cold
mission. Spitzer-based evidence of this phenomenon in the Milky
Way Galaxy have been presented for the Cassiopeia A SN
(Krause et al., 2005; Kim et al., 2008; Dwek & Arendt, 2008). Meikle et al. (2007) showed that an IS IR echo
provided a natural explanation for the strength and decline of the
24 m flux between d and 1264 d in SN 2003gd in the
SA(s)c galaxy NGC 628 (M74). Kotak et al. (2009) showed that the cold
component of the SN 2004et SED was most likely due to an IS IR echo in
the SAB(rs)cd host galaxy NGC 6946. The host galaxy of SN 2004dj,
NGC 2403, is of type SAB(s)cd and so there is a good likelihood of a
similar IS IR echo occurring. Therefore, we included an IS IR echo
component in our modelling of the SED.
Our IS IR echo model is the same as that used for the
early-time CDS IR echo (§3.4.2). Only the dust distribution and
grain radii are different. We ignore the CDS dust emission derived in
§3.4.2 since this is already invoked in the CDS echo model and
included in the continuum modelling up to 500 d. We recognise that
a more extended, lower density CSM may also have existed. However, we
found that the addition of yet another model component was unnecessary
to provide plausible matches to the continua and so for simplicity the
possible effects of an extended CSM were ignored.
As described in §3.4.2, pre-existing dust surrounding the SN would
have been evaporated by the SN flash out to a distance of about
0.025 pc. At sufficiently late epochs, enlargement of this cavity can
be produced by the forward shock. Assuming that the shock velocity is
comparable to the highest ejecta velocity viz. 15,000 (see
§3.4.2), and that there was no deceleration, the edge of the
UV-flash-determined cavity would be reached after about 600 d. After
this time, the SN shock would evaporate the dust and enlarge the
dust-free cavity. Therefore, for epochs earlier than 600 d we fixed
the inner limit of the IS dust at 0.025 pc. For later epochs the
inner limit of the IS dust increases from 0.028 pc (34 light days) at
662 d to 0.058 pc (70 light days) by 1393 d. It might be objected
that this ignores the possibility of shock deceleration. However, the
IR echo contribution which the shock-evaporated dust would otherwise
have made, for d, to the cold component is negligible
since the cavity radius was never more than 70 light days i.e. during
this late period the SN peak luminosity would have long since passed
by the dust near the cavity.
The outer limit of the IS dust is much less certain. Bendo et al. (2010)
have used Spitzer imaging of NGC 2403 at 70 m and
160 m to map the dust column density via its thermal emission.
They also used the far-IR images in conjunction with H I observations
to map the gas/dust ratio. The objection to using such measurements in
the present work is that they only provide total densities through the
disk (or to the mid-plane assuming symmetry), and not directly to
SN 2004dj. While it was argued above that SN 2004dj actually lies
towards the front of S96, we are still faced with the uncertainty of
the depth of S96 in the galaxy plane. Our approach, therefore, is to
assume a spherically symmetric dust distribution centered on the SN,
with an outer limit of 100 pc. While not appropriate in principle for
the outer limits of the dust in the galactic disk, for the early era
being considered spherical symmetry provides a good approximation; at
this epoch, the echo ellipsoid is extremely elongated and so the
region of the spherical model outer surface intercepted by the
ellipsoid is small. The plane of NGC 2403 appears to be tilted at an
inclination of about roughly doubling the face-on column
density, and so the adopted outer limit is equivalent to a 60 pc
scale height for the IS dust with the host galaxy face-on.
The free parameters were (i) the grain size, which influenced the dust
temperatures, and (ii) the grain number density, which determined the
luminosity. These parameters were adjusted in conjunction with the
warm dust models (see §3.4.2 and §3.4.4.2) to provide a match to the
longwave excess. It was found that satisfactory matches at all epochs
were obtained with a grain radius of 0.1 m and a dust number
density of cm-3 (i.e., an IS gas number
density of 0.24 cm-3 and a dust/gas mass ratio of 0.005 -
Bendo et al. 2010.) This is comparable to the typical value of
cm-3 for the Milky Way (Allen, 1973) and
cm-3 obtained by Kotak et al. (2009) for NGC 6946.
In the wavelength region (m)
where the cold component makes a significant contribution () to
the total flux, the IS IR echo model (15–150 m) maintained a
near-constant luminosity of between 89 d
and 1393 d.
The Bendo et al. dust column density map of NGC 2403 indicates
0.05 M⊙pc-2 at the position of SN 2004dj. From the above
dust number density from the echo model and integrated over 100 pc we
obtain just 0.003 M⊙pc-2. The absorption opacities used
by Bendo et al. are consistent, to within a factor of ,
with the opacity law used in the present work. Thus, we have a
8 discrepancy in column density between Bendo et al.
and the present work. Part of this discrepancy may be that the
adopted dust outer limit is too small. The derived IS dust
density is fairly insensitive to the extent of the outer limit. For
example, with a 75% increase in the outer limit the model match to
the longwave continuum is retained with a reduction of just 10%
in the IS dust density. Thus, at least some of the discrepancy could
be removed by simply increasing the dust outer limit. An explanation
for the remaining discrepancy is that the SN and S96 actually lie
significantly above the mid-plane of NGC 2403. This is confirmed as
follows. The optical depth to UV/optical photons yielded by the model
is about 0.026. We can use this to estimate independently the host
extinction to SN 2004dj. The optical depth translates to an
absorption-only extinction of 0.028 magnitudes. Assuming an albedo of
about 0.4 (Draine, 2003), we obtain a total host extinction of
0.071 mag. This is reasonably consistent with the host-only value of
mag () obtained via the Na I D observations of
Guenther & Klose (2004). A similar result is obtainable from our study of
SN 2004et (Kotak et al., 2009). For SN 2004et, the IS IR echo model yields an
absorption-only extinction of 0.081 mag implying a total host
extinction of about mag. High resolution spectra of Na I D
lines to SN 2004et gave a total (host plus Galaxy) mag
(Zwitter et al., 2004), or mag (). Subtracting the
estimated Galactic contribution of mag (Schlegel et al., 1998; Misra et al., 2007)
yields a host-only value of mag, in excellent agreement
with the IS IR echo-based value.
One possible objection to the IS IR echo interpretation of the cold
component of SN 2004dj is that the steady component of the flux around
24 m could be due to cool IS dust in S96, insufficiently
corrected for by the 3500 K blackbody extrapolation (§3.1). We
regard this as unlikely. As already indicated, Maíz-Apellániz et al. (2004) argue
that the parent molecular cloud of S96 should have been dispersed by
stellar winds and SN explosions. In addition we have found that (a) a
single set of IS IR echo parameters provided a fair match throughout the d covered and (b) the derived dust column
density is comparable to that obtained from IS Na I D spectroscopy.
A second possible objection to the IS IR echo interpretation is that
the cold component is actually due to free-free emission. This is
discussed and dismissed in §3.4.3.2.
We conclude that the cold component of SN 2004dj was due to an IS IR
echo. As originally suggested by Bode & Evans (1980), the study of IS IR
echoes from SNe can provide an independent method of measuring the IS
extinction in galaxies.
3.4.3.2 Free-Free and Free-Bound Radiation
In their MIR study of SN 1987A, Wooden et al. (1993) suggest that during the
d period, a significant proportion of the MIR flux longward
of 20 m was due to free-free (ff) emission, with ff and
free-bound (fb) emission also contributing at shorter wavelengths. For
SN 2004dj we have looked at the possible contribution of fb-ff
radiation. It is particularly important to consider ff emission as
this rises in flux towards longer wavelengths, thus potentially
reducing or even dismissing an IS IR echo contribution. For
consistency in this analysis fb emission must also be included. For
the wavelengths covered this is strongest in the optical/NIR region.
Free-bound radiation has a strong “sawtooth” structure and the
extent to which this structure is undetectable in the optical/IR
continuum places a limit on its strength. For a particular
temperature this, in turn, constrains the strength of the ff emission
().
The fb-ff radiation was assumed to arise in a hydrogen envelope centered on the supernova. Kozma & Fransson (1998) modelled the time-dependent behavior of the temperature and ionization of SN 1987A, including the hydrogen envelope, for epochs after 200 d. Therefore, we made use of their study to model the ff and fb emission from SN 2004dj at epoch 251 d and later. We adopted a hydrogen envelope of a few solar masses and used their density profile:
| (2) |
By 251 d, the highest velocity of observable hydrogen in SN 2004dj was
no more than (Table 8). By 925 d the
maximum H velocity observed in SN 2004dj was no more than 1400 .
There were no optical or NIR spectra covering the final three MIR
epochs. We therefore assumed that the maximum hydrogen velocity at
these late epochs remained at 1400 . The hydrogen inner limit is
less certain; a value of 1000 was adopted for all epochs. In any
event, the fb-ff luminosity from 500 d onwards was completely
negligible for any plausible hydrogen velocity limits (see below).
We estimated the fb-ff emission from the hydrogen within the velocity
limits. This was done using the escape probability formalism
(Osterbrock, 1989), although in practice this was unnecessary as the
matches to the data always showed that the hydrogen was very optically
thin. The mass of the fb-ff-emitting hydrogen fell from
4 M⊙ at 251 d to 0.75 M⊙ at 996, 1207 and
1393 d. Using modest extrapolation of figure 7 in Kozma & Fransson (1998) to
the velocities observed in SN 2004dj, we deduced that the hydrogen at
the observed velocity limits stayed at a temperature of 5000 K
up to 859 d and then declined to 2000 K by 1393 d. The
fractional ionization, , was obtained from figure 9 of
Kozma & Fransson by interpolation. This indicated
at 251 d, falling to by 1393 d. At each epoch, the
and values were assumed to apply to all the hydrogen
within the velocity limits. The Kozma & Fransson study did not
extend to epochs as early as the earliest MIR observations (89, 106,
129 d) of SN 2004dj. We therefore adopted 6000 K as a plausible
temperature for these epochs and allowed the ionization to take the
largest value consistent with the overall match to the observed
continuum. Plausible values were obtained, viz: at
89 d rising to at 129 d. We used Gaunt factors
tabulated by Hummer (1988). For the fb radiation we used the continuum
recombination coefficients of Ercolano & Storey (2006).
The hydrogen maximum velocity, temperature and free electron density
for each epoch are listed in Table 8. The fb-ff luminosities
are listed in Table 9, col. 4. It can be seen that by
500 d the fb-ff contribution to the total luminosity is small,
becoming increasingly negligible at later epochs The fb-ff components
for 89–281 d are plotted in Fig.18. At 500 d the fb-ff flux
is too weak to appear on the 500 d plot which has been scaled to allow
easy comparison with the earlier epochs. A more comprehensive
estimation of the fb-ff flux, taking into account the temperature and
ionization gradients, is beyond the scope of this paper.
As noted in §3.4.3.1, in the wavelength region (m)
where the cold component makes a significant contribution () to
the total flux, the IS IR echo maintained a near-constant luminosity
(15–150 m) of between 89 d and
1393 d. Moreover, in setting the IS IR model to reproduce the
longwave excess at the latest epochs, when the fb-ff flux was
negligible, it was found that a satisfactory match to the longwave
(m) excess was automatically achieved for all
epochs. Consequently, the fb-ff flux could make, at most, only a minor
contribution even at the earliest epochs. We conclude that any
free-free emission was too weak to account for the cold component at
any epoch.
3.4.4 The Warm Component
3.4.4.1 Late-Time Optical and NIR Line Profiles
In §2.4 we described the evolution of optical and NIR line profiles
in a number of species. In particular, we noted the development of a
sharp suppression in the red wing, suggesting dust formation causing
obscuration of the far side of the ejecta. Could this dust also be
responsible for the warm component at later epochs? In this and the
next sections we explore this possibility. Here we examine the
distributions of dust that might give rise to the late-time
optical/NIR line profiles. In §3.4.4.2 we shall then test the
hypothesis that the same dust distributions are responsible for the
warm component. We modelled the line profiles of H,
Pa, [O I] 6300 Å, [Fe II] 7155 Å and [Fe II] 12567 Å.
The period d was studied since this was mostly
overlapped by the d during which the blackbody
analysis and more detailed studies of the MIR emission (§3.4.4.2)
suggest that substantial quantities of dust were present in the
ejecta. We note (Table 6) that the H line widths
towards the end of the bright plateau phase greatly exceeded those
observed on 461 d and later, implying that there was a negligible
contribution of any light echo of the early phase profiles to the
late-time profiles.
We did also examine the blue asymmetry of the H and
[Fe II] 7155 Å profiles at a much earlier epoch (283 d) but were
unable to achieve a satisfactory match using the model adopted for
later epochs. In any case, as already demonstrated in §3.4.2, we
were able to account for the 251/81 d IR excess as thermal emission
from dust formed in the CDS. Moreover, Chugai et al. (2005) and Chugai (2006)
successfully explained the H profile up to 300 d by
invoking the emergence of an intrinsic asymmetric, bipolar core
(i.e. no dust involved). We conclude that there is no evidence for
the formation of new ejecta dust earlier than 461 d.
The line-profile red wings exhibit increasingly abrupt declines after
1 year (Fig. 10) suggesting the condensation of
attenuating dust. In contrast, the extended blue wings exhibit little
sign of developing suppression. This behavior points to the
attenuating dust lying at low line-of-sight velocities, such as a
face-on disk-like distribution centered on the SN center of mass.
Nevertheless, in our initial considerations of possible dust
configurations we included the case of a spherically symmetric dust
sphere. Our line-profile model comprises a homologously expanding
sphere of gas responsible for most of the observed line flux, with the
emission being attenuated by a dust zone lying concentrically with the
gas sphere. The dust zone is also assumed to participate in the
expansion. The gas emissivity is assumed to have a power-law
dependence with radius.
Several arrangements of dust were examined. These were (i) a uniform
opaque sphere (Fig. 16, upper panels), (ii) a face-on opaque
ring, and (iii) a thin face-on disk (Fig. 16, lower panels)
whose opacity was uniform or varied radially as an power
law along the disk plane but was always uniform normal to the disk
plane. (For the disks, “opacity” refers to the value normal to the
disk plane.) For the radially-varying version of (iii), a power law
index of was chosen as typical of the power law indices
determined for the gas emission profiles. Configurations (i)–(iii)
were initially tested against the 895 d optical profiles since these
were (a) of the highest available resolution, and (b) corresponded to
a time by which the SN spectral continuum was overwhelmingly dominated
by thermal emission from dust. Configurations (i)–(ii) could not
reproduce the observed line profiles. This is illustrated in
Fig. 16 (upper panels) where we show two examples of the line
profile produced by an opaque, concentric dust sphere, compared with
the observed [O I] 6300 Å profile at 895 d. Only configuration
(iii) - the dust disk - was able to reproduce the observed profiles.
Within this configuration we examined cases where the dust
distribution (a) extended beyond the gas limit, (b) ceased abruptly at
a given velocity within the gas sphere, or (c) extended uniformly to a
given velocity, , and then declined as a power law to the
edge of the gas sphere. Case (a) failed to reproduce the observed
line profiles. Cases (b) and (c) are discussed below.
As described in §2.4, by 895 d and 925 d, a “secondary”, weaker,
redshifted peak had also appeared in the H and [O I] 6300 Å profiles, suggesting that a fraction of the line flux originated in an
emission zone centered on the SN and having the geometry of an
expanding ring, jet or cone. The second peak had a redshift of only
+160 to +170 . Given the preference for a thin face-on disk of
attenuating dust to account for the asymmetry of the line profiles, a
natural explanation for the low velocity of the second peak is that
its source was actually at a velocity comparable to that of the gas
sphere, but moving in a way which was roughly coplanar with the dust
disk. Consequently the low inclination angle led to the low observed
redshift in the second peak. The simplest geometry which accounts for
the second peak is a ring-like emission zone whose plane lay at a
small angle to the “face-on” plane. A cone or jet geometry is more
problematic. If we insisted on maintaining axial symmetry then a
cone/jet would have to be normal to the disk but with a mysteriously
low velocity. Alternatively, a cone/jet lying near the disk plane,
while possibly allowing a high intrinsic velocity, would have the
unattractive feature of breaking the axial symmetry. Therefore, to
account for the second peak, we added a thin, near-coplanar ring of
emitting gas to the line-profile model (cf. Gerardy et al., 2000; Fransson et al., 2005, for the case of
SN 1998S). The ring was assumed to participate in the
overall homologous expansion of the gas.
We set the intrinsic ring velocity equal to the fastest moving gas
observed viz. hydrogen at 2400 as indicated by the H blue
wing on 895 and 925 d, although higher velocities could have been
used. Consequently the ring emission is unattenuated by the dust.
For ease of computation, we retained a face-on disk ().
Tilting the disk to become exactly coplanar with the ring would have
had only a small effect on the line profile.
In matching the model to the observed profiles the free parameters for the gas are the maximum (outer) velocity of the gas sphere, , the gas emissivity scaling factor and power-law index , the inclination, , of the ring component assuming an intrinsic expansion velocity of 2400 , and the ring component emissivity assumed uniform. In addition, the overall wavelength positions of the observed profiles were allowed to vary by small amounts (see below). For ease of comparison, the dust-disk dimensions were also expressed as velocities within the homologous expansion. Thus, for the case (b) dust disk the free parameters are the maximum radial velocity of the dust disk, , the maximum velocity, , perpendicular to the disk plane and the magnitude of the dust radial density power-law index, . Multiplication of and by the epoch yields, respectively, the disk radius and thickness at that time. For case (c) is replaced with . We adopted amorphous carbon as the grain material (see §3.4.4.2) and a power law grain-size distribution, index (Mathis et al., 1977), with m and m. The optical depth normally through the disk was then calculated. For example, for case (b) the optical depth for emission from gas lying behind the disk at wavelength , epoch and radial velocity , , is given by:
| (3) |
where is proportional to the grain number density, at a fiducial
epoch, to the radial velocity and to the grain radius, is the
grain material density and is the mass absorption
coefficient of the grain material at wavelength . For
emission from gas lying within the disk the same formula is used but
replacing with the velocity equivalent to the path from the
emission point to the near side of the disk. The disk thickness was
always of the disk diameter and so edge-effects at the disk’s
outer limit were assumed to be negligible.
The gas emission profiles (i.e., those for the attenuated sphere and
unattenuated ring) were individually convolved with the appropriate
slit PSF. The PSF FWHM values were 6.5, 4.2, 6.5, 1.25, and 1.75 Å for 461, 467, 554, 895, and 925 d, respectively. The two components
were then summed to form the final model profile which was compared
with the observed profile. The profile model (case (b) disk) was
adjusted to match the observed profiles as follows. The parameters
, and the gas sphere emissivity scaling factor
were adjusted to provide a match to the blue wing of the
profile. Then, for a given value of (0 or 1.9),
(equivalent to the disk half-thickness) together with the grain number
density scaler, , were adjusted to reproduce the sharp-decline
section of the profile. The velocity was varied to
reproduce the suppressed red wing. The gas ring emissivity and
inclination were then adjusted to reproduce the secondary peak. Some
iteration of all the model parameters was necessary to reach the final
profile match. For the profile model (case (c) disk)
was replaced with , and was allowed to vary to
arbitrarily large steepness.
The offset of the sharp-decline section of the profiles from zero
velocity was only about after correction for the +221 of the heliocentric velocity. Consequently, the match to the
sharp-decline section of the profile (i.e., determination of the disk
half-thickness) could be significantly affected by errors in
individual wavelength measurements or intrinsic variations in the
distributions of different gas species. Forcing a match in each
case by letting the wavelength position of each observed profile to
vary by small amounts, we were able to estimate the disk
half-thickness and its uncertainty. For a heliocentric velocity of
+221 we obtained a disk half-thickness equivalent to
. There was no significant variation in
during the period covered by the profile study. Note that a
change in the heliocentric velocity estimate would yield the same
change in the disk half-thickness velocity.
As indicated above, we first carried out model matches to the 895 d
profiles. It was found that the best case (b) matches were obtained
when the disk was highly opaque (say, ) at all radial locations.
For case (c), comparably good matches were achieved by setting the
uniform zone at a high opacity () and at values
steeper than — i.e., the dust density beyond the uniform zone
had to be extremely steep. Less steep declines tended to suppress the
visibility of the central minimum. We conclude that the dust disk was
highly opaque in the optical region but terminated abruptly at an
approximately fixed radius (see §3.4.4.2). Given that this
condition was indicated by both cases (b) and (c), we abandoned the
more complicated case (c) model and completed the analysis for all the
461–925 d spectra using only case (b) — i.e., a dust density which was
uniform or declined radially as and which terminated
abruptly at .
The models for 895 d were initially adjusted to determine the minimum opacity – that is, the minimum dust mass that was needed to provide a satisfactory match to the observed profile. The dust masses were obtained from the following:
| (4) |
At 895 d, with a uniform disk (), the dust extended to
i.e. cm. The disk half-thickness was
19% of this. Simultaneous matches to all three profiles (H,
[O I] 6300 Å, [Fe II] 7155 Å) required a minimum of 13 at
6300 Å, corresponding to a minimum dust mass of
M⊙. Note that the high optical depth was
demanded by the very sharp decline, unresolved even at the
1.25 Å resolution of 895 d. Other parameters are:
cm, , (ring flux)/(total flux)
= 0.07 and ring tilt = .
In using the dust-disk model to reproduce the contemporary MIR
continua (§3.4.4.2) it was found that the opacities and dust masses for
all lines and epochs had to be somewhat higher than the minimum values
required to match the observed optical and NIR line profiles. For
example, for [O I] 6300 Å at 895 d and a uniform disk it was
necessary to set , corresponding to a minimum dust
mass of M⊙. In the rest of this
subsection, therefore, we present and consider results for profile
matching incorporating dust-disk masses obtained by interpolating to
the profile epochs the values obtained from the MIR continuum
modelling. A sketch of the case (b) [O I] 6300 Å uniform
() disk model at 895 d, is shown in Fig. 16 (lower
LH panel) together with an illustration (lower RH panel) of the model
match (solid red line) to the observed profile (blue). Also shown are
the intrinsic line-profile contributions from the attenuated gas
sphere (green) and unattenuated gas ring (cyan) components, as well as
the final profile (dotted red line) which would result if the
attenuating dust were removed. In Fig. 17 we show all the
individual matches to the line profiles for 461–925 d. In general,
good matches were achieved for epochs 554 d, 895 d, and 925 d. Poorer
matches were obtained at 461 d and 467 d.
On 895 d and 925 d the model did not reproduce the extended red wing
seen in the [Fe II] 7155 Å profile. This suggests an additional,
faster moving component of iron, and may be indicative of 56Ni
asymmetry or “bullets” in the initial explosion
(e.g. Burrows et al., 1995). At the earliest two epochs (461 d and 467 d)
the model matches are also poorer. Specifically, if the model was
adjusted to match the full suppression of the extreme red wing, then
it also over-attenuated the less redshifted portion of the red wing;
in other words, the steep red decline in the observed profile is
generally less pronounced at these earliest epochs. Alternatively,
matching to the less redshifted portion of the red wing meant that the
full suppression of the extreme red wing was not reproduced. These
points suggest that, during the 461–467 d period, dust formation was
less complete and was not yet fully opaque over the whole disk. We
therefore adjusted the models to reproduce the suppression of the
extreme red wing, but recognise that the derived dust mass lower
limits for 461–467 d may well be overestimated.
Between 554 d and 925 d the minimum dust mass increased from
M⊙ to M⊙.
During this time the radius of the dust disk appeared to actually decrease slightly from cm to
cm. We explored the possibility that this was due
to a declining optical depth as the disk expanded — i.e., that while
the dust disk continued to expand, the optically-thick/thin boundary
declined in radius. We found that the requirement of a steep, sharp
cutoff at the disk limit (see above) ruled out this explanation
implying that the decrease in the dust radius was real. This issue
will be considered further in §3.4.4.2.
The above analysis was repeated with . Similar disk radii
were obtained, but the minimum dust masses were 20 larger
than for . This is as one would expect. To maintain the
line-profile matches with required the maintenance of a
high optical depth at the disk edge in the optical/NIR wavelength
range. If we demand that the optical depths be the same at for both and then it may be shown that
, where is the dust
mass for a given value of and is the mass for
. Thus, for , . We note
that this assumes that the power law continues to the center, which is
unlikely to be the case. Indeed for or more, the mass would
be infinite. A more plausible behavior would be that the density law
flattens toward the center. For example, if we assume that within
the dust density became uniform, with
outside , then the total minimum dust mass would
only be about a factor of 3 larger than for the totally uniform disk
case — that is, about M⊙
The model gas sphere expansion velocity remained at around 2400 in hydrogen at all epochs. Similar velocities were obtained in
[Fe II] 12567 Å at 461 d and 554 d, and in [O I] 6300 Å and
[Fe II] 7155 Å at 467 d. By 895 d and 925 d the expansion
velocities in [O I] 6300 Å and [Fe II] 7155 Å had fallen to less
than 1000 , perhaps suggesting some stratification by element. At
554 d and earlier epochs, the ring flux was negligible. At the later
epochs, the ring inclination is (i.e., close to face-on).
The fractional contribution of the ring to the total observed flux
never exceeded 20%. Indeed, were it not for the dust disk, it is
unlikely that the relatively weak ring emission would have been
detected since it would have been swamped by the emission from the gas
sphere (see Fig. 16). We therefore regard the ring component
as an interesting but minor effect.
We conclude from the line-profile analysis that, in the 461–925 d
period, the mass of the dust disk and its radial extent can be small
enough to be consistent with an origin as newly-condensed ejecta dust.
In §3.4.4.2 we shall show that the same dust disk can account for the
MIR continua.
3.4.4.2 Later Phase IR Excess and Ejecta Dust Condensation
We have argued that, up to at least 281 d, the warm
component could be fully accounted for in terms of an IR echo from a
CDS. By 500 d the warm component luminosity exceeded the CDS
contribution by a factor of . This “late IR excess”,
together with the steady shift of the peak emission of the SED to
longer wavelengths in the period d (Figs. 3,
5) suggests the appearance of an additional population of
warm, but cooling dust. What is the location, distribution and
heating mechanism of this dust? Such IR emission can arise from (i)
heating, by a number of possible mechanisms (see below), of new dust
formed either in the ejecta, or in a late surge of dust growth within
the CDS or (ii) heating of pre-existing circumstellar dust by the
early-time SN luminosity (a conventional IR echo), or possibly the
forward shock travelling into undisturbed CSM beyond the CDS.
We can dismiss immediately hypothesis (ii):
(a) An IR echo does not naturally produce the long delay (at least
d) before the commencement of the warm component excess flux
rise. To account for this within an IR echo scenario, we would have
to invoke an ad hoc asymmetry in the CSM.
(b) IR-echo or forward-shock heating would not account for the
observed late-time red wing suppression in the spectral line profiles
discussed in §3.4.4.1. In contrast, red-wing attenuation can easily be
produced by dust formation in the ejecta. New CDS dust could
conceivably also have produced such an effect provided that the dust
did not lie completely outside the optical/IR emission zone.
(c) Pre-existing CSM dust, whether heated by the SN luminosity or a
forward shock, would not produce steepening of the optical-NIR decline
rate simultaneously with the appearance of the late IR excess. In
contrast, new dust in the ejecta or CDS can be indicated by
optical-NIR steepening. In Fig. 4, after 470 d the
light curves show weak evidence of steepening, providing a
minor additional argument against a CSM IR echo origin for the later
warm component, although the errors on the latest points are large.
We also note that an alternative explanation for such steepening could
be a faster-than-expected decrease in the -ray absorption
relative to that invoked by Li et al. (1993) for the radioactive energy
deposition in SN 1987A (Fig. 4).
The above points, especially (a) and (b), leaves us with
hypothesis (i) viz. that the late IR excess is due to emission from
new dust formed in either the ejecta or CDS. The later-era appearance
of the red wing suppression coincides roughly with the emergence of
the late IR excess, suggesting that the same dust could have been
responsible for both the optical/NIR attenuation effects and the rise
of the MIR emission. That this dust formed in the ejecta rather than
the CDS is indicated by the fact that the extent of the attenuating
dust derived from late-time line-profile analysis was comparable to
that of the MIR-emitting dust as derived from blackbody analysis; for
example, at 859 d the blackbody radius is cm compared
with a profile-derived radius of cm at
895 d. Moreover, the line-profile analysis demonstrates that the dust
was of high opacity in the optical/NIR, and distributed as a near
face-on disk lying concentrically with the SN center of
mass. Attenuation by a CDS could not have produced the late-time line
profile behavior.
In view of the above points, we shall now give detailed consideration
to the scenario where the warm component emission originated in
newly-formed ejecta dust. Such dust could be heated by a number of
mechanisms including radioactive decay, ionization freeze-out effect,
embedded pulsar or reverse-shock radiation. In the case of SN 2004dj
we can rule out radioactivity as the principal heating mechanism of
any putative new ejecta dust. Inspection of Table 7 shows
that, as early as 500 d, the warm component flux exceeded the total
deposited radioactive luminosity by a factor of 2 growing to a factor
of by 1393 d. Indeed, by the latest epoch, the warm
component luminosity was still as high as .
We also rule out the freeze-out effect as the main energy source
(Clayton et al., 1992; Fransson & Kozma, 1993) since, at d, its contribution would
only be ergs.
Power input from an embedded pulsar, via a pulsar wind nebula, is
another possibility (Woosley et al., 1989; Chevalier & Fransson, 1992). Chevalier & Fransson predicted
that a distinctive feature of such a source would be the presence of
certain high ionization lines. The earliest epoch they studied was at
1500 d. The nearest of our optical/NIR spectra to this epoch are those
at 895 d and 925 d. Of the high ionization lines for which
Chevalier & Fransson make luminosity predictions, only
[O III] 4959/5007 Å was covered by these spectra. We co-added the
spectra at the two epochs and searched for the stronger
[O III] 5007 Å component. A broad, low S/N emission feature was
detected with a dereddened luminosity of
. This is about half the luminosity
predicted by Chevalier & Fransson. A serious difficulty is that the
redshift-corrected position of the feature lies about +400 from
where it would be if due to an [O III] 5007 Å line subject to the
same dust attenuation deduced in other lines (§3.4.4.1). Even without
dust attenuation, the feature would still be +200 too far to the
red. This, together with the low S/N, leads us to conclude that there
is no persuasive evidence for the presence of pulsar-driven
high-ionization features in the latest spectra of SN 2004dj. This
leaves us with reverse-shock heating of the ejecta following the
ejecta-CSM collision as the most promising mechanism for the late-time
energy source
To test further the hypothesis that the same dust was responsible for
the late-time line-profile red-wing suppression and the MIR emission
we modelled the IR emission over a range of late-time epochs using the
same dust-disk configuration as was employed in the line-profile
analysis. The emission was derived following a similar procedure to
that used in the isothermal dust model by Meikle et al. (2007) and
Kotak et al. (2009). The resulting flux was then added to the other
continuum components and the net model compared with the observed
continua.
We considered the thermal radiation from a warm, isothermal, face-on disk of dust located symmetrically about the SN center of mass. We shall refer to this as the IDDM (isothermal dust-disk model). The disk radius is and, as in §3.4.4.1, the dust number density declines as where is set as 0 or 1.9. As mentioned above the disk thickness was of the disk diameter and so we judged that a thin-disk treatment would provide an adequate means of estimating the flux from the disk (i.e., edge effects are ignored). The observed IDDM flux, , at wavelength and time from an elemental ring lying between radii and is:
| (5) |
where is the distance of the SN, is the Planck
function, and is the optical depth
perpendicularly through the disk. The total flux is then found by
integrating from to . The dust mass is
obtained from equation (4). Amorphous carbon grains were assumed
(silicate grains are discussed below). As explained before, during
the d period ejecta dust formation was unlikely and in any
case the early IR excess was explainable as emission from CDS dust.
Therefore the IDDM was introduced at 500 d and used at all subsequent
epochs. By 652 d the CDS IR emission was negligible and so was not
included in the modelling of this or subsequent phases. We first
describe the results with in the IDDM. The matches
together with the observations are shown in Figs. 18 and
19. The overall model parameters are listed in
Table 8.
The three MIR observation epochs 500 d, 652 d and 859 d lay within the
timespan of the line-profile analysis. We therefore imposed the
constraint that the disk radius had to be consistent with those values
derived from the line profiles – that is, cm and where
, with (and therefore ) being
constrained by the demand that the disk have a high optical depth in
the optical/NIR region (§3.4.4.1). In practice, matching the IDDM to
the MIR continuum demanded optical depths which were higher than the
minimum values obtained from the line-profile analysis. The disk
parameters for the specific MIR epochs were set by linear
interpolation of the line-profile-derived values for
and . The parameter could take values at or above
those set in the line-profile analysis. Only was a completely
free IDDM parameter. By 500 d the MIR continuum up to 20 m
was overwhelmingly due to the warm dust disk, with the CDS component
yielding no more than 8% of the total flux at any wavelength.
For m, the IS IR echo dominated. Also from
500 d onwards the hot continuum and fb-ff contributions to the MIR
were negligible. In other words, from 500 d onwards, only the dusty
disk and IS IR echo made significant contributions to the total MIR
continuum. Consequently, and in order to show the MIR behavior in more
detail, the optical/NIR region is not shown in the plots for
652–1393 d (Fig. 19).
In spite of the line-profile constraints on and , for epochs 500 d, 652 d, and 859 d we were nevertheless able to
obtain fair matches to the observed continuum (Figs. 18,
19). It was found that the matches required the dust to be
optically thick () in the optical/NIR region, but optically
thin in the MIR region. A blackbody spectrum matched to the shorter
MIR wavelengths overproduced the flux at longer wavelengths. This is
illustrated in Fig. 18 (500 d) and Fig. 19 as dotted
cyan lines. This restriction, together with the fixed values for
and allowed us to obtain specific values,
not limits, for , and . At 500 d the ejecta
dust mass was M⊙, with
K. The optical depths through the disk were
10 in the band and at 10 m. By 859 d the
dust mass had increased to M⊙,
while fell to K. A particular value of this
500–859 d study is that it demonstrates that the same dust-disk
parameters can account for the line profiles and the MIR
continuum. This adds considerable weight to our contention that the
two disks are one and the same. Moreover specific values, not limits,
for the dust masses and temperatures were determined for the
500–859 d period.
As the SN aged between 500 d and 996 d it was found that the IDDM
steadily approached the blackbody case. Moreover, there were no line
profiles available after 925 d. Linear extrapolation to 996 d of the
line-profile-derived values for gave cm. The model match yielded dust with
a high optical depth in the optical/NIR but with in the
MIR. The dust mass was M⊙ and
K.
By epochs 1207 d and 1393 d we found that the MIR continuum was best
reproduced by allowing a continuing increase in the IDDM optical depth
such that the disk was optically thick at all observed wavelengths
(see Table 8). Indeed, given the uncertainties in the
observed fluxes, we cannot rule out a totally opaque disk at all
wavelengths covered. Consequently, the IDDM could provide only dust
mass lower limits of M⊙ at 1207 d and
M⊙ at 1393 d. The 1207 d and 1393 d plots
shown in Fig. 19 are with and set at the
limiting values (Table 8).
In Table 9 we show the luminosities of the IDDM () components compared with the radioactive deposition power of 0.0095 M⊙ of 56Ni, including 56Ni decay. The IS IR echo component is excluded since it is powered primarily by the SN peak luminosity. The luminosity of the thin disk, , is approximated by:
| (6) |
As already indicated by the BLC analysis (§3.2) the post-30 d
evolution of SN 2004dj falls into three phases. At 89 d, (about
half-way down the plateau-edge) the luminosity is still dominated by
the shock-ionized ejecta, with radioactive decay contributing a small
proportion of the total. There is then a short period just after the
end of the plateau when radioactive decay deposition dominated the
luminosity. This is supported by the fact that at 129 d, the
radioactive luminosity, , is highly similar to the total
continuum model luminosity, . At the nebular phases of
251 d and 281 d, the small excess in , relative to
, presumably went into powering the line emission which is
not included in the model. By 500 d, in spite of the exclusion of
much of the line luminosity from the model, is , rising to by 1393 d. As argued above,
the most plausible additional power source available at this stage is
a reverse shock.
Model matches were also carried out with in the IDDM
component. Similar dust parameters were found to those obtained for
. The only significant difference was that the dust masses
were larger, assuming a uniform density distribution within
the inner (cf. §3.4.4.1). These larger values are
due to the growing proportion of dust mass concentrated in the
optically-thick region of the disk.
We also considered a dusty disk of warm silicate grains, with the
radii and thickness determined by the line-profile analysis as before.
The demand that the disk should be of optical depth in the optical/NIR
up to its edge meant that the replacement of amorphous carbon dust
with silicate dust had no effect on these dimensions. The problem
with silicate dust continuum matching is the absence of the
m silicate feature in the observed continua during the
period when the dust was optically thin in the MIR, up to 996 d.
Attempts to suppress the feature in the IDDM by increasing the dust
mass and hence the optical depth yielded a continuum that was too
bright. Only for 1207 d and 1393 d was silicate dust able to reproduce
the observed continuum. This is not surprising since, by these two
epochs, the warm ejecta dust was close to being opaque over the MIR
range observed. Between 500 d and 996 d the proportion of silicate
grains by mass could have been no more than 20%, and was usually
significantly less than this. Indeed, the data were always consistent
with there being no silicate grains at all. We also note the absence
of the SiO feature at m. SiO formation is a necessary
step on the way to silicate grains (Todini & Ferrara, 2001; Nozawa et al., 2003).
The points made in the previous paragraph argue against a substantial
amount of silicate dust in the ejecta of SN 2004dj. The absence of
silicate grains is consistent with the presence of strong CO
fundamental and first overtone emission in the period 100 d to
d. A high C/O ratio in the ejecta could result in most of
the oxygen being absorbed as CO leaving behind an excess of carbon to
provide carbon grains, but little oxygen to provide silicate
grains. However, in the SN environment, the net grain population can
be affected by factors in addition to the C/O ratio. These include
molecule destruction by high-energy electrons, charge transfer
reactions and ejecta density (Liu & Dalgarno, 1996; Nozawa et al., 2003; Deneault et al., 2006). Nevertheless,
we conclude that the dust grains in SN 2004dj were predominantly
composed of non-silicate material.
The success in reproducing the MIR continua using the same dust disk
as was invoked to explain contemporary line profiles tends to support
the curious result from §3.4.4.1 that, rather than expanding, the
radius of the dust disk actually shrunk by a small amount. Indeed, if
we include the disk radii for 1207 d and 1393 d derived from the IDDM
matches (Table 8, col. 7) we find a shrinkage of 27% since
500 d. In SN 2004et (Kotak et al., 2009) it was found that the dust radius
remained roughly constant. The explanation offered was that the dust
was contained within an optically-thin cloud of optically-thick,
pressure-confined clumps. But the availability of late-time
optical/NIR spectra for SN 2004dj and the profile modelling presented
here shows that a clumping explanation for the non-expanding dust-disk
radius would not work. We note that, during the 500–859 d period in
SN 2004dj, the product of the blue-wing, half-maximum (BHM) velocities
and epoch for the line profiles, , yields a roughly constant
value of cm (see Table 6) - similar to
that obtained for the dust-disk radius. This coincidence may imply
that the extent of both the dust and the bulk of the ejecta gas
emission was physically constrained within a radius of cm.
We suggest that the apparent shrinkage of the dust-disk radius may
have been due to the presence and inward motion of the reverse shock
such that the shock position defined the disk radius. Dust formation
could have continued within the disk with the dust taking part in the
overall ejecta outflow, but as the ejecta passed through the reverse
shock it would have been destroyed. There would have been a net
increase in dust mass with time, as observed, if the dust growth rate
within the disk exceeded the destruction rate. A possible difficulty
with this scenario is that the dust mass appeared to continue to grow
right up to the final epoch at 1393 d. This is rather later than dust
formation studies suggest. Todini & Ferrara (2001) find that all grain
condensation would be complete by 800 days. Moreover, both
Todini & Ferrara (2001) and Nozawa et al. (2003) find carbon dust condensation is
complete in not much more than one year. An alternative explanation,
therefore, might be that the dust mass in SN 2004dj did not increase
after 400 d, but rather that the density gradient of the outer
region of the disk was actually steeper than . Thus, as the
ejecta expanded, the dust density at a fixed location in the outer
region would have grown, yielding an apparently higher total dust mass
— i.e., more dust emerged from the optically-thick inner regions.
Radiation from the reverse shock could have been primarily responsible
for heating the dust. As more and more ejecta passed through, the
shock and its radiation would have weakened causing the dust to cool,
as observed. The reverse shock may also have been responsible for the
approximate constancy of the radius of the line emitting gas sphere.
Further examination of the reverse-shocked dust-disk hypothesis is
beyond the scope of this paper. We note that in a recent
observational study of Cassiopeia A Delaney et al. (2010) deduce a flattened
ejecta distribution or “thick disk” containing all the ejecta
structures. They also deduce the occurrence of a roughly spherical
reverse shock.
Intrinsic axial asymmetry in the form of a bipolar jet biased towards
the observer has been invoked by Chugai et al. (2005) to account for the
H profile in SN 2004dj up to about 1 year. We note that the
jet makes an angle of only to the normal to the dust
disk plane derived from our line-profile analysis, perhaps indicating
a physical connection. However, line-profile asymmetry in the earlier
(pre-1 year) nebular spectra of other CCSNe also tend to be
blue-biased. This implies that, in general, an intrinsic bias towards
the observer cannot be the explanation for such line blueshifts
(cf. Milisavljevic et al., 2010). At later (post-1 year) nebular epochs,
line blueshifts are also often seen
(Lucy et al., 1989; Spyromilio et al., 1990; Turatto et al., 1993; Fesen et al., 1999; Gerardy et al., 2000; Leonard et al., 2000; Fassia et al., 2002; Elmhamdi et al., 2003; Pozzo et al., 2004)
and these are usually attributed to attenuation by newly-formed dust
in the ejecta or CDS. Our dust-disk model invokes this scenario.
This has the advantage of explaining the red-wing suppression without
invoking an intrinsic observer-biased axial asymmetry in the SN.
Moreover, our model uses the same dust disk to simultaneously account
for the line-profile attenuation and the MIR emission. We
consider it unlikely that the Chugai et al. model can provide a
superior alternative explanation for the line profiles presented and
analysed in §3.4.4.1. Further examination of the relationship between
our model and that of Chugai et al. is beyond the scope of this
paper.
We conclude that dust formation in the ejecta of SN 2004dj had
commenced, and may even have been completed, by 500 d with a
near-face-on, disk-like distribution. This dust was responsible
both for the late-time line-profile red-wing suppression and the bulk
of the MIR luminosity up to m. The main source of dust
heating was probably reverse-shock radiation. Assuming ,
the dust mass was at least M⊙. For ,
the lower limit rises to about M⊙. The
value of is poorly constrained. We reject silicates as the
grain material.
4. Conclusions
We have presented optical, NIR, and MIR observations of the Type IIP
SN 2004dj. The combination of wavelength and temporal coverage
achieved makes this SN one of the most closely studied of such
events. In the present work we have analyzed the SN continuum over a
period spanning 89–1393 d, augmented by a line-profile analysis over
461–925 d. Our conclusions are as follows.
(1) A mass of M⊙ of 56Ni was ejected
from SN 2004dj, which is less than that reported by other authors. The
period during which the radioactive tail dominated the bolometric
light curve lasted for an unusually short period of only
35 d. Subsequently, a different energy source dominated;
we suggest reverse-shock heating.
(2) At early times the optical/NIR (“hot”) part of the continuum
provided most of the SN luminosity. This emission is attributed to hot,
optically-thick ejecta gas. At later epochs the optical/NIR luminosity
was increasingly due to nebular emission, and formed only a minor,
ultimately negligible, proportion of the BLC.
(3) At both early and late times, the long-wave portion of the MIR
continuum (the “cold” component) was primarily due to an IS IR echo.
Free-free radiation made only a minor contribution. As originally
suggested by Bode & Evans (1980), the analysis of SN IR echoes may provide a
useful way of studying IS dust in nearby galaxies.
Subsequent to the submission of this paper, Szalai et al. (2011) reported
their findings on SN 2004dj, making use of some of the data presented
in this work. They dismiss the IS IR echo, and argue against
pre-existing dust since the estimated extinction of SN 2004dj was
lower than that of other SNe. We do not concur. We have shown that an
extinction of only Av=0.02 is all that is required to account for an
adequate IR echo. Szalai et al. (2011) also argue that the early UV/X-ray
flash would create a dust-free cavity of up to cm and that
OB-stars would have expelled the ISM/dust from the cluster. In fact
most of the IS IR echo longward of m comes from dust lying
at considerably more than 1 parsec. We therefore strongly favour a
scenario whereby the long-wave component was primarily due to an IS IR
echo.
(4) The early-time NIR/MIR (“warm”) component was probably due to
thermal emission from non-silicate dust formed in the CDS. The CDS
dust growth began at about 50 d, reached 90% of maximum by 165 d, and
approached a maximum of M⊙; the dust mass
produced in this way was small. Heating of the dust by the
contemporary optical-NIR BLC completely accounts for the strength and
evolution of the early-time warm component. Szalai et al. (2011) did not
present contemporary optical or NIR data and consequently did not
identify the early warm component.
(5) The late-time warm component was dominated by the luminosity of
newly-formed, non-silicate dust in the ejecta. The dust growth
commenced at some time between 281 d and 461 d. The same dust was
responsible for the late-time red-wing attenuation of optical and NIR
spectral line profiles. The dust was distributed as a nearly face-on
disk, within a spherical cloud of emitting gas. During 500–996 d the
disk was effectively opaque in the optical/NIR region, but was
optically thin at longer wavelengths. The dust mass appeared to grow
during this period, attaining M⊙
by 996 d for a uniform density disk, or a few times more than this for
an gradient outside and uniform within.
However, it may be that the dust mass “growth” was really due to the
emergence of previously formed (i.e., pre-500 d) dust from
optically-thick regions of a disk with an even steeper density
gradient. For the latest two epochs (1207 d and 1393 d) the dust was
optically thick at all wavelengths and only lower limits could be
obtained for a given gradient — for example, M⊙
for a flat gradient and a factor of 3 higher limit for an
gradient outside and uniform within. This is
broadly in agreement with Szalai et al. (2011). For a smooth distribution,
they found a dust mass of M⊙ though,
with clumping, up to M⊙ would also be
possible.
(6) Rather than expanding, the dust-disk radius appeared to
slowly shrink. This may have been due to the dust extent being
confined by the reverse shock, which also heated the grains
radiatively.
(7) While the latest epochs provide only lower limits to the mass of dust produced by SN 2004dj, these limits are at least a factor of 100 below the 0.1 M⊙ of grains per SN required to account for the dust observed at high redshifts. Moreover, measurements as late as 996 d yield actual dust masses of only M⊙. While not completely ruling out the possibility that typical CCSN ejecta are major contributors to cosmic dust production, this study does suggest that, at least for SN 2004dj, the dust-mass production was small.
References
- Allen (1973) Allen, C. W. 1973, “Astrophysical Quantities”, (Athlone Press) 265
- Andrews et al. (2010) Andrews, J. E., et al. 2010, ApJ, 715, 541
- Arnett et al. (1989) Arnett, W. D., Bahcall, J. N., Kirshner, R. P., & Woosley, S. E. 1989, ARAA, 27, 629
- Bendo et al. (2010) Bendo, G. J., et al. 2010, MNRAS, 402, 1409
- Bertoldi et al. (2003) Bertoldi, F., Carilli, C. L., Cox, P., Fan, X., Strauss, M. A., Beelen, A., Omont, A., & Zylka, R. 2003, A&A, 406, L55
- Beswick et al. (2005) Beswick, R. J., Muxlow, T. W. B., Argo, M. K., Pedlar, A., Marcaide, J. M., & Wills, K. A. 2005, ApJ, 623, 21
- Bode & Evans (1980) Bode, M. F., & Evans, A. 1980, MNRAS, 193, 21p
- Bond et al. (2004) Bond, H. E, et al. 2004, IAU Circ. 8385
- Botticella et al. (2009) Botticella, M. T., et al. 2009, MNRAS, 398, 1041
- Burrows et al. (1995) Burrows, A., Hayes, J. & Fryxell, B. A. 1995, ApJ, 450, 830
- Cardelli et al. (1989) Cardelli, J. A., Clayton, G. C., & Mathis, J. S. 1989, ApJ, 345, 245
- Chandra & Ray (2004) Chandra, P., & Ray, A. 2004, IAU Circ. 8397
- Cherchneff & Dwek (2010) Cherchneff, I., & Dwek, E. 2010, ApJ, 713, 1
- Chevalier & Fransson (1992) Chevalier, R. A., & Fransson, C. 1992, ApJ, 395, 540
- Chugai (2001) Chugai, N. N. 2001, MNRAS, 326, 1448
- Chugai et al. (2005) Chugai, N. N., Fabrika, S. N., Sholukhova, O. N., Goranskij, V. P., Abolmasov, P. K., & Vlasyuk, V. V. 2005, Astrophys. Lett., 31, 792
- Chugai (2006) Chugai, N. N. 2006, Ast. Lett., 32, 739
- Chugai et al. (2007) Chugai, N. N., Chevalier, R. A., & Utrobin, V. P. 2007, ApJ, 662, 1136
- Clayton et al. (1992) Clayton, D. D., Leising, M. D., The, L.-S., Johnson, W. N., & Kurfess, J. D. 1992, ApJ, 399, L141
- Delaney et al. (2010) Delaney, T., et al. 2010, ApJ, 725, 2038
- Deneault et al. (2006) Deneault, E. A.-N., Clayton, D. D., & Meyer, B. S. 2006, ApJ, 638, 234
- Di Carlo et al. (2008) Di Carlo, E., et al. 2008, ApJ, 684, 471
- Draine (2003) Draine, B. T. 2003, ARA&A, 41, 241
- Draper et al. (2002) Draper, P. W., Gray, N., & Berry, D. S. 2002, Starlink User Note 214.10
- Dwek (1983) Dwek, E. 1983, ApJ, 274, 175
- Dwek et al. (2007) Dwek, E., Galliano, F., & Jones, A. P. 2007, ApJ, 662, 927
- Dwek & Arendt (2008) Dwek, E., & Arendt, R. G. 2008, ApJ, 685, 976
- Dwek & Cherchneff (2011) Dwek, E., & Cherchneff, I. 2011, ApJ, 727, 63
- Elmhamdi et al. (2003) Elmhamdi, A., et al. 2003, MNRAS, 338, 939
- Ensman & Burrows (1992) Ensman, L., & Burrows, A. 1992, ApJ393, 742
- Ercolano & Storey (2006) Ercolano, B., & Storey, P. J. 2006, MNRAS, 372, 1875
- Faber et al. (2003) Faber, S. M., et al. 2003, Proc. SPIE, 4841, 1657
- Fassia et al. (2000) Fassia, A., et al. 2000, MNRAS, 318, 1093
- Fassia et al. (2002) Fassia, A., Meikle, W. P. S., & Spyromilio, J. 2002, MNRAS, 332, 296
- Fazio et al. (2004) Fazio, G. G., et al. 2004, ApJS, 154, 10
- Fesen et al. (1999) Fesen, R. A., et al. 1999, AJ, 117, 725
- Filippenko et al. (2004) Filippenko, A. V., Li, W., Challis, P., & Van Dyk, S. D. 2004, IAU Circ. 8391
- Fischera et al. (2002) Fischera, Jg., Tuffs, R. J., & Völk, H. J. 2002, A&A, 395, 189
- Fransson & Kozma (1993) Fransson, C., & Kozma, C. 1993, ApJ, 408, 25
- Fransson et al. (2005) Fransson, C., et al. 2005, ApJ, 622, 991
- Fraternali et al. (2001) Fraternali, F., Oosterloo, T., Sancisi, R., & van Moorsel, G. 2001, ApJ, 562, L47
- Freedman et al. (2001) Freedman, W. L., et al. 2001, ApJ, 553, 47
- Gerardy et al. (2000) Gerardy, C. L., Fesen, R. A., Höflich, P., & Wheeler, J. C. 2000, AJ, 119, 2968
- Guenther & Klose (2004) Guenther, E. W., & Klose, S. 2004, IAU Circ. 8384
- Hamuy (2003) Hamuy, M. 2003, ApJ, 582, 905
- Houck et al. (2004) Houck, J. R., et al. 2004, ApJS, 154, 211
- Hummer (1988) Hummer, D. G. 1988, ApJ, 327, 477
- Kim et al. (2008) Kim, Y., Rieke, G. H., Krause, O., Misselt, K., Indebetouw, R., & Johnson, K. E. 2008, ApJ, 678, 287
- Klein & Chevalier (1978) Klein, R. I., & Chevalier, R. A. 1978, ApJ, 223, L109
- Korcáková et al. (2005) Korcáková, D., et al. 2005, IBVS, 5605, 1
- Kotak et al. (2005) Kotak, R., Meikle, P., Van Dyk, S. D., Höflich, P. A., & Mattila, S. 2005, ApJ, 628, 123
- Kotak et al. (2009) Kotak, R., et al. 2009, ApJ, 704, 306
- Kozma & Fransson (1998) Kozma, C., & Fransson, C. 1998, ApJ, 496, 946
- Krause et al. (2005) Krause, O., et al. 2005, Science, 308, 1604
- Leonard et al. (2000) Leonard, D. C., Filippenko, A. V., Barth, A. J., & Matheson, T. 2000, ApJ, 536, 239
- Leonard et al. (2006) Leonard, D. C., et al. 2006, Nature 440, 505
- Li et al. (1993) Li, H., McCray, R., & Sunyaev, R. A. 1993, ApJ, 419, 824
- Liu & Dalgarno (1996) Liu, W., & Dalgarno, A. 1996, ApJ, 471, 480
- Lucy et al. (1989) Lucy, L. B., Danziger, I. J., Gouiffes, C., & Bouchet, P. 1989, in Structure and Dynamics of the Interstellar Medium, ed. G. Tenorio-Tagle, et al. (Berlin: Springer-Verlag), 164
- Maiolino et al. (2004) Maiolino, R., Schneider, R., Oliva, E., Bianchi, S., Ferrara, A., Mannucci, F., Pedani, M., & Roca Sogorb, M. 2004, Nature, 431, 533
- Maíz-Apellániz et al. (2004) Maíz-Apellániz, J., Bond, H. E., Siegel, M. H., Lipkin, Y., Maoz, D., Ofek, E. O., & Poznanski, D. 2004, ApJ, 615, L113
- Mathis et al. (1977) Mathis, J. S., Rumpl, W., & Nordsieck, K. H. 1977, ApJ, 217, 425
- Mattila et al. (2008) Mattila, S., et al. 2008, MNRAS, 389, 141
- Meikle et al. (2006) Meikle, W. P. S., et al. 2006, ApJ, 649, 332
- Meikle et al. (2007) Meikle, W. P. S., et al. 2007, ApJ, 665, 608
- Milisavljevic et al. (2010) Milisavljevic, D., Fesen, R. A., Gerardy, C. L., Kirshner, R. P. & Challis, P. 2010, ApJ, 709, 1343
- Misra et al. (2007) Misra, K., Pooley, D., Chandra, P., Bhattacharya, D., Ray, A. K., Sagar, R., & Lewin, W. H. G. 2007, MNRAS, 381, 280
- Nakano et al. (2004) Nakano, S., Itagaki, K., Bouma, R. J., Lehky, M., & Hornoch, K. 2004, IAU Circ. 8377
- Nozawa et al. (2003) Nozawa, T., Kozasa, T., Umeda, H., Maeda, K., & Nomoto, K. 2003, ApJ, 598, 78
- Osterbrock (1989) Osterbrock, D. E. 1989, “Astrophysics of Gaseous Nebulae and Active Galactic Nuclei” (Mill Valley, CA: University Science Books)
- Patat et al. (2004) Patat, F., Benetti, S., Pastorello, A., Filippenko, A. V., & Aceituno, J. 2004, IAU Circ. 8378
- Pei et al. (1991) Pei, Y. C., Fall, S. M., & Bechtold, J. 1991, ApJ, 378, 6
- Pettini et al. (1997) Pettini, M., King, D. L., Smith, L. J., & Hunstead, R. W. 1997, ApJ, 478, 536
- Pooley & Lewin (2004) Pooley, D., & Lewin, W. H. G. 2004, IAU Circ. 8390
- Pozzo et al. (2004) Pozzo, M., Meikle, W. P. S., Fassia, A., Geballe, T., Lundqvist, P., Chugai, N. N., & Sollerman, J. 2004, MNRAS, 352, 457
- Pun et al. (1995) Pun, C. S. J., et al. 1995, ApJS, 99, 223
- Rieke et al. (2004) Rieke, G., et al. 2004, ApJS, 154, 25
- Rouleau & Martin (1991) Rouleau, R., & Martin, P. G. 1991, ApJ, 377, 526
- Sandage (1984) Sandage, A. 1984, AJ, 89, 630
- Schlegel et al. (1998) Schlegel, D. J., Finkbeiner, D. P., & Davis, M. 1998, ApJ, 500, 525
- Shortridge (2002) Shortridge, K. 2002, Starlink User Note 86
- Skrutskie et al. (1997) Skrutskie, M. F., et al. 1997, ASSL, 210, 25
- Smith et al. (2008) Smith, N., Foley, R. J., & Filippenko, A. V. 2008, ApJ, 680, 568
- Smith et al. (2010) Smith, N., Chornock, R., Silverman, J. M., Filippenko, A. V., & Foley, R. J. 2010, ApJ, 709, 856
- Spyromilio et al. (1990) Spyromilio, J., Meikle, W. P. S., & Allen, D. A. 1990, MNRAS, 242, 669
- Stockdale et al. (2004) Stockdale, C. J., Sramek, R. A., Weiler, K. W., van Dyk, S. D., Panagia, N., Pooley, D., Lewin, W., & Marcaide, J. M. 2004, IAU Circ. 8379
- Szalai et al. (2011) Szalai, T., Vinkó, J, Balog, Z, Gáspár, A, Block, M., & Kiss, L.L. 2011, A&A, 527, 61.
- Timmes et al. (1996) Timmes, F. X., Woosley, S. E., Hartmann, D. H., & Hoffman, R. D. 1996, ApJ, 464, 332
- Todini & Ferrara (2001) Todini, P., & Ferrara, A. 2001, MNRAS, 325, 726
- Tominaga et al. (2009) Tominaga, N., Blinnikov, S., Baklanov, P., Morokuma, T., Nomoto, K., & Suzuki, T. 2009, ApJ, 705, L10
- Turatto et al. (1993) Turatto, M., Cappellaro, E., Benetti, S., & Danziger, I. J. 1993, MNRAS, 265, 471
- Udalski et al. (1999) Udalski, A., Szymanski, M., Kubiak, M., Pietrzynski, G., Soszynski, I., Wozniak, P., & Zebrun, K. 1999, Acta Astronomica, 49, 201
- Valiante et al. (2009) Valiante, R., Schneider, R., Bianchi, S., & Andersen, A. 2009, MNRAS, 397, 1661
- van den Bergh (1965) van den Bergh, S. 1965, PASP, 77, 269
- Vinkó et al. (2006) Vinkó, J., et al. 2006, MNRAS, 369, 1780
- Vinkó et al. (2009) Vinkó, J., et al. 2009, ApJ, 695, 619
- Wang et al. (2005) Wang, X., Yang, Y., Zhang, T., Ma, J., Zhou, X., Li, W., Lou, Y.-Q., & Li, Z. 2005, ApJ, 626, 89
- Weiler et al. (2002) Weiler, K. W., Panagia, N., Montes, M. J., & Sramek, R. A. 2002, ARA&A, 40, 387
- Werner et al. (2004) Werner, M. W., et al. 2004, ApJS, 154, 1
- Wooden et al. (1993) Wooden, D. H., Rank, D. M., Bregman, J. D., Witteborn, F. C., Tielens, A. G. G. M., Cohen, M., Pinto, P. A., & Axelrod, T. S. 1993, ApJS, 88, 477
- Wooden (1997) Wooden, D. H. 1997, in AIP Conf. Proc. 402, Astrophysical Implications of the Laboratory Study of Presolar Materials, eds. T. Bernatowicz & E. Zinner, (Melville, NY: AIP) 317
- Woosley et al. (1989) Woosley, S. E., Pinto, P. A., & Hartmann, D. 1989, ApJ, 346, 395
- Wright (1980) Wright, E. L. 1980, ApJ, 242, L23
- Zhang et al. (2006) Zhang, T., Wang, X., Li, W., Zhou, X., Ma, J., Jiang, Z., & Chen, J. 2006, AJ, 131, 2245
- Zwitter et al. (2004) Zwitter, T., Munari, U., & Moretti, S. 2004, IAU Circ. 8413
| Flux (mJy)∗∗ | ||||||||||
| Epoch∗ | texp | IRAC | PUI | MIPS | ||||||
| Date | MJD | (d) | (s) | 3.6 m | 4.5 m | 5.8 m | 8.0 m | 16 m | 22 m | 24 m |
| 2004 Oct 07a | 53285.1 | 89.1 | 134 | 11.25(2) | 10.00(2) | 6.85(3) | 4.32(4) | – | – | – |
| 2004 Oct 08b | 53286.4 | 90.4 | 107 | 10.94(2) | 10.01(2) | 6.74(3) | 4.09(5) | – | – | – |
| 2004 Oct 12b | 53290.1 | 94.1 | 107 | 8.30(2) | 9.71(2) | 6.02(3) | 3.45(4) | – | – | – |
| 2004 Oct 14a | 53292.5 | 96.5 | 160 | – | – | – | – | – | – | 0.74(16) |
| 2004 Nov 01a | 53310.1 | 114.1 | 134 | 4.37(2) | 7.70(2) | 4.78(3) | 2.49(3) | – | – | – |
| 2004 Nov 06a | 53315.7 | 119.7 | 160 | – | – | – | – | – | – | 0.70(9) |
| 2005 Mar 03a | 53432.3 | 236.3 | 160 | – | – | – | – | – | – | 0.89(9) |
| 2005 Mar 24a | 53453.9 | 257.9 | 134 | 1.25(2) | 3.50(1) | 1.57(3) | 1.27(4) | – | – | – |
| 2005 Apr 02a | 53462.0 | 266.0 | 160 | – | – | – | – | – | – | 0.75(17) |
| 2005 Oct 20c | 53663.7 | 467.7 | 536 | 1.86(2) | 2.36(1) | 2.42(2) | 2.36(4) | – | – | – |
| 2005 Nov 22c | 53693.9 | 497.9 | 630 | – | – | – | – | 1.23(4) | – | – |
| 2006 Mar 23c | 53817.9 | 621.9 | 536 | 1.34(2) | 1.74(1) | 2.38(2) | 2.58(4) | – | – | – |
| 2006 Apr 02d | 53827.6 | 631.6 | 10 | – | – | – | – | – | – | 1.0(2)† |
| 2006 Apr 23c | 53848.4 | 652.4 | 630 | – | – | – | – | 1.43(7) | – | – |
| 2006 Oct 28e | 54036.2 | 840.2 | 536 | 0.85(2) | 1.14(1) | 1.81(2) | 2.09(4) | – | – | – |
| 2006 Oct 31f | 54039.1 | 843.1 | 14 | 0.83(2) | 1.13(2) | 1.50(7) | 2.07(4) | – | – | – |
| 2006 Nov 16f | 54054.8 | 859.0 | 57 | – | – | – | – | 1.38(7) | – | – |
| 2006 Nov 16e | 54055.0 | 859.0 | 315 | – | – | – | – | 1.47(4) | 1.15(3) | – |
| 2006 Dec 01f | 54070.3 | 874.3 | 160 | – | – | – | – | – | – | 1.15(15) |
| 2007 Mar 24e | 54183.0 | 987.0 | 1258 | – | – | – | – | 1.28(9)†† | 0.96(8)†† | – |
| 2007 Mar 24f | 54183.0 | 987.0 | 132 | – | – | – | – | 1.37(10)†† | – | – |
| 2007 Apr 02e | 54192.8 | 996.8 | 536 | 0.50(2) | 0.67(1) | 1.15(2) | 1.37(4) | – | – | – |
| 2007 Apr 02f | 54192.8 | 996.8 | 125 | 0.49(2) | 0.67(1) | 1.13(3) | 1.38(4) | – | – | – |
| 2007 Apr 13f | 54203.1 | 1007.1 | 160 | – | – | – | – | – | – | 0.90(10) |
| 2007 Oct 24g | 54397.3 | 1201.3 | 494 | – | – | – | – | – | – | 1.09(13) |
| 2007 Oct 24h | 54397.3 | 1201.3 | 1360 | – | – | – | – | – | – | 1.07(13) |
| 2007 Nov 04g | 54408.3 | 1212.3 | 283 | – | – | – | – | 1.18(4) | – | – |
| 2007 Nov 19f | 54423.3 | 1227.3 | 322 | 0.36(2) | 0.45(1) | 0.76(2) | 1.01(4) | – | – | – |
| 2007 Nov 23g | 54427.1 | 1231.1 | 322 | 0.36(2) | 0.44(1) | 0.76(2) | 1.03(3) | – | – | – |
| 2007 Nov 24h | 54428.0 | 1232.0 | 3485 | 0.36(1) | 0.45(1) | 0.80(2) | 1.02(3) | – | – | – |
| 2007 Nov 29f | 54433.4 | 1237.4 | 494 | – | – | – | – | – | – | 1.20(6) |
| 2007 Dec 06f | 54440.0 | 1244.0 | 283 | – | – | – | – | 1.80(35)†† | – | – |
| 2007 Dec 15h | 54450.0 | 1254.0 | 1260 | – | – | – | – | 1.12(3) | – | – |
| 2008 Mar 25h | 54551.0 | 1355.0 | 1260 | – | – | – | – | 1.03(6) | – | – |
| 2008 Apr 07h | 54563.8 | 1367.8 | 3485 | 0.33(2) | 0.38(1) | 0.67(3) | 0.90(4) | – | – | – |
| 2008 Apr 12g | 54568.2 | 1372.2 | 322 | 0.33(2) | 0.38(1) | 0.63(2) | 0.95(4) | – | – | – |
| 2008 Apr 14g | 54570.4 | 1374.4 | 494 | – | – | – | – | – | – | 1.24(9) |
| 2008 Apr 15h | 54571.0 | 1375.0 | 1360 | – | – | – | – | – | – | 1.11(14) |
| 2008 May 03g | 54589.3 | 1393.3 | 283 | – | – | – | – | 1.07(6) | – | – |
| 2009 Nov 14i | 55149.9 | 1953.9 | 3276 | 0.31(1) | – | – | – | – | – | – |
| 2009 Dec 03i | 55168.7 | 1972.7 | 3276 | 0.30(1) | – | – | – | – | – | – |
| 2010 Apr 16i | 55302.7 | 2106.7 | 3276 | 0.35(1) | – | – | – | – | – | – |
| 2010 May 23i | 55339.5 | 2143.5 | 3276 | 0.31(1) | – | – | – | – | – | – |
| Sandage 96 | 0.28(5) | 0.21(4) | 0.14(3) | 0.08(2) | 0.024(7) | 0.013(4) | 0.011(3) | |||
| Date | MJD | Epoch∗ | texp | Magnitudes∗∗ | |||
|---|---|---|---|---|---|---|---|
| (UT) | (d) | (s) | |||||
| 2004 Nov 25 | 53334.0 | 138.0 | J(70) H(135) | – | 13.56(4) | 13.24(4) | – |
| 2005 Mar 17 | 53446.0 | 250.0 | Z(60) J(60) H(60) K(50) | 15.4(1)1 | 14.35(4) | 14.15(6) | 14.13(5) |
| 2005 May 11 | 53501.2 | 305.2 | J(300) H(225) Ks(180) | – | 14.88(1) | 14.54(2) | 14.42(4) |
| 2005 May 12 | 53502.1 | 306.1 | J(300) H(225) | – | 14.88(1) | 14.52(2) | – |
| 2006 Jan 14 | 53749.9 | 553.9 | J(675) H(1025) Ks(1215) | – | 15.87(5) | 15.19(5) | 14.75(5) |
| Sandage 96 | – | 15.93(11) | 15.70(12) | 15.15(14) | |||
| Date | MJD | Epoch∗ | texp | Program |
|---|---|---|---|---|
| (UT) | (d) | (s) | ||
| 2004 Oct 24 | 53302.32 | 106.3 | 610 | PID. 00226 Van Dyk (MISC) |
| 2004 Nov 16 | 53325.77 | 129.8 | 610 | PID. 00226 Van Dyk (MISC) |
| 2005 Mar 18 | 53447.65 | 251.6 | 610 | PID. 00226 Van Dyk (MISC) |
| 2005 Apr 17 | 53477.92 | 281.9 | 610 | PID. 00226 Van Dyk (MISC) |
| 2005 Nov 22 | 53696.83 | 500.8 | 1828 | PID. 20256 Meikle et al.(MISC) |
| 2006 Apr 23 | 53848.47 | 652.5 | 1828 | PID. 20256 Meikle et al.(MISC) |
| 2006 Nov 16 | 54055.08 | 859.1 | 3657 | PID. 30292 Meikle et al.(MISC) |
| 2007 Oct 30 | 54403.45 | 1207.4 | 117 | PID. 30494 Sugerman et al.(SEEDS) |
| 2008 May 03 | 54589.35 | 1393.3 | 3657 | PID. 40619 Kotak et al.(MISC) |
| Date | MJD | Epoch∗ | Spectral range | Telescope |
| (UT) | (d) | (m) | ||
| 2004 Oct 05 | 53284.9 | 88.4 | 0.420–0.766 | DDO 1.88m |
| 2004 Oct 13 | 53291 | 95 | 0.480–0.910 | Lick 3m |
| 2004 Oct 18 | 53296 | 100 | 0.370–0.750 | LAT Scorpio |
| 2004 Nov 15 | 53324.21 | 128.2 | 0.402–0.839 | DDO 1.88m |
| 2004 Nov 25 | 53334.06 | 138.1 | 0.884–2.406 | WHT 4.2m |
| 2005 Apr 19 | 53479.86 | 283.9 | 0.477–0.944 | WHT 4.2m |
| 2005 May 12 | 53502.15 | 306.1 | 0.827–2.400 | Hiltner 2.4m |
| 2005 Oct 14 | 53657.08 | 461.1 | 0.889–2.453 | WHT 4.2m |
| 2005 Oct 20 | 53663.21 | 467.2 | 0.417–0.928 | WHT 4.2m |
| 2006 Jan 15 | 53750.03 | 554.0 | 0.890–2.343 | WHT 4.2m |
| 2006 Dec 22 | 54091.5 | 895.5 | 0.458–0.723 | Keck 10m |
| 2006 Jan 21 | 54121.5 | 925.5 | 0.444–0.890 | Keck 10m |
| H | Pa | [O I] 6300 Å | [Fe II] 7155 Å | [Fe II] 12570 Å | |||||||
|---|---|---|---|---|---|---|---|---|---|---|---|
| Epoch (d) | |||||||||||
| 89 | (260) | 63(3) | – | – | – | – | – | – | – | – | 586.9 |
| 128 | (100) | 25(1) | – | – | – | – | – | – | – | – | 417.2 |
| 138 | – | – | 380(20) | 4.5(2) | – | – | – | – | – | – | 381.4 |
| 283 | 1535(80) | 18.1(9) | – | – | 250(10) | 3.0(2) | 82(14) | 1.0(2) | – | – | 101.7 |
| 306 | – | – | 137(7) | 1.62(8) | – | – | – | – | 35(10) | 0.4(1) | 81.5 |
| 461 | – | 39(4) | 0.46(5) | – | – | – | – | 20(2) | 0.24(2) | 16.4 | |
| 467 | 230(10) | 2.75(15) | – | – | 134(7) | 1.58(8) | 41(7) | 0.49(8) | – | – | 15.35 |
| 554 | – | – | 9.7(8) | 0.11(1) | – | – | – | – | 12(3) | 0.14(3) | 6.0 |
| 895 | 10.7(7) | 0.13(1) | – | – | 7.6(9) | 0.09(1) | 3.0(2) | 0.035(3) | – | – | 0.18 |
| 925 | 9.5(7) | 0.12(1) | – | – | 6.9(3) | 0.082(4) | 2.52(8) | 0.031(1) | – | – | 0.14 |
| Epoch | Velocity () | Model | ||||
| (d) | cm) | () | ||||
| H and Pa | ||||||
| 89∗ | -2010 | -450 | 1630 | 1820 | 1.5 | – |
| 95† | -2120 | -270 | 2210 | 2160 | 1.7 | – |
| 100∗∗ | -2550 | -1620 | 2000 | 2270 | 2.2 | – |
| 128∗ | -2670 | -1770 | -700 | 980 | 2.9 | – |
| 138 | -2190 | -1780 | -310 | 940 | 2.6 | – |
| 283 | -1710 | -730 | 990 | 1350 | 4.2 | – |
| 306 | -1840 | -350 | 910 | 1370 | 4.9 | – |
| 461 | -1170 | -180 | 300 | 730 | 4.7 | -2400 |
| 467 | -1240 | -160 | 550 | 890 | 5.0 | -2400 |
| 554 | -800 | 15 | 500 | 650 | 3.8 | -2400 |
| 895 | -310 | -140, 160 | -10a | 150a | 2.4 | -2400 |
| 925 | -430 | - 80, 210 | –b | – | 3.4 | -2400 |
| [O I] 6300 Å | ||||||
| 283 | -1760 | -140 | – | – | 4.3 | – |
| 467 | -1040 | -300 | 400 | 720 | 4.5 | -2250 |
| 895 | -440 | -210, 170 | -90a | 170a | 3.4 | -990 |
| 925 | -440 | -170, 210 | 20a | 230a | 3.5 | -990 |
| [Fe II] 7155 Å & 12570 Å | ||||||
| 283 | -1600 | -830 | 370 | 980 | 3.9 | – |
| 306 | -1670 | -510 | 400 | 1030 | 4.4 | – |
| 461 | -1610 | -600 | 160 | 880 | 6.4 | -3000 |
| 467 | -1130 | -330 | 510 | 820 | 4.6 | -2250 |
| 554 | -940 | -230 | 260 | 600 | 4.5 | -2250 |
| 895 | -400 | -210, 490 | -120a | 140a | 3.1 | -780 |
| 925 | -410 | -170, 480 | -30a | 190a | 3.3 | -900 |
| Epoch | ||||||||||||
|---|---|---|---|---|---|---|---|---|---|---|---|---|
| (d) | () | (K) | () | ( cm) | (K) | () | (K) | ( | ( | ( | ( | () |
| ) | ) | ) | ) | |||||||||
| 89 | 450 | 7000 | 1750 | 1.3 | 1800 | 7000 | 200 | 2141 | 135 | 0.33 | 2276 | 592 |
| 106 | 220 | 7000 | 1300 | 1.2 | 1800 | 8500 | 200 | 695 | 106 | 0.69 | 801 | 507 |
| 129 | 180 | 6000 | 1250 | 1.4 | 1300 | 7500 | 200 | 372 | 39.5 | 0.80 | 412 | 411 |
| 251 | 50 | 6000 | 580 | 1.3 | 1000 | 5000 | 200 | 109 | 11.3 | 1.3 | 120 | 137 |
| 281 | 50 | 5300 | 470 | 1.1 | 900 | 4500 | 200 | 82.9 | 6.1 | 1.4 | 89 | 103 |
| 500 | 3.8 | 10000 | 570 | 2.5 | 840 | 1800 | 200 | 19.2 | 21.5 | 0.69 | 41 | 10.7 |
| 652 | (1.0) | 10000∗∗ | 550 | 3.1 | 700 | 1400 | 200 | 2.3 | 16.4 | 0.71 | 19 | 2.1 |
| 859 | (0.16) | 10000∗∗ | 450 | 3.3 | 620 | 1250 | 200 | 0.10 | 11.7 | 0.98 | 12 | 0.26 |
| 996 | (0.05) | 10000∗∗ | 440 | 3.8 | 530 | 800 | 200 | 0.013 | 8.1 | 0.5 | 8.1 | 0.077 |
| 1207 | (0.01) | 10000∗∗ | 330 | 3.4 | 480 | 1050 | 200 | 4.5 | 1.4 | 4.5 | 0.019 | |
| 1393 | (0.0025) | 10000∗∗ | 320 | 3.8 | 440 | 900 | 200 | 4.0 | 1.3 | 4.0 | 0.009 |
| Epoch | |||||||||||
|---|---|---|---|---|---|---|---|---|---|---|---|
| (d) | () | (K) | () | (K) | ( cm-3) | ( cm) | (K) | () | |||
| 89 | 450 | 7000 | 3420 | (6000) | 100 | – | – | – | – | – | – |
| 106 | 275 | 6000 | 3420 | (6000) | 86 | – | – | – | – | – | – |
| 129 | 180 | 6000 | 3420 | (6000) | 56 | – | – | – | – | – | – |
| 251 | 50 | 6000 | 3080 | 5000 | 36 | – | – | – | – | – | – |
| 281 | 50 | 5300 | 2980 | 5000 | 24 | – | – | – | – | – | – |
| 500 | 9.0 | 6000 | 2470 | 5000 | 1.8 | 5.2(5) | 650(15) | 9.6 | 0.45(5) | 0.16 | 0.22(2) |
| 652 | (1.0) | (10000) | 2090 | 5000 | 0.6 | 4.9(5) | 610(15) | 15.3 | 0.73(10) | 0.26 | 0.32(5) |
| 859 | (0.16) | (10000) | 1590 | 5000 | 0.25 | 4.6(5) | 570(15) | 17.4 | 0.82(10) | 0.29 | 0.33(5) |
| 996 | (0.05) | (10000) | 1400 | 2500 | 0.14 | 4(1) | 520(30) | 36.7 | 1.7(5) | 0.62 | 0.5(1) |
| 1207 | (0.01) | (10000) | 1400 | 2500 | 0.05 | 3.8(6) | 460(30) | 80 | 4 | 1.5 | 1.0 |
| 1393 | (0.0025) | (10000) | 1400 | 2000 | 0.024 | 3.8(6) | 430(20) | 120 | 6 | 2 | 1.5 |
Fixed disk radius
| Epoch | ||||||
|---|---|---|---|---|---|---|
| (d) | ( | ( | ( | ( | ( | () |
| ) | ) | ) | ) | ) | ||
| 89 | 2050 | 128 | 8.0 | – | 2186 | 592 |
| 106 | 586 | 55.7 | 10.0 | – | 652 | 507 |
| 129 | 372 | 26.8 | 7.7 | – | 407 | 411 |
| 251 | 109 | 6.6 | 3.3 | – | 119 | 137 |
| 281 | 82.9 | 4.8 | 4.2 | – | 91.9 | 103 |
| 500 | 14.0 | 0.6 | 0.20 | 12.4 | 27.2 | 10.7 |
| 652 | (2.3) | – | 0.03 | 9.9 | 12.2 | 2.1 |
| 859 | (0.10) | – | 0.005 | 6.9 | 7.0 | 0.26 |
| 996 | (0.032) | – | 0.0025 | 3.9 | 3.9 | 0.077 |
| 1207 | () | – | 0.0006 | 2.3 | 2.3 | 0.019 |
| 1393 | () | – | 0.0002 | 1.8 | 1.8 | 0.009 |
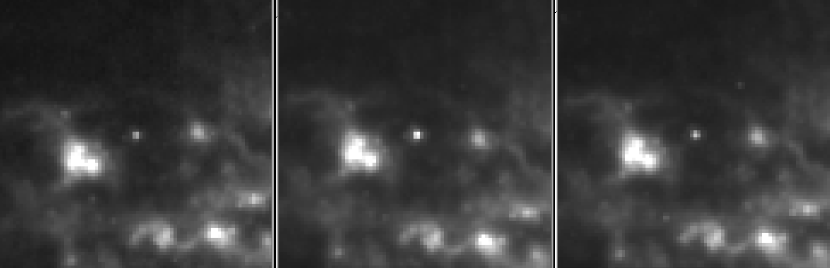

5.


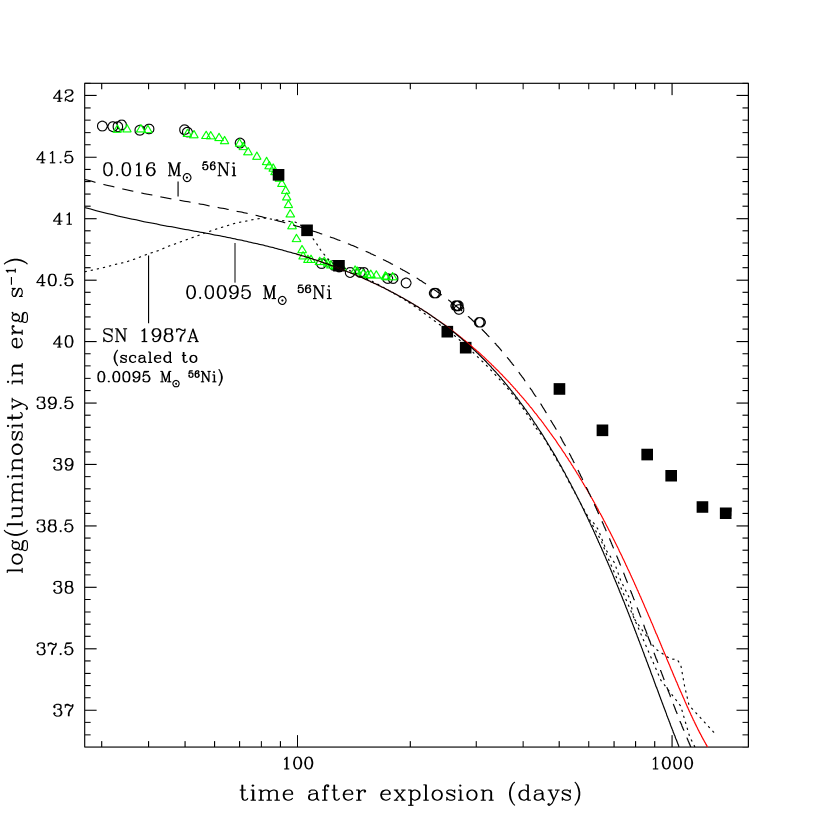
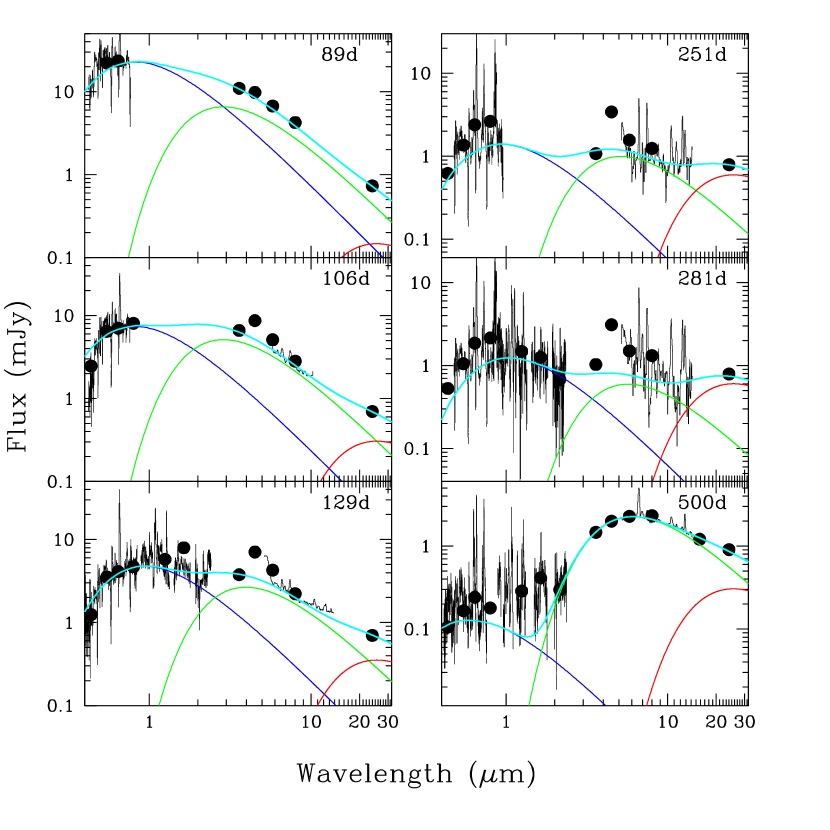
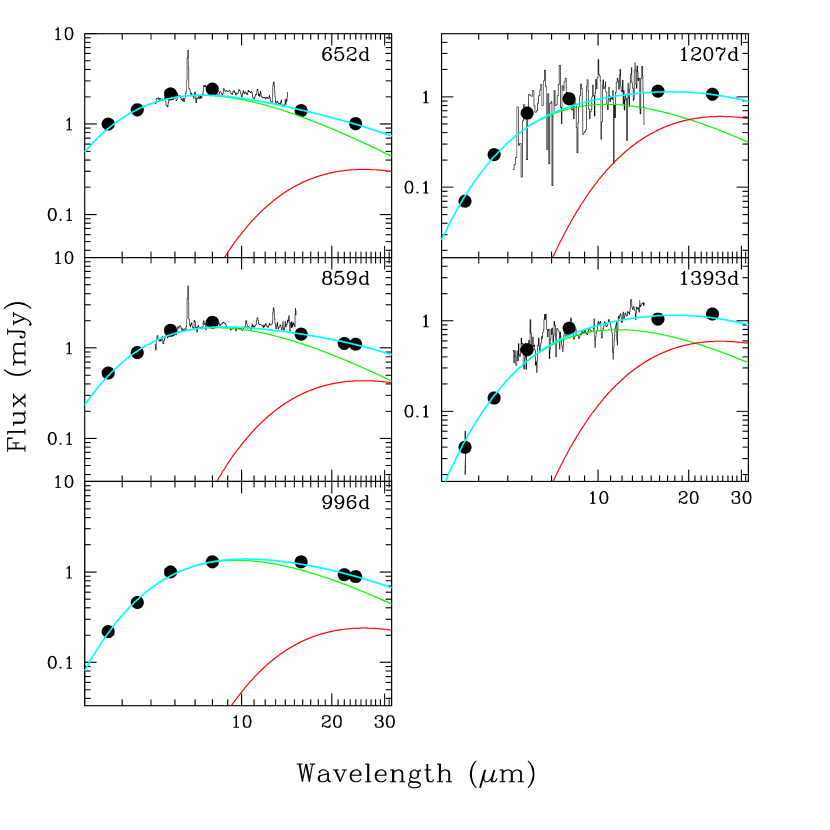

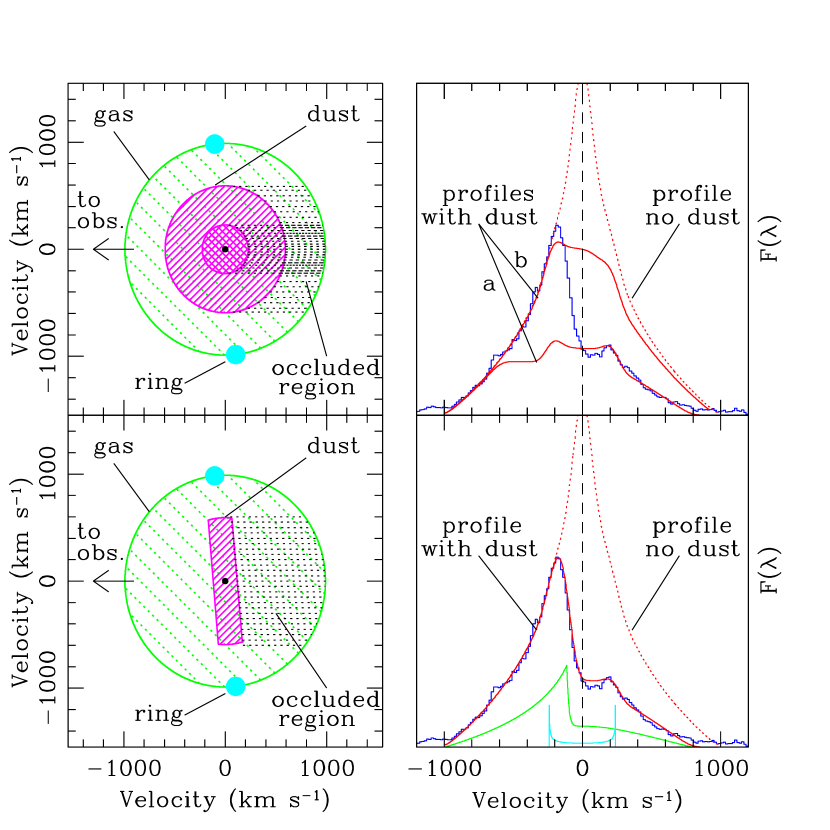
The upper panels illustrate the case where the dust is distributed as an opaque, concentric sphere. Two sizes of sphere are considered. Profiles and (upper RH panel) correspond, respectively, to the large and small dust spheres (upper LH panel). It can be seen that neither reproduce the observed line profile. The lower panels illustrate the case where the dust is composed of amorphous carbon and is distributed as a uniform density, nearly face-on concentric disk with perpendicularly through the disk plane. This optical depth is the value required for the model to simultaneously match the line profile and the contemporaneous MIR continuum (see Fig. 19). While the disk is shown as being coplanar with the ring, for ease of computation the disk is taken to be exactly face-on. Shifting the disk tilt to match that of the ring would have had only a small effect on the model profile. No correction is made for minor edge effects at the disk’s outer limit (radius). Also shown (lower RH panel) are the intrinsic line profiles from the attenuated gas sphere (green solid line) and the thin ring (cyan solid line). The thin ring emission is not affected by the dust. For clarity, both of these intrinsic profile plots have been scaled downward in flux by the same amount relative to the total profile. It can be seen that the final dust-disk model profile provides an excellent match to the data.
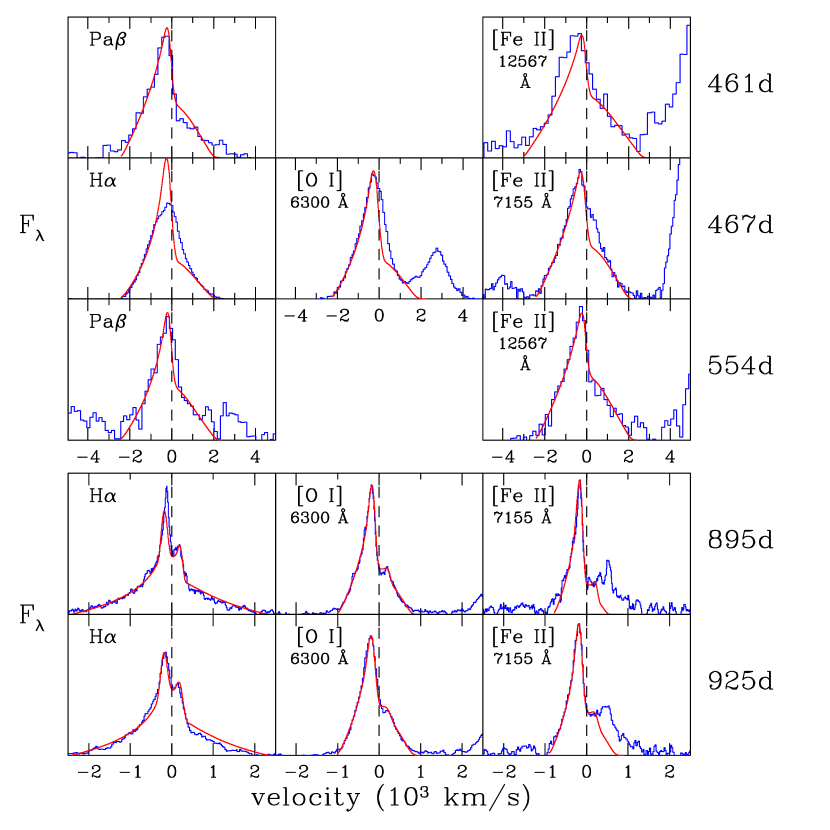
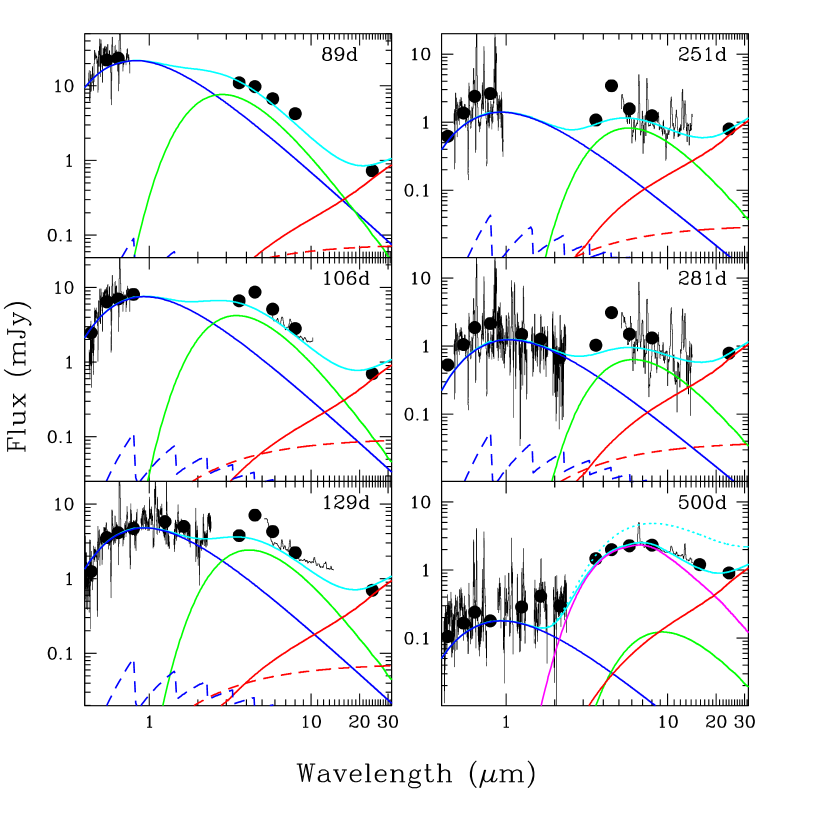
500 d: As for earlier epochs but with the addition of IR emission from a warm disk of dust (magenta). The dotted cyan line represents the model continuum when the IDDM is replaced with a blackbody adjusted to match the shortwave region of the MIR continuum. At this epoch the ff and fb fluxes are too weak to appear on the plot.