A first search of excited states double beta and double electron capture decays of 110Pd and 102Pd
Abstract
A search for double beta decays of the palladium isotopes 110Pd and 102Pd into excited states of their daughters was performed and first half-life limits for the and decays into first excited 0+ and states of yr and yr (95 % CL) for the 110Pd decay were obtained. The half-life limits for the corresponding double electron capture transition of 102Pd are yr and yr (95 % CL) respectively. These are the first measurements for 102Pd.
keywords:
neutrino rare search1 Introduction
During the past 20 years vast progress has been made in unveiling the properties of neutrinos. For decades neutrinos were thought to be massless, which no longer holds true: flavour oscillations found in the leptonic sector, studying neutrinos coming from the sun [1, 2], the atmosphere [3], high energy accelerators beams [4, 5] and nuclear power plants [6], are explained by neutrino oscillations requiring a non zero neutrino mass. However, no absolute mass scale can be fixed with experiments studying the oscillatory behaviour. To achieve this, one has to investigate weak decays, such as beta decays or neutrinoless double beta decays
| (1) |
The latter violates total lepton number by two units and thus is not allowed in the Standard Model. The 0-decay is the gold plated process to distinguish whether neutrinos are Majorana or Dirac particles. Furthermore, a match of helicities of the intermediate neutrino states is necessary which is done in the easiest way by introducing a neutrino mass. This mass is linked with the experimentally observable half-life via
| (2) |
where is the effective Majorana neutrino mass, given by and is the corresponding element in the leptonic PMNS mixing matrix, is a phase space factor and describes the nuclear transition matrix element. The experimental signature is the emission of two electrons with a sum energy corresponding to the Q-value of the nuclear transition. A potential evidence has been claimed in the 0-decay of 76Ge with at 90 % CL [7]. In addition, the SM process of neutrino accompanied double beta decay,
| (3) |
can be investigated, which is expected with half-lives arround yr. For recent reviews see [8].
Additional information is provided by the alternative process of positron decay in combination with electron capture (EC). Three different decay modes can be considered:
| ( ) | (4) | ||||
| () | (5) | ||||
| ( ) | (6) |
Decay modes containing a positron have a reduced Q-value as each generated positron accounts for a reduction of 2 . Thus, the full energy is only available in the mode and makes it the most probable one. However, it is also the most difficult to detect, only producing X-rays instead of 511 keV gammas. Furthermore, it has been shown that transitions have an enhanced sensitivity to right-handed weak currents (V+A interactions) [9] and thus would help to disentangle the physics mechanism of 0-decay. In the last years, also neutrinoless modes have been discussed with renewed interest, because of a potential resonance enhancement up to a factor of in the decay if the initial and final excited state are degenerate [10]. Recently, a series of isotopes with extreme low Q-value was explored for enhancement in the ECEC mode and with 152Gd a very promising candidate was found [11].
Another branch of search is linked to excited state transitions. The signal in this case is extended by looking at the corresponding de-excitation gammas. However, in the approach of a passive sample on a Ge-detector it will not allow to distinguish between the 2-decay and 0-decay mode. Thus, the deduced half-live limits are valid for both. The investigation of 2-decay modes into excited states will add information on nuclear structure, valuable for matrix element calculations. Furthermore, a potential observation of 0-decay into an excited -state would likely point to other contributions besides neutrino masses. The searches described in this paper are based on the search for excited state transitions.
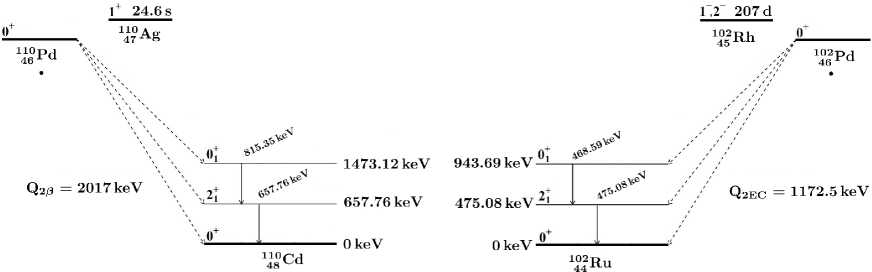
An element getting little attention in the past is palladium with the isotopes of interest 110Pd and 102Pd. Among the eleven 0-decay candidates with a Q-value larger than 2 MeV, 110Pd has several advantages: it has the second-highest natural abundance (11.72 %) and, in addition, it is an excellent candidate to probe the single-state dominance hypothesis for 2-decay, i.e. that only the lowest lying intermediate 1+-state will contribute to the nuclear transition matrix element describing its 2-decay. Only one rather weak experimental limit in the order of yr exists for 0-decay ground state transitions in 110Pd [12]. Theoretical predictions for the 2-decay ground state mode are in the range of 0.12 - 29.96 1020 yr [13, 14, 15, 16, 17, 18, 19, 21]. Theoretical predictions for the excited state transitions are 4.4 1025 yr [19], 8.37 1025 yr [16], 1.5 1025 yr [20] and 0.62 - 1.3 1025 yr [21] for the state and 2.4 1026 yr [19] and 4.2 - 9.1 1023 yr [21] for the state.
The second isotope 102Pd has a Q-value of 1172 keV, a natural abundance of 1.02 % and is able to decay via and . These decay modes have never been studied for 102Pd experimentally and no theoretical predictions exist. The level schemes of both isotopes are shown in Fig. 1.
2 Experimental Setup
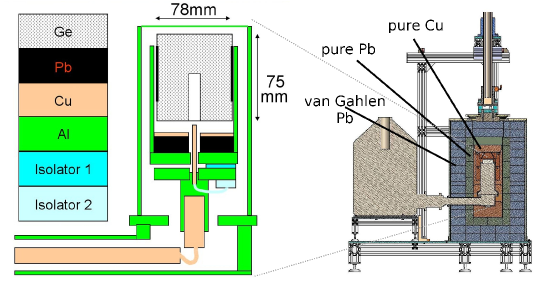
The measurement was performed in the Felsenkeller Underground Laboratory in Dresden with a shielding depth of 120 mwe. A sample of 802.35 g of Pd was used, which was purified before by C. HAFNER GmbH + Co. KG. It was placed in a standard Marinelli baker (D6) of 70 cm diameter and 21 cm height. The sample was positioned on a HPGe detector with an efficiency of 90 % routinely used for -spectroscopic measurements. The detector has an 1 mm thick Al-window towards the sample. It is surrounded by a 5 cm copper shielding embedded in another shielding of 15 cm of clean lead. The inner 5 cm of the lead shielding have a low contamination of 210Pb of only Bq/kg while the outer 10 cm have an activity of Bq/kg.
The detector is placed inside a special building which acts as a Faraday cage and a Rn shield; additionally, the setup is flushed with nitrogen in order to reduce Rn contamination. More details can be found in [22, 23] and a schematic drawing is shown in Fig. 2. The Pd was stored underground for more than one year prior to the measurement except for 18 d of purification. The data were collected with a 8192 channel MCA from Ortec and were converted into the ROOT format for analysis.
An extensive calibration was performed using 17 -lines from 8 different nuclides resulting in a linear energy calibration curve of
| (7) |
The measurement range of the spectrum goes up to 2.8 MeV. The resolution was calibrated using the calibration lines and fitted with a second order polynomial. The actual values at the energies of the lines of interest will be discussed in the corresponding analysis section.
Despite purification, the measured spectrum is dominated by intrinsic contaminations of the Pd. Clear -lines from the 238U and 232Th decay chains as well as 40K are visible. However, former Americium contributions have been removed completely by the purification. The actual background spectrum of the detector system itself without any sample is at least an order of magnitude smaller in the regions of interest and can be neglected, hence the spectrum is completely dominated by the Pd sample contaminations.
3 Analysis and Results
A total of 16.2 d of data were accumulated resulting in 13.00 of exposure. In the following the two isotopes of interest are discussed separately. For the analysis, the natural abundances of the latest IUPAC evaluation have been used which are 11.27 % (110Pd ) and 1.02 % (102Pd) respectively [24]. As the searches are purely based on gamma detection, the obtained results apply for both, 0-decay and 2-decay modes. The decays into the first excited -state de-excite via an intermediate - state. Thus, there will be an angular correlation among the gammas, with an observational probability W() that the second gamma is emitted with an angle with respect to the first one given by
| (8) |
It can be seen that the probability of both gammas beeing emitted in the same direction is larger than an uncorrelated emission. However, the detection efficiency for a single gamma is small which results in a low probability to observe a summation peak and thus the searches are based on the individual gamma energies only.
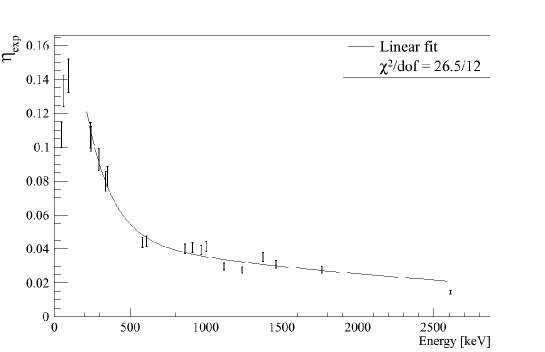
The efficiency for full energy detection was determined and cross checked in several ways. The most important one was replacing the actual used volume by a SiO2 sample of exactly the same geometry. The intrinsic contaminations of the natural decay chains of 238U and 232Th as well as 40K produced various -lines and acted as an extended calibration source. The 17 -lines used for the energy calibration were also used for the efficiency determination in the region from 238.6 keV (from 212Pb decay) up to 2614.3 keV (from 208Tl decay). The efficiency in the region above 200 keV can be well fitted by two exponential functions. It varies between 5.77 % at 468 keV and 3.89 % at 815 keV, being the lowest and highest energy lines of interest for the search described in this paper. To account for the difference in self-absorption of Pd and SiO2, extensive Monte Carlo simulations were performed using the AMOS code [25]. The amount of Monte Carlo was chosen in a way that the statistical error for the full energy peak for both, Pd and SiO2, was less than 0.1 %. The simulations agree within an error of less than 15 % with the measurements and tend to be slightly higher. This can easily be explained by small geometric differences in the simulation and the experiment. However, independent from that is the ratio of both self-absorption simulations for Pd and SiO2. Hence, the ratio was used to scale the experimentally well determined efficiency curve of SiO2 to the one of Pd (Fig. 3). A validation of the procedure was performed within the vicinity of the lines of interest by using prominent background lines apparent in the spectrum, namely 295.21 keV and 351.92 keV (from 214Pb), 233.63 keV (from 212Pb), 583.19 keV (from 208Tl) and 609.32 keV (from 214Bi), which results in good agreement.
The analysis is based on the extraction of upper count limits with the Feldman Cousins method described in [26]. A simple constant was chosen as a background model after concluding that the area around the ROI is sufficiently flat. The background was determined with a likelihood fit in a selected region around the peak position taken to be keV excluding the peak range which is considered to be keV.
Likelihood fits with the Gaussian peak shapes and the background constants resulted in statistical downward fluctuations for all four peaks. This is a clear sign that no significant signal is observed (see Fig. 4 and 5). In this case, an upper limit for the count rate can be calculated using the background only hypothesis and the maximal statistical fluctuation of a Gaussian distributed background for a certain confidence level. This is commonly referred to as sensitivity. However, the Feldman Cousins approach also considers the observed downward fluctuations and results in more appropriate results for low count rates.
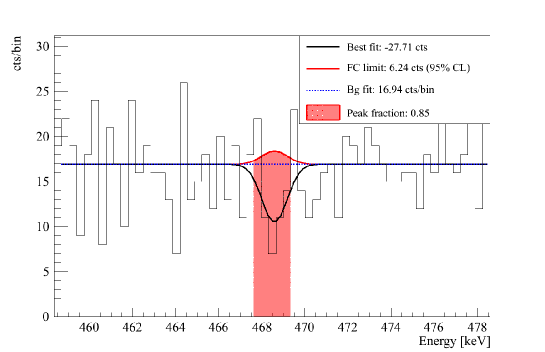
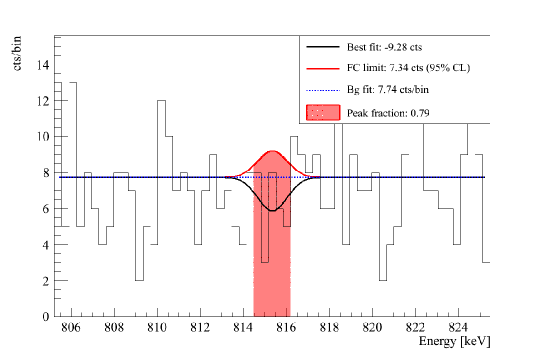
In order to obtain a numerical value for the upper limit, all bins within the FWHM of an expected peak are combined into a single analysis bin. The resulting fraction of the peak that is covered by the analysis bin is dependent on the binning of the data but always larger than 76 %. The background expectation and the measured count rate are used to evaluate an upper count limit for this bin with the ROOT implementation of the Feldman and Cousins method. The result is then scaled to the full peak area.
From the background point of view, exactly the same -lines in the performed search could be produced from the beta decays of the intermediate nuclide of the investigated double beta system, which will be discussed in more detail in the next section. However, their contribution can be rejected by the non-observation of other, more prominent -lines at different locations in the spectrum. The only prominent background line to be expected within keV of any of the four lines under investigation is from 137Cs at 661.66 keV potentially influencing the -limit in the 110Pd system. However, no indication of this line is observed.
3.1 The 110Pd system
Two lines were investigated for 110Pd at energies 657.76 keV (corresponding to the 2 transition) and 815.35 keV (additionally emitted in the decay) respectively. The corresponding energy resolutions at these energies are 1.51 and 1.61 keV (FWHM). Potential -lines mimicking the signal would come from 110Ag and 110mAg decays. 110Ag has a half-life of 24.6 s only and thus has to be produced in-situ. With the given shielding this can be excluded. Potentially more dangerous is the long-living 110mAg (half-live of 249.79 d). This isotope has two prominent lines at 1384.3 keV and 1505.04 keV. They are not visible in the spectrum and thus this contribution can be excluded for this search. No lines were visible at both peak positions of interest and thus an upper limit (95 % CL) of signal events of 10.53 and 7.34 could be extracted for 657.76 keV and 815.35 keV respectively.
Using the known Pd mass and efficiencies, this can be converted into lower half-live limits of
| (9) | ||||
| (10) |
These are the first experimental limits for excited state transitions in the 110Pd system.
3.2 The 102Pd system
Two lines were investigated for 102Pd at energies 468.59 keV (only emitted in the decay) and 475.05 keV (corresponding to the 2 transition) respectively. The energy resolution at these energies is 1.39 keV (FWHM) for both lines. Potential -lines mimicking the signal would come from 102Rh and 102mRh decays. 102Rh with a half-life of 207 d has no reasonable line to check. The strongest one is the 475.05 keV line. As there is no signal in this region it can be concluded that it does not contribute to the 468.59 keV region. On the other hand 102mRh (half-live of 2.9 yr) has multiple lines to explore, the most restricting ones are a line at 631.28 keV with 56 % emission probability and at 697.49 keV with 44 %. Both of them are not observed in the spectrum and thus can exclude such a contribution. No lines were visible at both peak positions of interest and thus an upper limit (95 % CL) of signal events of 17.64 and 6.24 could be extracted for 475.05 keV and 468.59 keV respectively. The obtained half-live limits are
| (11) | ||||
| (12) |
These are the first experimental limits on 102Pd double beta decays.
4 Summary
Double beta decay transitions into excited states for the two Pd-isotopes 102Pd and 110Pd have been investigated for the first time. These transitions contain valuable informations about the physics mechanism of double beta decay and the involved nuclear physics. However, no signal into the first excited 0+ and 2+ states have been observed.
Acknowledgement
The authors would like to thank D. Degering (VKTA Dresden) for his help with the underground measurements and D. Sommer for her help with the Monte Carlo simulations for efficiency determinations.
References
- [1] B. Aharmim et al. SNO Collaboration, Phys. Rev. Lett. 101, 111301 (2008)
- [2] J. P. Cravens et al. Super-Kamiokande Collaboration, Phys. Rev. D 78, 032002 (2008)
- [3] R. Wendell et al. Super-Kamiokande Collaboration, Phys. Rev. D 81, 092004 (2010)
- [4] A. Habig, Mod. Phys. Lett. A 25, 1219 (2010)
- [5] N. Agafonova et al. OPERA Collaboration, Phys. Lett. B 691, 138 (2010)
- [6] K. Eguchi et al. KamLAND Collaboration, Phys. Rev. Lett. 90, 021802 (2003)
- [7] H.V. Klapdor-Kleingrothaus et al., Phys. Lett. B 586, 198 (2004), Mod. Phys. Lett. A 21, 1547 (2006)
- [8] F. T. Avignone III et al., Rev. Mod. Phys. 80, 481 (2008)
- [9] M. Hirsch et al., Z. Phys. A 347, 151 (1994)
- [10] Z. Sujkowski, S. Wycech, Phys. Rev. C 70, 052501 (2004)
- [11] S. Eliseev et al., Phys. Rev. Lett. 106, 052504 (2011)
- [12] R. G. Winter, Phys. Rev. 85, 687 (1952)
- [13] R. Chandra et al., Eur. Phys. J. A 23, 223 (2005)
- [14] S. V. Semenov et al., Phys. Atom. Nucl. 63, 1196 (2000)
- [15] O. Civitarese, J. Suhonen, Phys. Rev. C 58, 1535 (1998)
- [16] S. Stoica, Phys. Rev. C 49, 2240 (1994)
- [17] M. Hirsch et al., Phys. Rep. 242, 403 (1994)
- [18] A. Staudt et al., Europhys. Lett. 13, 31 (1990)
- [19] P. Domin et al., Nucl. Phys. A 753, 337 (2005)
- [20] A. A. Raduta and C. M. Raduta, Phys. Lett. B 647, 265 (2007)
- [21] J. Suhonen, Nucl. Phys. A (2011), doi:10.1016/j.nuclphysa.2011.06021
- [22] M. Köhler et al, Appl. Rad. and Isotopes 67, 736 (2009)
- [23] D. Degering, M. Köhler, IEEE Nucl. Sci. Sym. Dresden 2008
- [24] P. De Bievre, P.D.P. Taylor, Int. J. Mass Spectrom. Ion. Phys. 123, 149 (1993)
- [25] U. Reichelt, J. Henniger, Radiat. Protect. Dosim. 119, 479 (2006)
- [26] G. J. Feldman, R. D. Cousins, Phys. Rev. D 57, 3873 (1998)