The structure and dynamics of molecular gas in planet-forming zones: A CRIRES spectro-astrometric survey
Abstract
We present a spectro-astrometric survey of molecular gas in the inner regions of 16 protoplanetary disks using CRIRES, the high resolution infrared imaging spectrometer on the Very Large Telescope. Spectro-astrometry with CRIRES measures the spatial extent of line emission to sub-milliarcsecond precision, or AU at the distance of the observed targets. The sample consists of gas-rich disks surrounding stars with spectral types ranging from K to A. The properties of the spectro-astrometric signals divide the sources into two distinct phenomenological classes: one that shows clear Keplerian astrometric spectra, and one in which the astrometric signatures are dominated by gas with strong non-Keplerian (radial) motions. Similarly to the near-infrared continuum emission, as determined by interferometry, we find that the size of the CO line emitting region in the Keplerian sources obeys a size-luminosity relation as . The non-Keplerian spectro-astrometric signatures are likely indicative of the presence of wide-angle disk winds. The central feature of the winds is a strong sub-Keplerian velocity field due to conservation of angular momentum as the wind pressure drives the gas outwards. We construct a parametrized 2-dimensional disk+wind model that reproduces the observed characteristics the observed CO spectra and astrometry. The modeled winds indicate mass-loss rates of . We suggest a unifying model in which all disks have slow molecular winds, but where the magnitude of the mass-loss rate determines the degree to which the mid-infrared molecular lines are dominated by the wind relative to the Keplerian disk surface.
Subject headings:
techniques: image spectroscopy — protoplanetary disks — line: profiles — ISM: molecules1. Introduction
Planets are believed to predominantly form in the inner regions of circumstellar disks surrounding young stars, the so-called planet-forming zone (PFZ). Consequently, searches for embryonic planetary systems are expected to be most fruitful if they are focused on the inner regions of planet-forming disks, whether using direct detection methods or indirect approaches such as imaging signatures of planet-disk interactions. While typical gas-rich disks around young stars may extend to 100 AU, or more in a few extreme cases, the outer reaches are too tenuous to form planetary cores within the lifetime of the disk, unless the disk is massive enough to become gravitationally unstable (Boss, 1997; Marois et al., 2008). A few mature planets or substellar objects have been imaged at large radii around A stars, but the majority of the known planetary systems are believed to have formed within 20 AU (Pollack et al., 1996), followed by radial migration inwards due to planet-disk interactions during the gas-rich phase of the disk (Alibert et al., 2004), consistent with the currently known distribution of exo-planets detected with the radial velocity and transit methods.
1.1. An observational challenge
A primary difficulty in studying planet formation in progress is the small angular sizes of the PFZs. The nearest protoplanetary disks are located, with a few notable exceptions such as the TW Hya association and a few Herbig Ae stars, at distances in excess of 100 pc. Resolved images of typical PFZs must be obtained at a spatial resolution better than 01. Further compounding the problem is that many of the main tracers of PFZs are found in the infrared wavelength range (2-200 m) because the relevant gas temperatures are in excess of K – making ground-based observations challenging. Generally, specialized instrumentation is needed to obtain the requisite spatial resolution. In recent years, ground-breaking progress has been made in infrared interferometry of the innermost regions of protoplanetary disks from 1-2 m (e.g., Millan-Gabet et al., 1999; Eisner et al., 2005) and near 10 m (van Boekel et al., 2005). However, interferometric observations of gas have thus far been limited to single band or relatively low spectral resolving power and to young A and B stars. This has, for the most part, limited interferometry to dust, gas continuum and hydrogen recombination lines (Tatulli et al., 2007, 2008; Isella et al., 2008; Eisner et al., 2009).
Our understanding of the structure and dynamics of inner protoplanetary disks and PFZs remains limited. While there appears to be a common end result of disk evolution – the formation of a planetary system, complete with gas giants and perhaps smaller rocky planets, as well as, presumably, planetesimals, comets and zodiacal dust – the pathway is unclear. It is known that disks exist and that they carry most of the angular momentum of a young stellar system, as evidenced by resolved sub-millimeter imaging of their outer regions (Koerner et al., 1993; Mannings & Sargent, 1997; Qi et al., 2008), and matching the momentum distribution of the solar system and other planetary systems. Their spectral energy distributions show us that the disks are gas-rich throughout; if they were not, the disks would be flat, not flared with essentially pressure-supported scale heights (Kenyon & Hartmann, 1987).
The presence of accretion shocks and jets tell us that the disks are actively accreting requiring the gas to be sufficiently viscious to allow angular momentum transport (Koenigl, 1991). Limited disk lifetimes of about 6 Myr have been inferred, albeit with significant variation, demonstrating the need for efficient dispersal mechanisms (Haisch et al., 2001). Disks do not extend all the way inward to the stellar surface, but exhibit a complex structure due to the sublimation of dust at high temperatures leading to rapid opacity gradients (Natta et al., 2001), and a coupling of the disk to the stellar magnetic field facilitates both accretion and mass loss (Koenigl, 1991; Shu et al., 1994).
Some disks appear to have large excavated inner regions of low dust opacity (Strom et al., 1989), compared to the outer disk, but it appears that not all disks go through such a stage (Muzerolle et al., 2010), and it is still an open question whether this is directly related to the formation of planetesimals or even giant planets, or whether another dispersal mechanism is at play (Alexander & Armitage, 2009). Clearly, observing what the gas actually does in the inner disk impacts our understanding of all these disk properties and enables us to estimate their relative importance for the evolution of the disk. Ultimately, the motion of the inner disk gas may reveal the presence of accreting protoplanets (Regály et al., 2010).
1.2. This paper
We present a spectro-astrometric imaging survey of molecular gas in the PFZs of disks around a sample of solar type stars using CRIRES on the European Very Large Telescope (Käufl et al., 2004). The primary goal is to directly determine the basic distribution and kinematics of the gas and to relate this to the process of planet formation and inner disk evolution. For instance, in a purely passive, non-accreting, disk it may be expected that the gas orbits at essentially Keplerian speeds, dictated only by the mass of the central star, neglecting minor corrections for the mass of the disk itself () and for the radial pressure gradient in the disk ( Cuzzi et al., 1993). The presence of double-peaked emission line profiles from protoplanetary disks can indeed be explained by gas in Keplerian orbits (Carr et al., 1993; Blake & Boogert, 2004; Pontoppidan et al., 2008). However, disks are in general not passive as they accrete and eventually dissipate, so departures from pure Keplerian motion are expected at some level, and is indicated in FU Ori stars for the CO bandhead at 2.3 m (Calvet et al., 1991; Martin, 1997; Hartmann et al., 2004). Do mid-infrared molecular lines – in fact – trace material strictly in Keplerian motion, or are there significant non-Keplerian components present, and, if so, are they dominated by infall or outflow motions? What disk radii are traced by rovibrational CO lines; the inner edge of the disk at 0.01-0.1 AU, the terrestrial planet region at 0.1-1.0 AU or the giant planet region at 1.0-10 AU? What is the origin of the absorption components seen in CO rovibrational spectra – absorption from edge-on disks, foreground clouds, remnant envelopes or disk winds?
Our spectro-astrometric survey was primarily focused on what is probably the best tracer of molecular gas in the inner disk, or at least the most easily observable – the fundamental rovibrational band of CO centered at 4.67 m. These CO lines are traditionally thought to trace warm gas in disks at AU, based on typical line widths and excitation temperatures (Najita et al., 2003; Blake & Boogert, 2004), and are invariably bright in nearly all classical T Tauri and Herbig Ae stars. One of the most basic outcomes of this survey is the direct measurements of the size of the CO line emitting regions.
We demonstrate that astrometric signals in CO were detected for all sources on AU-scales, but with varying amplitude and with an intriguing range of structure: The CO spectra are divided into three rough phenomenological classes, based on the line shape in combination with the shape of astrometric spectra: Keplerian disks characterized by double-peaked line-profiles, single-peaked line sources with broad wings, and self-absorbed sources.
This paper is arranged as follows: In §2 the survey and data reduction are described, including a detailed discussion of the capabilities of the spectro-astrometric mode of CRIRES for super-resolution imaging. In §3), we discuss the results of fitting simple Keplerian disk models to the data. The central issue is that many CO line and astrometric spectra cannot be explained by Keplerian velocity fields. We introduce a non-Keplerian class of emission lines in §4 and explain why a purely Keplerian model fails. In §5, we develop a 2-dimensional model that adds a disk wind to a regular Keplerian, flared disk, and demonstrate that this provides a framework for matching all CO line and astrometric spectra from classical T Tauri stars under specific circumstances, namely if the wind is slow and uncollimated. We suggest that there is a smooth transition from lines dominated by Keplerian motions to wind-dominated lines, possibly scaling with the mass-loss/accretion rates. In §6 the implications for our understanding of disk dispersal and the nature of the warm molecular disk surface layer are discussed.
2. Observations
Spectro-astrometric observations were obtained as part of a large CRIRES survey of infrared molecular emission from protoplanetary disks and young stellar objects within the framework of the European Southern Observatory (ESO) Large Program 179.C-0151 (Pontoppidan et al., 2011). Spectro-astrometry is a highly sensitive method that allows a single telescope to obtain both spatial and kinematic information on gas-phase lines on very small scales, milliarcsecond, and at very high spectral resolution, . The final accuracy of a spectro-astrometric measurement depends linearly on both the signal-to-noise and the width of the spatial PSF. Basically, the method measures the spatial centroid offset of the spectrum as a function of wavelength across a line or other spectral feature, relative to the continuum. This approach can reveal spatial structure on scales much smaller than the formal diffraction limit of the observation. Spectro-astrometry was first developed for chromatic imaging and spectroscopy for the detection of stellar binaries in the visible range using specialized instrumentation (Beckers, 1982; Christy et al., 1983; Aime et al., 1988). The modern form, using an echelle spectrograph, was first presented by Bailey (1998), and is reviewed by Whelan & Garcia (2008). Infrared (m) spectro-astrometry of molecular lines with CRIRES was introduced by Pontoppidan et al. (2008), who presented CO data from three transitional disks, TW Hya, HD 135344B and SR 21. They showed that sub-milliarcsecond precisions could routinely be achieved and that the basic geometries of the line emitting regions – sizes, inclinations and position angles – could be determined with a high degree of confidence. Here we extend this sample to a much wider range of disks in terms of stellar type and evolutionary stage.
2.1. Observing strategy
Targets were selected for spectro-astrometric observations according to overall brightness and line-to-continuum contrast, as well as to cover as wide a range as possible in known disk and stellar characteristics. The line-to-continuum contrast is a particularly important parameter to consider, since the accuracy of the measured astrometric signal depends roughly linearly on this parameter (see §2.3). However, we were successful in obtaining high-quality spectro-astrometry for sources with line-to-continuum ratios spanning , where is the total flux and is the continuum flux. The central stars include spectral types from K7 to late A, and cover luminosities of 0.1 to 100 . The targets also span a wide range in accretion rates from to .
Overall, the sample is intended to represent the diversity found among protoplanetary disks to the extent that is possible given the limitations on the size of the sample. A log of the observations is given in Table 1, including those already described in Pontoppidan et al. (2008), while Table 2.3 summarizes the properties of the central stars.
The lack of a correction for differential refraction between the effective wavelengh of the slit viewing camera, which usually operates at - or -band, and the spectral wavelength precluded the observation of low-elevation targets for much of duration of the campaign111A correction for differential refraction was implemented in the observing software on November 28, 2008., including sources in the Taurus and Chamaeleon star forming regions. As a consequence, most targets are located in Ophiuchus, Serpens, Lupus and Corona Australis.
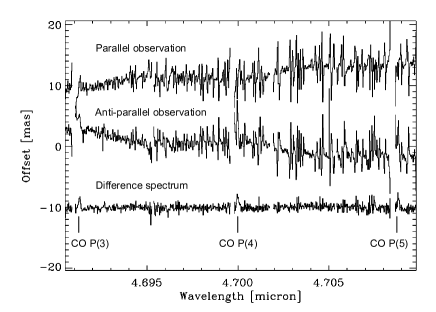
For any given single observation, the wavelength coverage will not be complete due to the presence of saturated telluric absorption lines. This is particularly true for CO and water, for which the Earth’s atmosphere absorbs in the same transitions as those targeted. For this reason, a number of observations were repeated with a cadence of 3 months to more than a year. The primary purpose was to take advantage of the Earth’s velocity around the Sun to shift the telluric CO lines relative to those of the target disks. By observing targets at different epochs, complete line profiles could be constructed by combining of spectra obtained at each side of a given object’s transit date. An example of how observations at two different epochs were combined to complete the spectral coverage of the CO lines is shown in Figure 1. This strategy also allows for a shallow search for variability in the astrometric spectra, although the shifting telluric absorption often make sensitive comparisons difficult. Variability at such time scales may be expected since the Keplerian time scale at the radii traced, AU is similar to or shorter than the cadence of observations. We can note that we did not detect any obvious variability in the sources observed during several epochs, but that we do not rule variability below the 20% level.
Significant artifacts in the astrometric spectra due to flat field and point spread function (PSF) effects may remain. The latter occurs if the PSF is not exactly rotation symmetric - and PSFs never are. Indeed, Brannigan et al. (2006) found such artifacts to be a common feature of spectro-astrometric observations. The correction for PSF artifacts is therefore an essential calibration of spectro-astrometry, without which meaningful analysis is not possible. To effectively correct for PSF artifacts, all astrometric spectra were obtained with the slit oriented at the desired position angle (P.A.), as well as at an antisymmetric . In order to ensure that the instrument was kept as stable as possible, a special CRIRES observing template was developed in which the grating and prism angle piezos were kept unchanged while the derotator changed the slit position angle. Furthermore, identical jitter patterns were used for the parallel and anti-parallel slit positions to maximize the reproducibility of artifacts. The difference average between these two antisymmetric spectra cancel out PSF artifacts while preserving any real signal. The efficacy of the procedure is demonstrated in Figure 2.

2.2. Data reduction
The data were reduced using our own IDL scripts. The procedure includes flat-fielding, correction for the non-linearity of the CRIRES detector response following the description in the CRIRES documentation issue 86.2, co-adding individual nod pairs and correction for spatial distortion. The flux spectra were extracted using optimal extraction (Horne, 1986), and were corrected for telluric absorption by division with a spectrum of an early-type standard star. The telluric standards were corrected for small airmass differences using a simple Beer law by minimizing the telluric noise in a region of the spectrum relatively clear of intrinsic lines. The CRIRES grating position is not reproducible, so small relative shifts of order a few pixels in the dispersion direction between the science and telluric spectra were applied. Finally, in some cases small differences in effective resolving power between target and standard star observation were corrected by degrading the resolving power by in either the science or telluric spectrum. Such differences may arise if differences in AO correction cause differences in the degree to which the source fills the slit. No attempt was made to include an absolute flux calibration and all spectra were normalized to the continuum flux level.
To further improve the signal-to-noise ratio, lines from similar transitions were averaged, wherever possible. In particular, this is important for the primary survey of the CO rovibrational band around 4.7 m, where typically 8 nearly identical (in terms of energy and collisional rates) lines can be averaged in a single CRIRES setting. The uncertainty in the spectro-astrometric signals for typical sources is background-limited.
2.3. Spectro-astrometric formulation
For the spectro-astrometry, we find that the most numerically stable and reproducible centroid () estimator as a function of line velocity is of the form:
| (1) |
where is the spatial location of a pixel and is the flux contained in that pixel. The centroid must also be corrected, using a constant factor , for the fact that not all light will be included within the aperture. That is, depends on the range over which is defined in the centroid estimator. In practice, however, is small, , and is estimated using a modeled PSF measured on the continuum of the spectrum. Consequently, the relative accuracy on the amplitude of the spectro-astrometric signal is likely , which is confirmed by repeated observations of the same sources (see also §2).
The uncertainty on the centroid is:
| (2) |
where the dependency of and on is left out for clarity.
At this point, there is one more issue to consider. In our formulation, the flux is a sum of a continuum term and a line term:
| (3) |
Normally, one would be interested in determining the centroid offsets for the line term only; the presence of the continuum term causes to underestimate the true spatial offset. We call this effect continuum dilution (see also Pontoppidan et al., 2008). Algebraic manipulation of equations 1 and 3 shows that the relation between the measured and true centroid offset is:
| (4) |
It is seen that the centroid naturally diverges for . This makes it inconvenient to display the observed spectra in terms of , and we consequently display all spectra in terms of . The reader should thus be aware that the true spatial extent of the line emission is higher by a factor . In the following, we define a scalar amplitude of a given astrometric spectrum as the maximal value of the centroid offset: . This is a convenient model-independent observable that provides a measure of the size of the line emitting region.
| Star | PA | Obs. Date | Int. Time | Spectral Range |
|---|---|---|---|---|
| minutes | m | |||
| LkHa 330 | 0° | 29/12/2008 | 24 | 4.660-4.770 |
| LkHa 330 | 60° | 29/12/2008 | 24 | 4.660-4.770 |
| LkHa 330 | 120° | 29/12/2008 | 24 | 4.660-4.770 |
| CW Tau | 0° | 1/1/2009 | 24 | 4.660-4.770 |
| CW Tau | 60° | 1/1/2009 | 24 | 4.660-4.770 |
| CW Tau | 120° | 1/1/2009 | 24 | 4.660-4.770 |
| DR Tau | 0° | 14/10/2007 | 24 | 4.805-4.901 |
| DR Tau | 60° | 14/10/2007 | 24 | 4.805-4.901 |
| DR Tau | 120° | 14/10/2007 | 24 | 4.805-4.901 |
| TW Hya | 63° | 26/4/2007 | 40 | 4.660-4.770 |
| TW Hya | 153° | 26/4/2007 | 40 | 4.660-4.770 |
| HD 135344B | 0° | 22/4/2007 | 20 | 4.645-4.755 |
| HD 135344B | 60° | 4/9/2007 | 20 | 4.660-4.770 |
| HD 135344B | 120° | 5/9/2007 | 20 | 4.660-4.770 |
| GQ Lup | 0° | 2/5/2008 | 24 | 4.660-4.770 |
| GQ Lup | 60° | 2/5/2008 | 24 | 4.660-4.770 |
| GQ Lup | 120° | 2/5/2008 | 24 | 4.660-4.770 |
| GQ Lup | 0° | 4/8/2008 | 24 | 4.660-4.770 |
| GQ Lup | 60° | 4/8/2008 | 24 | 4.660-4.770 |
| GQ Lup | 120° | 4/8/2008 | 24 | 4.660-4.770 |
| HD 142527 | 60° | 7/8/2008 | 12 | 4.639-4.749 |
| HD 142527 | 150° | 7/8/2008 | 12 | 4.639-4.749 |
| RU Lup | 0° | 26/4/2007 | 20 | 4.660-4.770 |
| RU Lup | 0° | 27/4/2008 | 24 | 4.660-4.770 |
| RU Lup | 60° | 27/4/2008 | 24 | 4.660-4.770 |
| RU Lup | 120° | 27/4/2008 | 24 | 4.660-4.770 |
| HD 144432 | 6° | 2/8/2008 | 16 | 4.639-4.749 |
| HD 144432 | 66° | 2/8/2008 | 16 | 4.639-4.749 |
| HD 144432 | 126° | 2/8/2008 | 16 | 4.639-4.749 |
| AS 205N | 55° | 29/8/2007 | 16 | 4.660-4.770 |
| AS 205N | 115° | 29/8/2007 | 16 | 4.660-4.770 |
| AS 205N | 55° | 29/8/2007 | 16 | 2.905-2.977 |
| AS 205N | 115° | 29/8/2007 | 16 | 2.905-2.977 |
| AS 205N | 175° | 1/9/2007 | 24 | 4.660-4.770 |
| AS 205N | 55° | 2/5/2008 | 16 | 4.660-4.770 |
| AS 205N | 115° | 2/5/2008 | 16 | 4.660-4.770 |
| AS 205N | 175° | 2/5/2008 | 16 | 4.660-4.770 |
| DoAr24E S | 30° | 3/9/2007 | 20 | 4.660-4.770 |
| DoAr24E S | 90° | 2/9/2007 | 20 | 4.660-4.770 |
| DoAr24E S | 150° | 2/9/2007 | 20 | 4.660-4.770 |
| SR 21 | 10° | 30/8/2007 | 32 | 4.660-4.770 |
| SR 21 | 70° | 30/8/2007 | 32 | 4.660-4.770 |
| SR 21 | 130° | 31/8/2007 | 32 | 4.660-4.770 |
| RNO 90 | 0° | 25/4/2007 | 16 | 4.660-4.770 |
| RNO 90 | 60° | 26/4/2007 | 16 | 4.660-4.770 |
| RNO 90 | 120° | 26/4/2007 | 16 | 4.660-4.770 |
| VV Ser | 15° | 5/9/2007 | 20 | 4.660-4.770 |
| VV Ser | 75° | 5/9/2007 | 20 | 4.660-4.770 |
| VV Ser | 15° | 1/5/2008 | 32 | 4.660-4.770 |
| VV Ser | 75° | 1/5/2008 | 32 | 4.660-4.770 |
| VV Ser | 135° | 1/5/2008 | 32 | 4.660-4.770 |
| S CrA N | 30° | 4/9/2007 | 20 | 4.660-4.770 |
| S CrA N | 90° | 4/9/2007 | 20 | 4.660-4.770 |
| S CrA N | 150° | 3/9/2007 | 20 | 4.660-4.770 |
| R CrA | 0° | 1/9/2007 | 12 | 4.660-4.770 |
| T CrA | 0° | 26/4/2007 | 20 | 4.660-4.770 |
| T CrA | 90° | 26/4/2007 | 20 | 4.660-4.770 |
| Source | ClassaaType of disk – can be classical T Tauri star (CTTS), Herbig AeBe star or transition disk | line profilebbType of CO rovibrational line profile as discussed in §1.2. | distanceccThe distances are based on the current best estimates to the parent young clusters of the disks, many of which are determined by parallax measurements of known cluster members. (Dzib et al., 2010; Torres et al., 2009; Loinard et al., 2008), (Torres et al., 2009). The distance to Corona Australis is well determined using the orbit solution for the eclipsing binary TY CrA (Casey et al., 1998). One exception is HD 135344B, which has an uncertain distance of 84-140 pc (Grady et al., 2009). | Sp. T. | ddThe mass of the central star is estimated based on the luminosity and spectral type using the evolutionary tracks of Siess et al. (2000). | eeRange of mass accretion rates found in the literature. | referencesffReferences used for the stellar properties and the mass accretion rates. | ||
|---|---|---|---|---|---|---|---|---|---|
| pc | |||||||||
| LkHa 330 | trans. disk | Keplerian | 250 | 9.0 | 16 | G3 | 2.5 | -8.80/-8.80 | 2,12 |
| CW Tau | CTTS | self-abs. | 140 | 7.5 | 0.8 | K3 | 1.2 | -8.80/-7.99 | 15,19 |
| DR Tau | CTTS | single-peak | 140 | 10.7 | 0.9 | K5 | 1.0 | -7.5/-5.1 | 16,17,18,19 |
| TW Hya | trans. disk | Keplerian | 51 | 3.0 | 0.23 | K7 | 0.7 | -8.80/-8.80 | 14 |
| HD 135344B | trans. disk | Keplerian | 84 | 7.5 | 8 | F3 | 1.6 | -8.30/-8.30 | 6 |
| GQ Lup | CTTS | Keplerian | 150 | 1.0 | 0.8 | K7 | 0.8 | -8.00/-8.00 | 11 |
| HD 142527 | HAeBe | Keplerian | 198 | 5.0 | 69 | F6 | 3.5 | -7.16/-7.16 | 6 |
| RU Lup | CTTS | single-peak | 150 | 3.5 | 0.4 | K7 | 0.7 | -7.70/-7.70 | 5 |
| HD 144432 | HAeBe | Keplerian | 145 | 6.0 | 10 | A9 | 1.7 | 7.07/-7.07 | 6 |
| AS 205N | CTTS | single-peak | 125 | 4.5 | 7.1 | K5 | 1.1 | -6.14/-6.14 | 10 |
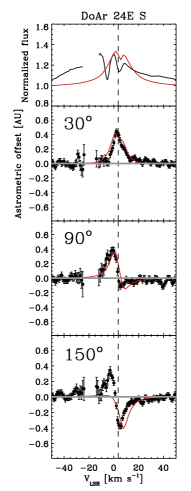
| DoAr 24E S | CTTS | self-abs. | 125 | 3.5 | 1.3 | K7-M0 | 0.7 | -8.46/-8.46 | 8 |
| SR 21 | trans. disk | Keplerian | 125 | 3.0 | 15 | G2.5 | 2.2 | 2 | |
| RNO 90 | CTTS | Keplerian | 125 | -1.5 | 4.0 | G5 | 1.5 | – | 3 |
| VV Ser | HAeBe | Keplerian | 415 | 7.0 | 125 | B1-A3 | 3.0 | -6.34/-6.34 | 9,4 |
| S CrA N | CTTS | single-peak | 130 | 2.4 | 2.3 | K3 | 1.5 | – | 13 |
| R CrA | HAeBe | self-abs. | 130 | 5: | 100 | B8-F5 | 3.5: | -7.12/-7.12 | 1 |
| T CrA | CTTS | self-abs. | 130 | 7: | 8 | F0-F5 | 1.6: | 7 |
References. — [1] Bibo et al. (1992), [2] Brown et al. (2007), [3] Chen et al. (1995), [4] Dzib et al. (2010), [5] Herczeg & Hillenbrand (2008), [6] Meijer et al. (2008), [7] Meyer & Wilking (2009), [8] Natta et al. (2006), [9] Pontoppidan et al. (2007a), [10] Prato et al. (2003), [11] Seperuelo Duarte et al. (2008), [12] Salyk et al. (2009), [13] Schegerer et al. (2009), [14] Thi et al. (2010), [15] White & Ghez (2001), [16] Mora et al. (2001), [17] Muzerolle et al. (2003), [18] Gullbring et al. (2000), [19] Johns-Krull & Gafford (2002)
3. Keplerian sources
3.1. Simple geometric models
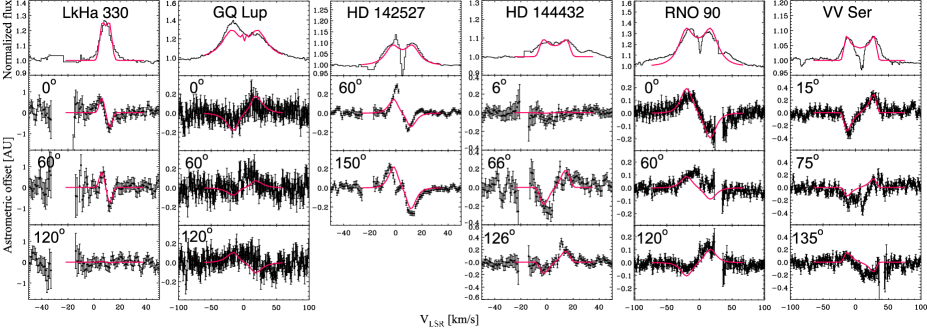
Keplerian sources are characterized by double-peaked line profiles in combination with broad astrometric spectra that display an anti-symmetric pattern at all slit position angles. For disks viewed at inclinations close to face-on, the double-peak may blend into a single peak, but if the astrometric spectra show an antisymmetric structure at all position angles, they are still considered Keplerian. The three disks discussed in Pontoppidan et al. (2008), HD 135344B, SR 21 and TW Hya, are in this category. Prototypical disks with clean double-peaked structure include GQ Lup, RNO 90 and VV Ser. The astrometric and line flux spectra of the Keplerian disks are shown in Figure 3. As shown in Pontoppidan et al. (2008) this structure is well explained by a simple model of a radial, flat distribution of gas in circular orbits around a point mass, and the antisymmetric structure is due to the relative spatial displacement of red- and blue-shifted gas in an inclined disk. If the slit is oriented along the major axis of the projected disk, the maximal astrometric displacement amplitude is seen. Conversely, for an exactly axisymmetric and flat disk, a slit oriented along the disk minor axis produces no astrometric signal. Given at least two slit position angles, the disk position angle can be determined with a high degree of confidence. The dominant line emitting radii can be determined, using the maximal astrometric offset for a slit aligned along the disk major axis. Finally, the disk inclination can be determined with confidence if a stellar mass is assumed and vice versa.
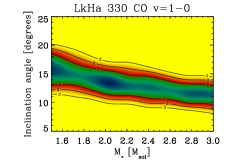
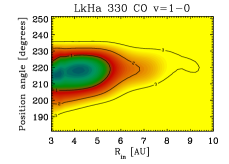
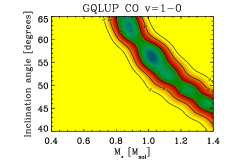
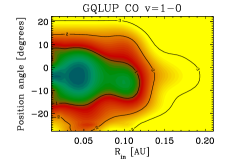
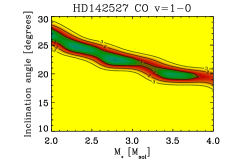
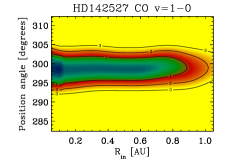
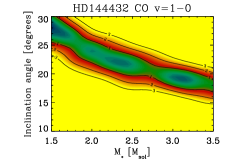
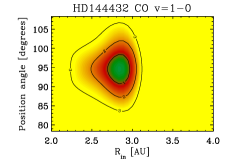
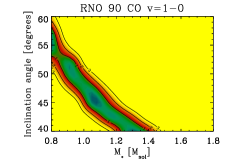
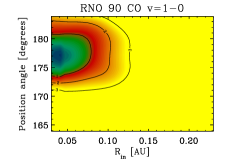
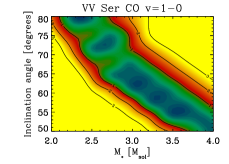
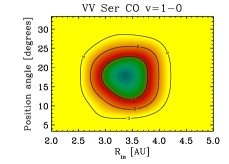
We use the same simple geometric model as Pontoppidan et al. (2008) to fit the data and determine the basic geometric parameters for the Keplerian disks. The parameters varied are the inner emitting radius, the stellar mass, the disk inclination, , and position angle, P.A. Figure 4 shows the resulting goodness-of-fit contours for these four parameters. Table 3 summarizes the best-fit parameters. As expected, the stellar mass and the disk inclination are degenerate, but in such a way that even an uncertain assumption of the stellar mass allows an accurate determination of the disk inclination. The disk position angles are absolutely determined, while the inner radius is somewhat dependent on the choice of the relation (here assumed to be a power law with exponent ). In lieu of the inner radius determined from the fit, the size of the line emitting ring, in an averaged sense, can also be estimated by using the amplitude , defined above, and correcting for continuum dilution (see §2.3).
3.2. A size-luminosity relation for ro-vibrational CO
In Figure 5, the astrometric amplitudes are plotted versus the stellar luminosities. It is seen that the Keplerian disks show a clear correlation across nearly four decades in stellar luminosity as , with a best-fit exponent of . This is the relation expected for the radius of a specific equilibrium temperature as a function of stellar luminosity (e.g., Dullemond et al., 2001; Monnier & Millan-Gabet, 2002). A very similar size-luminosity relation was found for the -band continuum emission from Herbig Ae/Be stars using the Keck interferometer (Monnier et al., 2005). Here, we find that the molecular gas obeys a similar relation, but on larger scales and extending down to sub-solar luminosities.
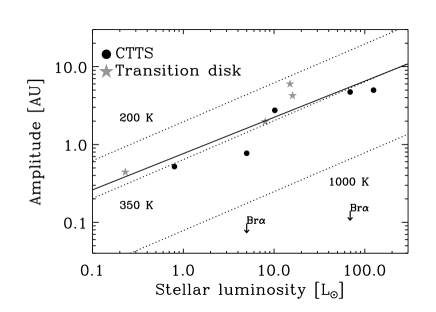

The observed points are compared to the radii of different optically thin grey dust equilibrium temperatures, (Monnier & Millan-Gabet, 2002), where is the ratio of the dust absorption efficiencies at the color temperatures of the incident and reemiiting radiation fields. Note that the dust temperature also depends on additional radiation sources, such as that of the surrounding disk (Dullemond et al., 2001), which will tend to push the radius at a specific temperature outwards. However, this prescription allows a direct comparison to the analysis of Monnier et al. (2005).
As is seen in Figure 5, the gas lines are indeed dominated by gas at radii well beyond the interferometrically measured dust sublimation radii at K, and consistently match dust at 350 K. In the limit of a disk truncated at a sharp, optically thick, inner disk rim, the CO sizes correspond to dust at somewhat higher temperatures of 500 K. It is important to realize that some molecular gas may still extend inwards, as indicated by the best-fit inner radii and the high velocities of emission in the line wings (Salyk et al., 2007), but the lines are not dominated by that component; the astrometric sizes measure the bulk of the gas emission.
Of particular interest, however, is that some transition disks fall on the size-luminosity relation defined by the classical disks, specifically TW Hya and HD 135344B – SR 21 falls somewhat above the relation. This is consistent with the findings of Salyk et al. (2007), Pontoppidan et al. (2008) and Salyk et al. (2009); that the inner disk gas of some transition disks often has not been removed in the same way as the population of small dust grains. For these disks, it now appears that there is not even a difference in the radii forming the CO gas emission, and that the lines simply follow the expected dependence on luminosity. This can be interpreted as the removal of the small dust opacity component through the process of planetesimal formation, as this will preserve a significant column of gas in the inner evolved zone of the disk. The caveat is that this is a very small sample of transition disks, and the inclusion of additional disks may show a greater degree of complexity, including the operation of other mechanisms of inner disk clearing, such as photoevaporation or clearing by an unseen, but massive, (stellar) companion, both of which would tend to move the inner edge of the gas-disk outwards. It will be interesting to see how many transition disks, in fact, fall on the relation.
| Star | [AU] | P.A. | aaAssuming the stellar masses from Table 2.3 |
|---|---|---|---|
| LkhA 330 | 41 | 21810 | 12 |
| GQ Lup | 35710 | 65 | |
| HD 142527 | 0.20.3 | 2993 | 20 |
| HD 144432 | 2.70.1 | 953 | 25 |
| RNO 90 | 0.060.01 | 1773 | 37 |
| VV Ser | 0.30.3 | 174 | 65 |
3.3. Spectro-astrometry of hydrogen recombination lines in Keplerian sources
Spectro-astrometry suffers from a fundamental symmetry ambiguity. Because the line centroid offsets are measured relative to the continuum, departures from circular symmetry in the continuum brightness distribution will be imprinted in the astrometric signal. For instance, if the continuum emission is due to a sharp inner rim in the dust disk (as in the models of Dullemond et al., 2001) and the disk is viewed at some inclination, an asymmetry should be seen in the astrometric line spectrum when the slit is oriented along the disk minor axis. However, it is fundamentally not possible to disentangle this effect from an azimuthal asymmetry in the line intensity. In other words, CO spectro-astrometry cannot distinguish between structure in the spatial distribution of line intensity and the spatial distribution of continuum intensity. This could be remedied if there were an independent line tracer of the stellar location. In this section, we suggest that hydrogen recombination lines may, for many young stars, constitute such a tracer that may allow for spectro-astrometry of the continuum.
There is a growing consensus that a dominant contributing process to H I emission from T Tauri and Herbig Ae stars is magnetospheric accretion (Calvet & Hartmann, 1992; Muzerolle et al., 1998; Bary et al., 2008), a shift from an original interpretation in the framework of stellar winds (Hartmann et al., 1990; Calvet et al., 1992; Grinin & Mitskevich, 1991), based on observed P Cygni profiles of the Balmer lines in some sources. While winds likely do contribute to the optical H I lines, near-IR lines tracing higher energies and densities appear to be dominated by accretion flows, as indicated by a general lack of blue-shifted absorption (Folha & Emerson, 2001). If the lines are indeed dominated by accretion flows, the astrometry is expected to constrain the H I emission to within a few stellar radii, corresponding to scales significantly smaller than the disk co-rotation radii.
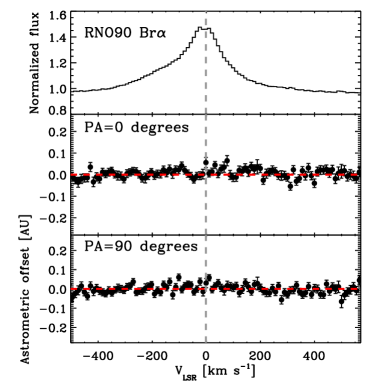
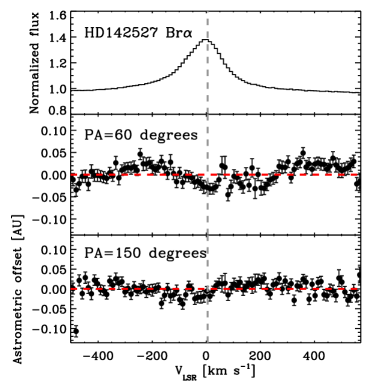
We obtained spectro-astrometry along two perpendicular position angles of the Brackett lines at 4.05 m for two of the Keplerian sources: RNO 90 and HD 142527. This line traces somewhat lower energies than e.g. the Brackett line at shorter wavelengths, 2.16 m, but was chosen because the 4 m continuum source is more likely to be comparable to that at 4.7 m. In particular, it is more likely to trace dust emission, which is not necessarily the case at 2 m, where gas opacity may dominate (Eisner et al., 2009). The resulting spectra are shown in Figure 6. No astrometric signals are detected to limits of 0.35 mas for RNO 90, while a tentative astrometric signal is seen at the 0.2-0.3 mas level at a P.A for HD 142527. The formal displacement errors in the two sources correspond to similar physical sizes since HD 142527 is at almost twice the distance of RNO 90 (198 pc versus 125 pc). The conclusion is that the dust continuum emission is azimuthically symmetric and spatial asymmetries seen in the CO emission is not due to spatial structure of the continuum emission.
These results are consistent with an accretion origin of the infrared H I lines. Alternatively, formation in a very compact stellar wind cannot be ruled out (a slight blue-shifted asymmetry is seen in the line profiles). Note that a potential stellar wind giving rise to H I lines should not be confused with the much more extended disk wind discussed below in the context of the CO lines. More importantly, in the context of the inner disk, the lack of strong astrometric signatures from the H I lines rule out a sharp, inclined inner edge structure of the 4 m continuum emission. This is a result similar to that found with near-IR interferometry of the 2 m continuum. It is interesting to note that Whelan et al. (2004) found highly extended (10-100 mas) spectro-astrometric signals of the Paschen lines (tracing the same n=5 level as the Brackett line used here) from a few T Tauri stars, including DG Tau, which is known to possess a strong jet.
4. Non-Keplerian (radial) flows
Only some CO spectra of protoplanetary disks are as simple to interpret as the Keplerian disks discussed above. Many show a structure not consistent with a strictly defined Keplerian velocity field. The class of single-peaked line sources is characterized by a single peaked line spectrum, but with a broad base extending to and narrow astrometric spectra that are highly asymmetric about the continuum at a characteristic position angle. This spectral class was described by Najita et al. (2003). Bast et al. (2010) notes that the narrow central peaks in these sources do not show a splitting at least down to the CRIRES spectral resolution of . One obvious explanation for the narrow peak, favored by Occam’s razor, involves a Keplerian disk with line emission from large radii with corresponding low Keplerian velocities. The spectro-astrometry results rule out this scenario. First, if the lines are formed in a Keplerian disk, the central peak must be emitted from radii of , corresponding to AU for . Such extended emission should be directly spatially resolved by classical imaging with CRIRES (which has a diffraction-limited 4.7 m spatial resolution of AU at 125 pc), yet no extended line emission is observed. However, classical imaging still allows for the possibility of disks with . This is where spectro-astrometry steps in by constraining the line emission to much smaller spatial scales (AU), regardless of inclination, thus ruling out formation in a Keplerian flow at the level.
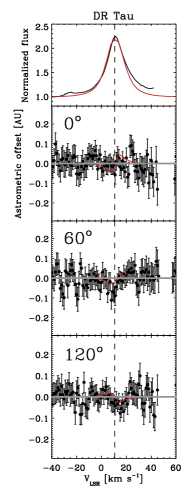
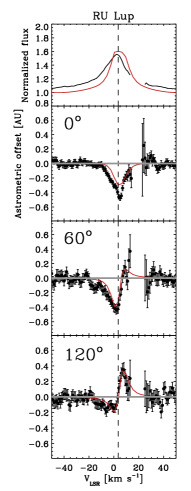
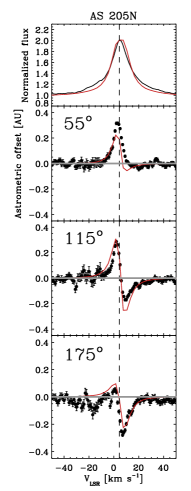
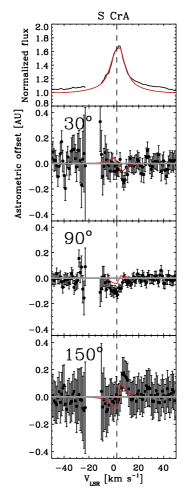
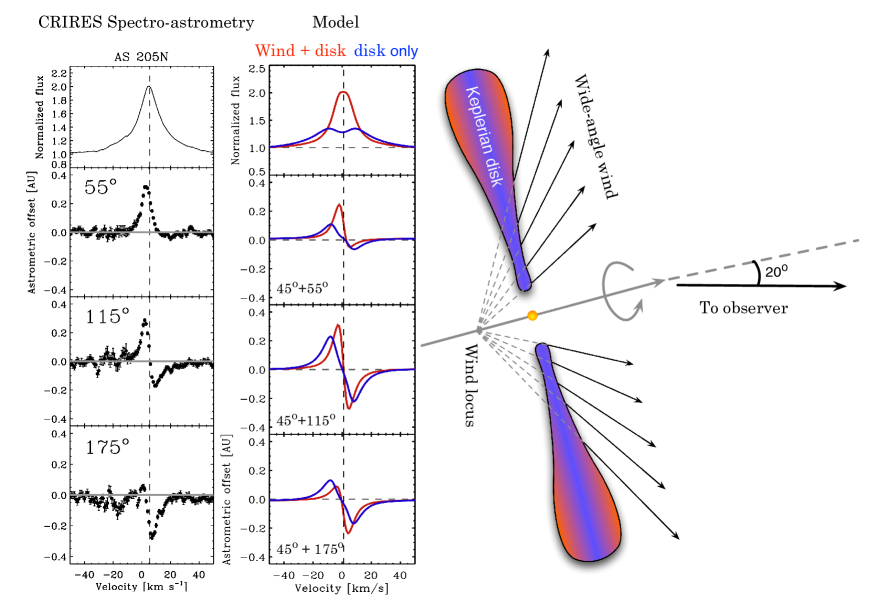
AS 205N is the prototypical example of a source with single-peaked, broad winged line profile. The astrometric spectra of the three clean single-peaked sources are shown in Figure 7. For these sources, one out of three position angles, separated by shows an astrometric line signature centered on the line velocity, but entirely offset in one direction. The other two angles show the antisymmetric signature that might be expected from a Keplerian velocity field. The amplitude of the astrometric spectra are AU, and the astrometric line is significantly narrower than the flux profile, with the wings missing.
In essence, the combination of narrow line profiles and small spatial extent indicates sub-Keplerian motions. We explore a model that explains the qualitative properties of the single-peaked class of CO line spectra in §5.
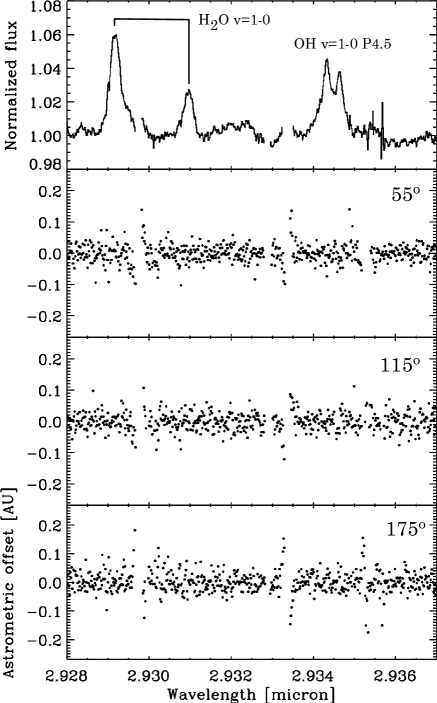
4.1. H2O and OH in AS 205N
A number of other single-peaked line disks are known to show strong emission from water vapor at 3 m as well as throughout the mid-infrared range. Salyk et al. (2008) demonstrated the existence of lines due to gaseous H2O and OH in the m hot band for AS 205N. The lines have low contrast relative to the continuum (5-10%). However, CRIRES is significantly more sensitive at 3 m than at 4.7 m, so a detection of an astrometric signal from the water lines may be possible. AS 205N was observed in August 2007 with 3 different position angles to match the CO observation. No astrometric signals were detected either for H2O or for OH. The upper limits are in both cases mas, corresponding to AU at a distance of 125 pc, when correcting for continuum dilution, or an emitting area of . This is consistent with a measured emitting area of for the 3 m water lines found by Salyk et al. (2008), and is marginally smaller than the radial extent of the CO emission (0.7 AU). Since the excitation energies of the m water and OH lines are higher than those of CO, it is likely that the smaller extent can be explained by an origin in somewhat warmer gas.
4.2. Self-absorbed sources
Finally, self-absorbed sources have strong absorption components superposed on broad emission lines and are consequently more complex. While the gas forming the absorption lines in some sources may be completely unrelated to the disk, it is discussed in section 5 how some self-absorbed sources may be a different representation of the peaky line sources, namely those viewed at a higher inclination angle.
The self-absorbed sources tend to show the highest amplitude astrometric spectra of the survey. The physical difference between the single-peaked and self-absorbed sources and the Keplerian disks is illustrated by their astrometric amplitudes in Figure 5. These sources do not fall along a neat correlation with the stellar luminosity as do the Keplerian disks. T CrA and R CrA in particular show astrometric amplitudes as high as 20-30 AU, indicating that the absorbing gas is structured on much larger scales than the emitting gas. These sources are likely to be younger and more embedded than the remaining sample, which may impact the observables.


5. A new unified disk+wind model
5.1. Parametrization
A parametrized disk wind model is used to test whether an idealized wind structure can produce a plausible match to the phenomenology of the single-peaked line profiles and associated asymmetric astrometric spectra. It is based on models for UV resonance and hydrogen line emission from accretion disk winds (e.g., Knigge et al., 1995; Kurosawa et al., 2006), and represents a computationally convenient structure inspired by numerical results from magneto-hydrodynamical (MHD) simulations of magnetized disk winds (Konigl & Pudritz, 2000).
The basic requirement of the observed spectro-astrometry is that the line forming gas must be orbiting the central star with strongly sub-Keplerian azimuthal velocities in order to produce the single peak without requiring that the emission is extended at the spatial resolution of CRIRES (015). A wide angle wind provides a convenient physical way of accomplishing this through simple conservation of angular momentum – as a gas parcel is forced outwards due to the wind pressure, the azimuthal velocity decreases linearly with radius, in comparison with the underlying Keplerian disk in which the velocity experiences a shallower decrease as . This generates gas above the disk that is supported by wind pressure and orbits at low azimuthal velocities.
Following Kurosawa et al. (2006), the wind is constructed as a set of linear streamlines with a locus below the central star at a distance in units of . This generates a conical wind with no flow along the disk axis. Briefly, the wind is accelerated along the field lines as:
| (5) |
where is the coordinate along the stream line, is the sound speed, is the asymptotic velocity at the end of the stream line and is the scale of the acceleration region of the wind. is the wind acceleration parameter. Requiring angular momentum conservation, the azimuthal velocity component is:
| (6) |
where is the radial disk coordinate.
The density of the wind is calculated assuming mass conservation:
| (7) |
Here, is the local mass-loss rate, is the angle between the stream line and the disk normal and S is the distance to the wind locus. The exponent of the local mass loss rate is taken to be (Krasnopolsky et al., 2003). The total wind mass loss rate can be calculated by integrating over the disk and multiplying by two to include the opposite surface:
| (8) |

The raytracer RADLite (Pontoppidan et al., 2009) is used to render model lines and spectro-astrometry for the wind models, based on a generic model of a flared protoplanetary disk, and assuming level populations in LTE. Specifically, the temperature structure is assumed to be in equilibrium with the stellar radiation field and dominated by dust heating/cooling. In reality, the heating of the wind is likely to be dominated by photo-electric heating similar to the heating of the disk atmosphere (Kamp & Dullemond, 2004; Jonkheid et al., 2004; Gorti & Hollenbach, 2004; Dullemond et al., 2007) or, perhaps, ambipolar diffusion (Safier, 1993). The cooling may be dominated by adiabatic expansion and molecular cooling (e.g., partly via the observed CO and H2O lines). However, we restrict ourselves to qualitative models in this paper (see also §6.5), since a detailed and appropriate physical treatment of the thermal wind structure required to match the observations will be likely be a significant study in its own right.
5.2. Properties of the wind model observables
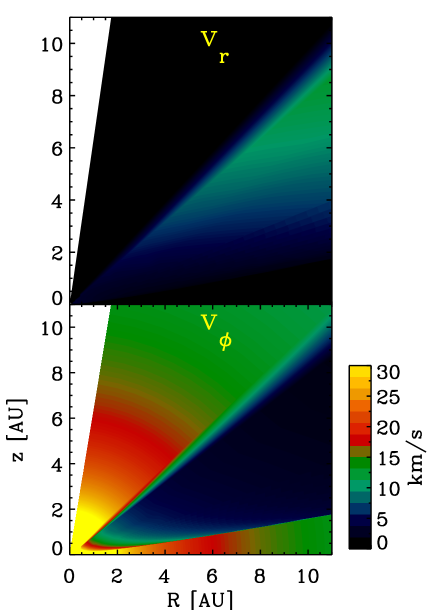
Figure 10 illustrates the wind geometry and compares the observables generated using the wind model for the spectro-astrometry of AS 205N. The total mass-loss rate is , assuming a CO abundance of relative to . This mass-loss rate is consistent with a highly accreting CTTS. Indeed, AS 205N is accreting at a rate of (Eisner et al., 2005). There is no treatment of the chemistry of the wind in the present model, so if the abundance of CO is lower than that assumed, the mass-loss rate will be correspondingly higher. However, the numbers appear to be physically reasonable; the ratio of mass-loss to mass-accretion rates is , and as this ratio is expected to be as high as 10% (Konigl & Pudritz, 2000), the CO abundance in the wind could in fact be lower than assumed. There are many free parameters in the wind model, so that shown represents one possibility that reproduces the main characteristics of the observed astrometric spectra. A full parameter study, beyond the scope of this paper, may reveal significant degeneracies. That said, some parameters are well constrained, including the position angle of the system. General properties are also locus distances and inclinations of . The velocity field used for AS 205N is shown in Figure 11.
It is seen that the wind model can explain the key properties of the combined line profile and astrometric spectra: namely it readily produces single-peaked lines with broad wings. The wings are dominated by the innermost, Keplerian disk, while the single peak is generated by the sub-Keplerian gas at a few AU. The presence of a strongly sub-Keplerian component requires a wide-angle, non-collimated wind, in the model parametrized as a small star-to-locus distance, . Increasing results in a double-peaked line profile that would be resolvable with CRIRES. The astrometric spectra become highly asymmetric at P.A.’s close to the disk minor axis. It is important to note that this wind geometry does not necessarily produce strongly blue-shifted lines – which might have been expected. The uncollimated winds sees much of the line emission coming from gas moving on trajectories nearly parallel to the disk surface. For sources viewed at low inclination angles, this generates low radial velocities and prevents large blue-shifts, as required by the data. The addition of a significant amount of gas at high altitudes where the optical depths toward the central star are low, results in higher column densities of warm CO, leading to brighter lines with higher line-to-continuum ratios, a property of this class of CO spectra that has been observed (Bast et al., 2010).
Table 4 summarizes the RADLite wind model parameters for the wind-dominated disks. Since we do not fully explore the parameter space, the entries in the table represent a possible model, but with a caution that significant degeneracies may exist. Further, the use of LTE level populations and the assumption of coupled dust and gas temperatures almost certainly introduce inaccuracies in the implied wind structures. Indeed, it was typically necessary to increase the luminosity of the central source to values well above the known stellar properties to match the amplitude of the astrometric signal, especially in the case of RU Lup, the reason being that the gas temperatures are significantly higher than what can be explained by pure coupling to dust.
5.3. The wind model at higher inclinations as a model for the self-absorbed disks
As can be seen in Figure 11, there is no wind component along the disk axis due to the finite size of the inner disk rim. Because of this, a disk wind viewed close to face-on, as is likely the case for AS 205N, allows a free view of the continuum emission from the innermost disk, consistent with the low extinction toward the central star in many of our targets. However, if the inclination were higher, say , the entire wind column will be located between the disk continuum emission and the observer. This leads to the formation of a strong line absorption component, as illustrated in Figure 12. The Figure shows the line profiles of the prototypical AS 205N model, but viewed at higher inclination angles. A deep absorption line forms at inclinations higher than for this particular model, a result that can be compared directly to sources exhibiting a self-absorbed line, such as CW Tau. The line profile of this source is qualitatively reproduced by the AS 205N model viewed at an inclination angle of . The depth of the absorption line is smaller in the model, but can easily be deepened by increasing the mass-loss rate. We note that the small spectro-astrometric sample of self-absorbed source includes sources such as R CrA and T CrA are clearly younger and more embedded than the remaining disk sample, and their deeper absorption components are consistent with mass-loss rates 2-3 orders of magnitudes higher than that of the AS 205N model. However, there are more bona-fide isolated disks in our CRIRES survey showing strong, warm CO absorption that were not included as spectro-astrometric targets, but with properties otherwise resembling CW Tau.
The four self-absorbed disks are not modeled in detail for several reasons. We found it difficult to reproduce the very high amplitudes of the astrometric offsets for the absorption component for CW Tau and T CrA, likely indicating the presence of extended continuum emission structure. DoAr 24E S has several absorption components that also cannot be modeled exactly with the wind model without the additional parameters. However, we do still present a best effort model of DoAr 24E S in Figure 9 to illustrate the required complexity of this star.
| Star | P.A.aaPosition angle of the disk major axis. | ibbInclination of the disk rotation axis. A negative value of the inclination corresponds to the north pole of the disk facing the observer. | ccRatio between the luminosity of the central source used in the model and the actual stellar luminosity. A high ratio indicates that the gas is heated to temperatures significantly higher than those of the dust. | dddDistance between the locus of the wind and the central star (in units of stellar radius). d=0 corresponds to a spherical wind. | eeMass loss rate of the wind assuming . |
|---|---|---|---|---|---|
| DR Tau | 0°: | -9° | 1.0 | 1 | |
| RU Lup | 80° | 35° | 90 | 8 | |
| AS 205N | 235° | 20° | 1.8 | 5 | |
| DoAr24E S | 235° | 20° | 1.8 | 5 | |
| S CrA | 15° | 10° | 1.3 | 4 |
6. Discussion
The origin of CO rovibrational emission lines from protoplanetary disks has long been a puzzle. While it has been clear that the lines are formed close to the star, given the high temperatures and densities required to excite the lines, the great variation of the line shapes and excitation temperatures – rotational and vibrational – have evaded a unified explanation. Specifically, the lines cannot be explained solely by thermal emission from simple Keplerian disks, except in a few cases. This was already noted by Najita et al. (2003), but an unambiguous identification of the additional (to a Keplerian disk) radial flow pattern could not be determined. Now, with the addition of spatial information, as offered by high resolution spectro-astrometry, we can present a more comprehensive picture of the dynamics of molecular gas on AU-scales in protoplanetary disks.
6.1. Size of the line emitting regions
In §3 we show that sources with double-peaked (Keplerian) profiles obey a size-luminosity relation with a power-law index of , as expected for emission truncated at a radius of constant temperature. Critical ingredients in identifying this relation are the ability to distinguish Keplerian disk-dominated lines from the wind-dominated and self-absorbed lines, as well as the use of the direct size measure offered by spectro-astrometry. Specifically, the astrometric amplitude is not dependent on disk inclination, which otherwise makes it difficult to use the line width as an accurate proxy for size.
Another conclusion that can be drawn from the measured sizes of the emitting region from Keplerian sources is that a line origin in the accretion flow can be ruled out. Accretion flows are expected to generated double-peaked CO line profiles (Najita et al., 2003). Funnel (along magnetic field lines) accretion flows are expected to be launched from radii near, or within, the corotation radius (Shu et al., 1994). This is, for T Tauri stars, located inside the dust sublimation radius at 2-10 stellar radii, and thus well within the observed CO radii of 100 . The Br lines as observed in RNO 90 and HD 142527 have astrometric displacements much smaller than those of CO and evidently traces a different gas component, which may still be an accretion flow. Note that because the H I lines trace a much wider range of infall velocities than the CO – H I line widths are 100-200 – they are less affected by Keplerian rotation at the bottom of the flows than the narrower CO lines (Muzerolle et al., 1998). Consequently, they may not display a double-peaked profile even if formed as part of an accretion flow.
Is it expected that CO follows a relation that was developed for dust sublimation? One possibility is that dust shielding plays a significant role in the survival of CO in the inner regions of disks. In this case, CO would only be able to survive at radii at which the radial column of dust is sufficiently high. This is consistent with CO existing at radii larger than those of the inner dust rim. However, CO is also know to efficiently self-shield, even at low column densities of (Visser et al., 2009), although uncertainties are large at temperatures higher than a few 100 K.
6.2. Non-Keplerian motions and a unifying model for CO rovibrational lines
We propose that most, if not all, disks have a molecular wind velocity component in addition to pure Keplerian rotation – one that is effectively traced by ro-vibrational CO lines, presumably in addition to lines from a wide range of other molecules with strong infrared emission bands. Najita et al. (2003) argues against a wind based on the fact that the lines are not blue-shifted and that very young (stage I) high accretion rate sources sometimes do not show rovibrational CO emission lines. However, our wind model shows that a strong blueshift of the line emission is not necessary for the uncollimated slow disk winds constrained by angular momentum conservation. While we do not specifically address the lack of strong CO lines toward some embedded young stellar objects, strong accretion may heat the disk mid-planes to a point where the temperature inversion in the disk surface required for line emission is no longer possible. Furthermore, we do find that the contribution of outflowing gas to the line emission is highly variable, possibly in relation to the level of accretion activity onto the central star. While we have not sought to determine the wind launching mechanism, the data do suggest that the wind is uncollimated and slow (). It is important to stress that the wind should not be seen as entirely separate from the Keplerian disk, but rather as a modification. For instance, the gas does not suddenly stop its Keplerian rotation even as it attains a radial velocity component. For low wind accelerations, it may be difficult to determine that there is a difference at all from a pure Keplerian velocity field. As the wind is launched, the gas maintains its angular momentum and slows down so much as it is pushed outwards that it may never escape the system, but re-accrete onto the disk at larger radii. The mass-loss rates implied by our wind models are large enough that the inner disk gas can be completely redistributed during the lifetime of the disk. This may limit the time available for planet formation, in line with ideas generally associated with photo-evaporative disk winds (Alexander et al., 2006).
6.3. Wind launching mechanism
We will not discuss in detail how the molecular wind is launched. However, the requirement that it is uncollimated and slow likely places significant physical constraints on the launching mechanism. For instance, a magnetic centrifugal wind might be expected to generate winds that are much too fast as the gas in this case will be locked to the stellar rotation, known to be beyond the inner rim of the disk. A thermal wind is much slower, but may require high ionization fractions and gas temperatures (K), which could be inconsistent with the presence of abundant molecules with rotational temperatures of K. The photo-evaporative wind models by Alexander et al. (2006) predict wind launch speeds that may even be slightly subsonic (5-10 ), consistent with our observational finding. It can be noted that the evaporative winds predict a somewhat shallower exponent for the drop-off of the mass-loss rate with radius than the used here. Experimenting with our model indicates that good fits may also be found with , although not as readily. Also noteworthy is that the models by Alexander et al. (2006) predict significant blueshifts of wind-dominated [Ne II] line peaks (5-10 Alexander, 2008), which does not appear in the CO data, at least compared to the ambient cloud velocity traced by cold absorption components.
6.4. Implications for radial mixing
The observational implication of slow gas flows above the canonical “warm molecular layer” of the disk may have important implications for the transport of material in the disk. Specifically, the gas may never be accelerated to velocities allowing it to escape the disk, allowing it to fall back onto the disk at larger radii. For flow rates of , a wind lasting a few Myr will clearly be able to re-distribute a significant fraction, if not all, of the inner disk gas not accreted onto the central star. Similar ideas where driving the development of early disk wind models, such as the X-wind (Shu et al., 1994) to explain the redistribution of solids required to produce the crystalline dust grains in cometary material. It may be important to note that if the outflowing gas falls back onto the disk, there will be a significant azimuthal velocity differential as sub-Keplerian material impacts the Keplerian disk below. Judging from Figure 11, the differential may be as high as 10-15 if the fall happens at 10 AU, but less if the fall happens farther out in the disk. This is sufficient to generate shocks that may be observable.
6.5. Caveats, unknowns and new questions
Clearly, the parametrized wind model is not based on a detailed treatment of the underlying hydrodynamics and radiative transfer. However, it does represent a phenomenological structure required to match clearly defined observables. It is therefore important to consider the circumstances under which the physical and chemical structure of the wind may differ from the simple model.
One property of the wind model that does not match the observations is the rotational temperatures of the lines. The model predicts lower temperatures than observed. However, this can likely be explained by the use of LTE level populations in thermal balance with the dust. The gas that forms the wind will be exposed to a strong IR and UV radiation field from the central star and innermost disk, and is therefore subject to fluorescence pumping as well as collisional excitation by a gas that is heated and likely partly ionized by photo-electrons. Balancing this are the strong cooling terms offered by the rovibrational molecular emission, in particular that of CO and water. While previous wind models (e.g., Safier, 1993) generally predict very high wind temperatures (10,000 K) and fast winds (), the existence of significant molecular coolants may, in part of the wind flow, maintain the required low temperatures and velocities. In particular the temperatures may be closer to those given by the assumption of equilibrium with the stellar radiation field, as assumed in this paper, than the high temperatures implied by a purely atomic gas. A future detailed heating-cooling balance calculation for the wind model is clearly an important next step.
More detailed hydro-dynamic modeling is essential to fully assess the implications of slow disk winds. What is the wind launching mechanism? Does the wind eventually fall back onto the disk and at which radii? How can the wind remain, at least in part, in a molecular form as the material is lofted to altitudes where dust shielding low and the gas is exposed to a harsh UV radiation field? While a model of the chemistry of the molecular wind is a study in its own right, it can be noted that the CO column densities required to generate the deep absorption lines seen in the self-absorbed (more inclined) sources are likely high enough to self-shield. Likewise, the presence of water in the flow, at least in AS 205N – see Figure 8 – will provide additional shielding against UV photons for a range of molecular species (Bethell & Bergin, 2009).
7. Conclusion
Using spectro-astrometry to image molecular gas at 0.1-10 AU in a sample of protoplanetary disks has revealed an intriguing range of structure. Some disks appear to be dominated by gas in Keplerian rotation about the central star, as expected, while others have a significant slow radial velocity component consistent with a wide-angle disk wind. The basic observational evidence for a slow wind is the clear presence of low velocity gas () within a few AU from the central star. It is difficult to generate low velocity gas deep in a potential well, but one simple way of doing so is via angular momentum conservation of an expanding, but initially Keplerian, flow. While it has long been known that fast atomic winds were common in T Tauri stars, we now find that there is a significant molecular component as well. Further, it appears that the observed molecular wind must be launched from the disk surface. It is not clear whether the gas in the wind reaches escape velocities, and may therefore be re-accreted onto the disk at larger radii. The wind reproducing the CO line spectro-astrometry is much slower than that predicted by X-wind theory, which reaches terminal velocities of several (Shu et al., 1994), but is a much better match to photo-evaporative flows that have poloidal velocities similar to the sound speed (e.g., Alexander et al., 2006). The existence of disk winds with high mass-loss rates have significant implications for the availability of material for planet formation in the PFZs of protoplanetary disks, and may limit the time available for planet formation. The potential large scale cycling of inner disk material as suggested by the low velocity of the winds will also influence the chemistry of planet-forming material, for instance by exposing a large fraction of the disk mass to the strong UV fields at high disk elevations. Future work will include the development of a model for how slow molecular winds are launched, as well as a chemical model of the wind that can explain the survivability of, at least, CO, H2O and OH at low optical depths and at high elevations above the disk.
References
- Aime et al. (1988) Aime, C., Borgnino, J., Lund, G., & Ricort, G. 1988, in European Southern Observatory Conference and Workshop Proceedings, Vol. 29, European Southern Observatory Conference and Workshop Proceedings, ed. F. Merkle, 249–256
- Akeson et al. (2005) Akeson, R. L. et al. 2005, ApJ, 622, 440
- Alencar et al. (2001) Alencar, S. H. P., Johns-Krull, C. M., & Basri, G. 2001, AJ, 122, 3335
- Alexander (2008) Alexander, R. D. 2008, MNRAS, 391, L64
- Alexander & Armitage (2009) Alexander, R. D., & Armitage, P. J. 2009, ApJ, 704, 989
- Alexander et al. (2006) Alexander, R. D., Clarke, C. J., & Pringle, J. E. 2006, MNRAS, 369, 216
- Alibert et al. (2004) Alibert, Y., Mordasini, C., & Benz, W. 2004, A&A, 417, L25
- Andrews & Williams (2007) Andrews, S. M., & Williams, J. P. 2007, ApJ, 659, 705
- Andrews et al. (2009) Andrews, S. M., Wilner, D. J., Hughes, A. M., Qi, C., & Dullemond, C. P. 2009, ApJ, 700, 1502
- Bailey (1998) Bailey, J. 1998, MNRAS, 301, 161
- Bary et al. (2008) Bary, J. S., Matt, S. P., Skrutskie, M. F., Wilson, J. C., Peterson, D. E., & Nelson, M. J. 2008, ApJ, 687, 376
- Bast et al. (2010) Bast, J. E., Brown, J. M., Herczeg, G. J., van Dishoeck, E. F., & Pontoppidan, K. M. 2010, A&A, submitted
- Beckers (1982) Beckers, J. M. 1982, Optica Acta, 29, 361
- Bethell & Bergin (2009) Bethell, T., & Bergin, E. 2009, Science, 326, 1675
- Bibo et al. (1992) Bibo, E. A., The, P. S., & Dawanas, D. N. 1992, A&A, 260, 293
- Blake & Boogert (2004) Blake, G. A., & Boogert, A. C. A. 2004, ApJ, 606, L73
- Boss (1997) Boss, A. P. 1997, Science, 276, 1836
- Brannigan et al. (2006) Brannigan, E., Takami, M., Chrysostomou, A., & Bailey, J. 2006, MNRAS, 367, 315
- Broeg et al. (2007) Broeg, C., Schmidt, T. O. B., Guenther, E., Gaedke, A., Bedalov, A., Neuhäuser, R., & Walter, F. M. 2007, A&A, 468, 1039
- Brown et al. (2007) Brown, J. M. et al. 2007, ApJ, 664, L107
- Brown et al. (2009) Brown, J. M., Blake, G. A., Qi, C., Dullemond, C. P., Wilner, D. J., & Williams, J. P. 2009, ApJ, 704, 496
- Calvet & Hartmann (1992) Calvet, N., & Hartmann, L. 1992, ApJ, 386, 239
- Calvet et al. (1992) Calvet, N., Hartmann, L., & Hewett, R. 1992, ApJ, 386, 229
- Calvet et al. (1991) Calvet, N., Patino, A., Magris, G. C., & D’Alessio, P. 1991, ApJ, 380, 617
- Carr et al. (1993) Carr, J. S., Tokunaga, A. T., Najita, J., Shu, F. H., & Glassgold, A. E. 1993, ApJ, 411, L37
- Casey et al. (1998) Casey, B. W., Mathieu, R. D., Vaz, L. P. R., Andersen, J., & Suntzeff, N. B. 1998, AJ, 115, 1617
- Chelli et al. (1988) Chelli, A., Cruz-Gonzalez, I., Zinnecker, H., Carrasco, L., & Perrier, C. 1988, A&A, 207, 46
- Chen et al. (1995) Chen, H., Myers, P. C., Ladd, E. F., & Wood, D. O. S. 1995, ApJ, 445, 377
- Christy et al. (1983) Christy, J. W., Wellnitz, D. D., & Currie, D. G. 1983, Lowell Observatory Bulletin, 9, 28
- Coffey et al. (2008) Coffey, D., Bacciotti, F., & Podio, L. 2008, ApJ, 689, 1112
- Cuzzi et al. (1993) Cuzzi, J. N., Dobrovolskis, A. R., & Champney, J. M. 1993, Icarus, 106, 102
- Dullemond et al. (2001) Dullemond, C. P., Dominik, C., & Natta, A. 2001, ApJ, 560, 957
- Dullemond et al. (2007) Dullemond, C. P., Hollenbach, D., Kamp, I., & D’Alessio, P. 2007, Protostars and Planets V, 555
- Dzib et al. (2010) Dzib, S., Loinard, L., Mioduszewski, A. J., Boden, A. F., Rodriguez, L. F., & Torres, R. M. 2010, ArXiv e-prints
- Eisner et al. (2009) Eisner, J. A., Graham, J. R., Akeson, R. L., & Najita, J. 2009, ApJ, 692, 309
- Eisner et al. (2005) Eisner, J. A., Hillenbrand, L. A., White, R. J., Akeson, R. L., & Sargent, A. I. 2005, ApJ, 623, 952
- Folha & Emerson (2001) Folha, D. F. M., & Emerson, J. P. 2001, A&A, 365, 90
- Fujiwara et al. (2006) Fujiwara, H. et al. 2006, ApJ, 644, L133
- Fukagawa et al. (2006) Fukagawa, M., Tamura, M., Itoh, Y., Kudo, T., Imaeda, Y., Oasa, Y., Hayashi, S. S., & Hayashi, M. 2006, ApJ, 636, L153
- Gahm et al. (2005) Gahm, G. F., Petrov, P. P., & Stempels, H. C. 2005, in ESA Special Publication, Vol. 560, 13th Cambridge Workshop on Cool Stars, Stellar Systems and the Sun, ed. F. Favata, G. A. J. Hussain, & B. Battrick, 563–+
- Ghez et al. (1997) Ghez, A. M., McCarthy, D. W., Patience, J. L., & Beck, T. L. 1997, ApJ, 481, 378
- Gomez de Castro (1993) Gomez de Castro, A. I. 1993, ApJ, 412, L43
- Gorti & Hollenbach (2004) Gorti, U., & Hollenbach, D. 2004, ApJ, 613, 424
- Grady et al. (2009) Grady, C. A. et al. 2009, ApJ, 699, 1822
- Grinin & Mitskevich (1991) Grinin, V. P., & Mitskevich, A. S. 1991, Ap&SS, 185, 107
- Gullbring et al. (2000) Gullbring, E., Calvet, N., Muzerolle, J., & Hartmann, L. 2000, ApJ, 544, 927
- Haisch et al. (2001) Haisch, Jr., K. E., Lada, E. A., & Lada, C. J. 2001, ApJ, 553, L153
- Hartigan et al. (2004) Hartigan, P., Edwards, S., & Pierson, R. 2004, ApJ, 609, 261
- Hartmann et al. (1990) Hartmann, L., Avrett, E. H., Loeser, R., & Calvet, N. 1990, ApJ, 349, 168
- Hartmann et al. (2004) Hartmann, L., Hinkle, K., & Calvet, N. 2004, ApJ, 609, 906
- Herczeg & Hillenbrand (2008) Herczeg, G. J., & Hillenbrand, L. A. 2008, ApJ, 681, 594
- Herczeg et al. (2005) Herczeg, G. J. et al. 2005, AJ, 129, 2777
- Hessman & Guenther (1997) Hessman, F. V., & Guenther, E. W. 1997, A&A, 321, 497
- Hodapp et al. (2004) Hodapp, K. W., Walker, C. H., Reipurth, B., Wood, K., Bally, J., Whitney, B. A., & Connelley, M. 2004, ApJ, 601, L79
- Horne (1986) Horne, K. 1986, PASP, 98, 609
- Isella et al. (2009) Isella, A., Carpenter, J. M., & Sargent, A. I. 2009, ApJ, 701, 260
- Isella et al. (2008) Isella, A., Tatulli, E., Natta, A., & Testi, L. 2008, A&A, 483, L13
- Jensen et al. (2004) Jensen, E. L. N., Mathieu, R. D., Donar, A. X., & Dullighan, A. 2004, ApJ, 600, 789
- Johns-Krull & Gafford (2002) Johns-Krull, C. M., & Gafford, A. D. 2002, ApJ, 573, 685
- Jonkheid et al. (2004) Jonkheid, B., Faas, F. G. A., van Zadelhoff, G., & van Dishoeck, E. F. 2004, A&A, 428, 511
- Kamp & Dullemond (2004) Kamp, I., & Dullemond, C. P. 2004, ApJ, 615, 991
- Käufl et al. (2004) Käufl, H. et al. 2004, in Presented at the Society of Photo-Optical Instrumentation Engineers (SPIE) Conference, Vol. 5492, Society of Photo-Optical Instrumentation Engineers (SPIE) Conference Series, ed. A. F. M. Moorwood & M. Iye, 1218–1227
- Kenyon & Hartmann (1987) Kenyon, S. J., & Hartmann, L. 1987, ApJ, 323, 714
- Kessler-Silacci et al. (2006) Kessler-Silacci, J. et al. 2006, ApJ, 639, 275
- Knigge et al. (1995) Knigge, C., Woods, J. A., & Drew, J. E. 1995, MNRAS, 273, 225
- Koenigl (1991) Koenigl, A. 1991, ApJ, 370, L39
- Koerner et al. (1993) Koerner, D. W., Sargent, A. I., & Beckwith, S. V. W. 1993, Icarus, 106, 2
- Köhler et al. (2008) Köhler, R., Neuhäuser, R., Krämer, S., Leinert, C., Ott, T., & Eckart, A. 2008, A&A, 488, 997
- Konigl & Pudritz (2000) Konigl, A., & Pudritz, R. E. 2000, Protostars and Planets IV, 759
- Koresko (2002) Koresko, C. D. 2002, AJ, 124, 1082
- Krasnopolsky et al. (2003) Krasnopolsky, R., Li, Z., & Blandford, R. D. 2003, ApJ, 595, 631
- Kurosawa et al. (2006) Kurosawa, R., Harries, T. J., & Symington, N. H. 2006, MNRAS, 370, 580
- Loinard et al. (2008) Loinard, L., Torres, R. M., Mioduszewski, A. J., & Rodríguez, L. F. 2008, ApJ, 675, L29
- Mannings & Sargent (1997) Mannings, V., & Sargent, A. I. 1997, ApJ, 490, 792
- Marois et al. (2008) Marois, C., Macintosh, B., Barman, T., Zuckerman, B., Song, I., Patience, J., Lafrenière, D., & Doyon, R. 2008, Science, 322, 1348
- Martin (1997) Martin, S. C. 1997, ApJ, 478, L33+
- Meijer et al. (2008) Meijer, J., Dominik, C., de Koter, A., Dullemond, C. P., van Boekel, R., & Waters, L. B. F. M. 2008, A&A, 492, 451
- Meyer & Wilking (2009) Meyer, M. R., & Wilking, B. A. 2009, PASP, 121, 350
- Millan-Gabet et al. (1999) Millan-Gabet, R., Schloerb, F. P., Traub, W. A., Malbet, F., Berger, J. P., & Bregman, J. D. 1999, ApJ, 513, L131
- Monnier et al. (2006) Monnier, J. D. et al. 2006, ApJ, 647, 444
- Monnier & Millan-Gabet (2002) Monnier, J. D., & Millan-Gabet, R. 2002, ApJ, 579, 694
- Monnier et al. (2005) Monnier, J. D. et al. 2005, ApJ, 624, 832
- Mora et al. (2001) Mora, A. et al. 2001, A&A, 378, 116
- Muzerolle et al. (2010) Muzerolle, J., Allen, L. E., Megeath, S. T., Hernández, J., & Gutermuth, R. A. 2010, ApJ, 708, 1107
- Muzerolle et al. (2003) Muzerolle, J., Calvet, N., Hartmann, L., & D’Alessio, P. 2003, ApJ, 597, L149
- Muzerolle et al. (1998) Muzerolle, J., Hartmann, L., & Calvet, N. 1998, AJ, 116, 455
- Najita et al. (2003) Najita, J., Carr, J. S., & Mathieu, R. D. 2003, ApJ, 589, 931
- Natta et al. (2001) Natta, A., Prusti, T., Neri, R., Wooden, D., Grinin, V. P., & Mannings, V. 2001, A&A, 371, 186
- Natta et al. (2006) Natta, A., Testi, L., & Randich, S. 2006, A&A, 452, 245
- Neuhäuser et al. (2005) Neuhäuser, R., Guenther, E. W., Wuchterl, G., Mugrauer, M., Bedalov, A., & Hauschildt, P. H. 2005, A&A, 435, L13
- Pollack et al. (1996) Pollack, J. B., Hubickyj, O., Bodenheimer, P., Lissauer, J. J., Podolak, M., & Greenzweig, Y. 1996, Icarus, 124, 62
- Pontoppidan et al. (2008) Pontoppidan, K. M., Blake, G. A., van Dishoeck, E. F., Smette, A., Ireland, M. J., & Brown, J. 2008, ApJ, 684, 1323
- Pontoppidan & Dullemond (2005) Pontoppidan, K. M., & Dullemond, C. P. 2005, A&A, 435, 595
- Pontoppidan et al. (2007a) Pontoppidan, K. M., Dullemond, C. P., Blake, G. A., Boogert, A. C. A., van Dishoeck, E. F., Evans, II, N. J., Kessler-Silacci, J., & Lahuis, F. 2007a, ApJ, 656, 980
- Pontoppidan et al. (2007b) Pontoppidan, K. M., Dullemond, C. P., Blake, G. A., Evans, II, N. J., Geers, V. C., Harvey, P. M., & Spiesman, W. 2007b, ApJ, 656, 991
- Pontoppidan et al. (2009) Pontoppidan, K. M., Meijerink, R., Dullemond, C. P., & Blake, G. A. 2009, ApJ, 704, 1482
- Pontoppidan et al. (2010) Pontoppidan, K. M., Salyk, C., A., B. G., Carr, J. S., & Najita, J. 2010, ApJ, submitted
- Pontoppidan et al. (2011) Pontoppidan, K. M. et al. 2011, The Messenger, in press
- Prato et al. (2003) Prato, L., Greene, T. P., & Simon, M. 2003, ApJ, 584, 853
- Qi et al. (2008) Qi, C., Wilner, D. J., Aikawa, Y., Blake, G. A., & Hogerheijde, M. R. 2008, ApJ, 681, 1396
- Regály et al. (2010) Regály, Z., Sándor, Z., Dullemond, C. P., & van Boekel, R. 2010, A&A, 523, A69+
- Rodrigues et al. (2009) Rodrigues, C. V., Sartori, M. J., Gregorio-Hetem, J., & Magalhães, A. M. 2009, ApJ, 698, 2031
- Safier (1993) Safier, P. N. 1993, ApJ, 408, 115
- Salyk et al. (2007) Salyk, C., Blake, G. A., Boogert, A. C. A., & Brown, J. M. 2007, ApJ, 655, L105
- Salyk et al. (2009) —. 2009, ApJ, 699, 330
- Salyk et al. (2008) Salyk, C., Pontoppidan, K. M., Blake, G. A., Lahuis, F., van Dishoeck, E. F., & Evans, II, N. J. 2008, ApJ, 676, L49
- Schegerer et al. (2009) Schegerer, A. A., Wolf, S., Hummel, C. A., Quanz, S. P., & Richichi, A. 2009, A&A, 502, 367
- Seperuelo Duarte et al. (2008) Seperuelo Duarte, E., Alencar, S. H. P., Batalha, C., & Lopes, D. 2008, A&A, 489, 349
- Shu et al. (1994) Shu, F., Najita, J., Ostriker, E., Wilkin, F., Ruden, S., & Lizano, S. 1994, ApJ, 429, 781
- Siess et al. (2000) Siess, L., Dufour, E., & Forestini, M. 2000, A&A, 358, 593
- Smith et al. (1997) Smith, K. W., Bonnell, I. A., Lewis, G. F., & Bunclark, P. S. 1997, MNRAS, 289, 151
- Stempels & Piskunov (2002) Stempels, H. C., & Piskunov, N. 2002, A&A, 391, 595
- Straizys et al. (1996) Straizys, V., Cernis, K., & Bartasite, S. 1996, Baltic Astronomy, 5, 125
- Strom et al. (1989) Strom, K. M., Strom, S. E., Edwards, S., Cabrit, S., & Skrutskie, M. F. 1989, AJ, 97, 1451
- Takami et al. (2003) Takami, M., Bailey, J., & Chrysostomou, A. 2003, A&A, 397, 675
- Takami et al. (2001) Takami, M., Bailey, J., Gledhill, T. M., Chrysostomou, A., & Hough, J. H. 2001, MNRAS, 323, 177
- Tatulli et al. (2007) Tatulli, E. et al. 2007, A&A, 464, 55
- Tatulli et al. (2008) —. 2008, A&A, 489, 1151
- Thi et al. (2010) Thi, W. F. et al. 2010, ArXiv e-prints
- Torres et al. (2009) Torres, R. M., Loinard, L., Mioduszewski, A. J., & Rodríguez, L. F. 2009, ApJ, 698, 242
- van Boekel et al. (2005) van Boekel, R., Dullemond, C. P., & Dominik, C. 2005, A&A, 441, 563
- Visser et al. (2009) Visser, R., van Dishoeck, E. F., & Black, J. H. 2009, A&A, 503, 323
- Whelan & Garcia (2008) Whelan, E., & Garcia, P. 2008, in Lecture Notes in Physics, Berlin Springer Verlag, Vol. 742, Jets from Young Stars II, ed. F. Bacciotti, L. Testi, & E. Whelan, 123–+
- Whelan et al. (2004) Whelan, E. T., Ray, T. P., & Davis, C. J. 2004, A&A, 417, 247
- White & Ghez (2001) White, R. J., & Ghez, A. M. 2001, ApJ, 556, 265
Appendix A Notes on individual sources
A.1. Keplerian disks
LkHa 330
This transitional disks is one of the “cold disks” imaged at submillimeter wavelengths by Brown et al. (2009). The spectro-astrometry reveals a significantly smaller inclination angle (12) than that suggested by the ellipticity of the 850 m continuum image (42). The submillimeter image also shows that dust has been depleted within 50 AU, while we find that molecular gas persists at 4 AU, but not closer to the star. In many ways, this disk appears to be similar to that of another transition disk, SR 21, described in Pontoppidan et al. (2008).
GQ Lup
This star is probably best known for having a substellar companion, GQ Lup b (Neuhäuser et al., 2005), currently located due west of GQ Lup. The spectro-astrometry of the GQ Lup disk shows that it is oriented along the N-S axis and has a relatively high inclination of . It is not known whether GQ Lup b orbits in the disk plane, but if it does, the physical separation will be higher than the projected separation of 07 by a factor 2.4, bringing the physical separation to 240 AU. Further, the prediction is that any orbital motion of the companion will be along the N-S axis. It can be noted that the stellar inclination of GQ Lup has been found to be (Broeg et al., 2007) – very different than that of the disk, raising the question of whether this difference is due to interactions between the companion and the disk.
HD 142527
The disk around this borderline Herbig Ae/Be – T Tauri star (Spectral Type = F6) has been imaged in the continuum at near- to mid-infrared wavelengths. At mid-infrared wavelengths (18-25 m), the outer disk exhibits a strongly asymmetric structure, with the eastern side being much brighter than the western (Fujiwara et al., 2006). These authors suggested that the bright eastern arc being an illuminated rim of a disk inclined along a north-south axis. The spectro-astrometry, however, demonstrate that the actual axis of the (inner) disk is at a P.A.=293°. Near-infrared, scattered-light imaging by Fukagawa et al. (2006) find that the disk is elliptical along a major axis in the NW-SE direction, more consistent with the spectro-astrometric P.A. Further, at NIR wavelengths, the south-western part of the disk is brighter, indicating that this is the closer part of the disk, exhibiting strong forward scattering. The inclination angle of matches both the mid-infrared and near-infrared imaging.
HD 144432
RNO 90
While this G5 T Tauri star has featured prominently in studies of mid-infrared spectroscopic disk properties (Kessler-Silacci et al., 2006; Pontoppidan et al., 2010), little is known about the geometry of the disk. Using CO spectro-astrometry, it can be determined that the inclination is and that the major axis of the disk is oriented along the N-S axis with a P.A. = . There is no apparent inner gap in the CO emission, which can be traced to within 0.1 AU.
VV Ser
This Herbig Ae/Be star is known to have a prominent disk shadow (Hodapp et al., 2004; Pontoppidan & Dullemond, 2005). The disk orientation, P.A. and inclination was determined by Pontoppidan et al. (2007a, b) using the disk shadow in combination with near-infrared interferometric visibilities. The P.A. of Pontoppidan et al. (2007b) of can be compared to the spectro-astrometric P.A. of , while the disk shadow inclination of can be compared to the astrometric inclination of . It is important to note that the likely distance to the Serpens star forming cloud, of which VV Ser is a member, has been significantly revised from 260 pc (Straizys et al., 1996) to 410 pc (Dzib et al., 2010). The radius of the K-band continuum emission determined by Pontoppidan et al. (2007a) is then revised to 1.1 AU, in comparison to a CO emitting radius of AU.
A.1.1 Single-peaked line sources
DR Tau
DR Tau is a well-known high activity T Tauri star with a high degree of optical veiling (Hessman & Guenther, 1997) and spectral variability (Smith et al., 1997; Alencar et al., 2001). Near-infrared interferometry has provided an uncertain measure of the disk P.A.= (Akeson et al., 2005), consistent with our spectro-astrometry. Andrews & Williams (2007) finds a disk P.A., while Isella et al. (2009) finds a P.A.= and an inclination of 37°, using high resolution (sub)millimeter interferometry. Based on stellar measurements coupled with periodic variability, Muzerolle et al. (2003) finds a high stellar inclination of 69°. In summary, the basic geometry of the DR Tau disk is still uncertain, but the spectro-astrometry indicates an uncertain P.A. close to 0°and a low inclination.
RU Lup
RU Lup is a well-known classical T Tauri star with strong accretion signatures. Gahm et al. (2005) suggested that the star may have a close stellar companion due to the presence of periodical radial velocity changes, although the presence of starspots leading to the observed radial velocity signal is not ruled out (see discussion in Herczeg et al. (2005)). If the variability is due to starspots, a measurement of (Stempels & Piskunov, 2002) implies a nearly face-on orientation of the star, and presumably the disk as well, of (Herczeg et al., 2005). Takami et al. (2001) presented spectro-astrometry of the line and found evidence for a jet with a P.A.. The CO P.A. of is significantly different.
AS 205N
This star, also known as AS 205A, the primary of the close binary (separation 13) system known for exhibiting bright molecular emission from water and organics throughout the mid-infrared (Salyk et al., 2008). Since the CRIRES PSF has a width of 012, there is no contamination from the secondary. The central star has a late spectral type (K5) relative to its luminosity (4 ), resulting in a very young apparent age of (Andrews et al., 2009). A comparison to the disk geometry of Andrews et al. (2009), derived with high spatial resolution submillimeter interferometric continuum and line imaging with the SubMillimeter Array (SMA), is instructive. They find, using the dust continuum contours, an inclination of , which is consistent with the wind model requiring the disk to be nearly face-on. Their P.A. is different from that derived from the spectro-astrometry. While continuum isocontour fits can be uncertain for nearly face-on disks, spatially resolved SMA CO (3-2) images clearly show rotation consistent with a disk at P.A.165°. In contrast, the spectro-astrometry requires a P.A. of the AS 205N disk major axis. We suggest that the discrepancy could be explained if the rotation pattern seen in the rotational CO line is due to contamination from AS 205S; a scenario which is explicitly not ruled out by Andrews et al. (2009). If so, this implies an interesting configuration in which the orbit of the AS 205 binary is not coplanar with the AS 205N disk. Non-coplanarity has been observed as a general property of binaries with disks, although there is probably some alignment for disks around stars with separations between 200-1000 AU (Jensen et al., 2004).
S CrA N
S CrA is a binary. Our spectro-astrometry is of the northern component, the primary at near-infrared wavelengths, but the secondary in the visible. There is, to our knowledge, no other measurements of the disk geometry of this source in the literature.
A.1.2 Self-absorbed sources
CW Tau
DoAr 24E S
This is a binary, with the south-eastern component being an InfraRed Companion (IRC) (Chelli et al., 1988). Our spectro-astrometry is of the secondary (at K-band) southern component - this is the brighter, by about 0.7 magnitudes, component in the M-band. The secondary disk has P.A. of 11°as determined using K-band polarization (Jensen et al., 2004). The secondary is itself a possible close, equal brightness, binary with separation 5.6 mas and P.A.=44°(Koresko, 2002), based on speckle imaging. The presence of a close binary may explain the need for two wind components components in our spectro-astrometry, separated by about 15 at the time of observation. It should be noted that a match with a binary is not unambiguous, and other models of extended emission along a P.A.=44°are also possible.
T CrA
Bailey (1998); Takami et al. (2003) reported a binary companion, using spectro-astrometry of H, with a separation of and P.A.=278°. We do not detect a companion at m at this P.A. and separation with an upper limit of the flux ratio of 6. Speckle imaging at K-band also does not detect the companion (Ghez et al., 1997; Köhler et al., 2008). It is possible that the companion is significantly bluer than the primary, and we do not expect it to influence our spectro-astrometry.