On the connection of the apparent proper motion and the VLBI structure of compact radio sources
Abstract
Many of the compact extragalactic radio sources that are used as fiducial points to define the celestial reference frame are known to have proper motions detectable with long-term geodetic/astrometric Very Long Baseline Interferometry (VLBI) measurements. These changes can be as high as several hundred micro-arcseconds per year for certain objects. When imaged with VLBI at milli-arcsecond (mas) angular resolution, these sources (radio-loud active galactic nuclei) typically show structures dominated by a compact, often unresolved “core” and a one-sided “jet”.
The positional instability of compact radio sources is believed to be connected with changes in their brightness distribution structure. For the first time, we test this assumption in a statistical sense on a large sample, not only for individual objects. We investigate a sample of 62 radio sources for which reliable long-term time series of astrometric positions as well as detailed 8-GHz VLBI brightness distribution models are available. We compare the characteristic direction of their extended jet structure and the direction of their apparent proper motion.
We present our data and analysis method, and conclude that there is indeed a correlation between the two characteristic directions. However, there are cases where the -mas scale VLBI jet directions are significantly misaligned with respect to the apparent proper motion direction.
1 Introduction
The International Celestial Reference Frame (ICRF) is a quasi-inertial reference frame defined through the accurate radio positions of extragalactic sources (active nuclei of quasars, radio galaxies, and BL Lac objects) distributed over the sky. Its first realization (ICRF1; Ma et al., 1998) was based on the positions of 212 defining radio sources, using Very Long Baseline Interferometry (VLBI) measurements made between 1979 and 1995.
The continuous accumulation of new high-quality VLBI data, and technical, observing and data analysis improvements made it possible to define the ICRF2 (Fey et al., 2009) which was adopted by the International Astronomical Union (IAU) in 2009 as the current official realization of the celestial reference system. There are 295 defining sources selected for ICRF2, based on their positional stability and compact radio structure, as deduced from nearly three decades of VLBI monitoring. The ICRF2 catalog lists the coordinates of a total of 3414 extragalactic radio sources. The new solution is aligned with the ICRF1 to ensure continuity. The new reference frame contains the positions of more than 5 times as many sources, better distributed over the northern and southern hemispheres. Its accuracy is at least 5 times better than that of the ICRF1.
Due to the frequent observations in the framework of geodetic/astrometric VLBI programs, the positional accuracy of many of the reference sources is better than milli-arcseconds (mas) in both equatorial coordinates. It has long been known, however, that several of these sources show significant apparent proper motion on a scale up to 100 micro-arcseconds (as) per year (e.g. Feissel-Vernier, 2003). These systematic linear or non-linear variations in the position of some reference sources can lead to inaccuracies in the estimates of other parameters (e.g. Earth orientation parameters; MacMillan & Ma, 2007, and references therein).
The typical angular scale of mas of the emitting regions in these radio sources that can be studied with VLBI imaging at centimeter wavelengths is significantly larger than the formal precision of the position determination. Variations in the brightness distribution of quasars and radio galaxies are not rare events. It is a general assumption that in most cases the apparent proper motions are mainly due to this intrinsic structural evolution, e.g. motions of relativistic jet components away from the innermost regions of active galactic nuclei (AGNs). This hypothesis was confirmed for some individual objects. For example, a detailed analysis of 0923+392 (4C +39.25) showed that the apparent proper motion of the source is related to structure variations (Fey et al., 1997). The apparent proper motion of 2200+420 (BL Lac) was found to significantly decrease after structural corrections derived from source maps were applied to the data set (Charlot, 2002). In some cases, the proper motions of the quasars are not easily modeled by a linear function (Titov, 2007). These investigations implied that the positional instabilities can be explained by examining the variations of the source structure in these individual cases. However, the general hypothesis has not been evaluated on a larger sample yet.
If this model can be applied for most of the sources, then we can expect some correlation between the direction of the position change, and the typical direction of the source “core–jet” structure in the sky. The mas-scale radio structure of AGNs is dominantly one-sided. This is a consequence of relativistic beaming which enhances the radiation originating from the relativistic plasma outflow pointing towards the observer, close to the line of sight. At the same time, the receding side of the intrinsically symmetric jet is de-boosted and becomes practically invisible. The compact, often unresolved, flat-spectrum “core” one can usually see in VLBI images is in fact the base of the inner jet, characterized by an optical depth of . The absolute position of this “core” therefore depends on the observing frequency (e.g. Blandford & Königl, 1979; Lobanov, 1998; Kovalev et al., 2008). Even at a fixed frequency, positional changes are expected with time due to changes in the intrinsic physical (e.g. jet Lorentz factor, electron density) or geometric (viewing angle, jet precession) conditions within the innermost few parsecs of the AGN environments. These changes manifest themselves in brightness, spectral or polarisation variations, appearance, disappearance, enhancement or fading of optically thin VLBI “jet” components. These phenomena are detectable with high-resolution VLBI imaging typically over time scales of years or longer. Propagation effects (e.g. interstellar scattering) extrinsic to the compact sources could also lead to apparent structural or brightness modifications, down to sub-daily time scales (e.g. Wagner & Witzel, 1995). The changes could in principle affect the absolute position of the radio centroid of a radio-loud AGN which serves as a reference point in astrometric and geodetic VLBI observations.
Some systematic effects could contribute to the total magnitude of the apparent proper motion as estimated from geodetic VLBI data. One of them is the secular aberration drift caused by the Galactocentric acceleration of the Solar system barycenter. This acceleration (where is the orbital velocity due to rotation of the Solar system around the Galactic center, and is the Galactocentric distance) estimated as km s-2 ( = 254 km s-1, = 8.4 kpc, Reid et al., 2009) results in a secular aberration drift equal to 5.4 as/year. The effect of noncircular motion was found negligible (1 as/year) by Kopeikin & Makarov (2006).
Titov et al. (2011) detected the secular aberration drift in radio source proper motions as derived from 30 years of the geodetic VLBI observations. They found 6.41.5 as/year, which is consistent with the theoretical prediction. Thus, this effect should be removed from the apparent proper motion of individual radio sources for a fair comparison with astrophysical data.
In the present work, we compared the characteristic position angle of the core–jet structure of 62 radio sources derived from their multi-epoch VLBI structure maps with the direction of their apparent proper motion based on the coordinate time series of regular geodetic VLBI observations. The individual proper motions have been corrected for the secular aberration due to the rotation of the Solar system barycenter around the center of the Galaxy. The data sets and the data analysis are described in § 2. The results are presented in § 3. Implications of our results are discussed in § 4.
2 Data
2.1 Description of the apparent proper motion data
To derive the apparent proper motion of radio sources, we analyzed more than 5,000 geodetic VLBI sessions of the International VLBI Service for Geodesy and Astrometry (IVS, Schlüter & Behrend, 2007) data base since 1979 using the Calc 10.0/Solve 2010.05.21 geodetic VLBI analysis software package, developed and maintained at the NASA Goddard Space Flight Center. A more detailed description of the analysis configuration is given in Titov et al. (2011). Earth orientation parameters, station and radio source coordinates were estimated once per session. Tropospheric zenith delays and gradients were estimated at a higher rate. We used a loose constraint to tie the celestial reference frame to the ICRF2 (Fey et al., 2009) in order to prevent a spurious net rotation of a set of radio sources that could result in a fake orientation of the proper motion.
The above analysis configuration allowed us to obtain coordinate time series for all the observed radio sources. In these series, data points resulting from less than three good observations within a session were removed and outliers were eliminated so that the reduced is reasonably close to unity. Proper motions were then estimated for time series containing at least 10 points and longer than 10 years by weighted least-squares with weights taken as the inverse of the squared formal error. The final sample contains the proper motions of 593 sources.
The proper motions were freed from the secular aberration drift caused by the rotation of the Sun around the Galactic center. The contribution is given by Eqs. (3)–(4) of Titov et al. (2011) wherein the coefficients correspond to a vector of amplitude of 6.4 as/year directed toward and (, , ).
2.2 Description of the VLBI structure data
In order to determine the characteristic position angle of the core–jet structures in a large number of radio sources, and to monitor the variability of the typical jet directions, we used the database compiled by Piner et al. (2007, hereafter P07). This data set is based on the US Naval Observatory’s Radio Reference Frame Image Database, an ongoing program to image radio reference frame sources regularly. Piner et al. (2007) used the data series of 77 sources obtained at 8 GHz. They fitted Gaussian brightness distribution model components interactively to the visibility data on a source-by-source basis with the Caltech Difmap software (Shepherd et al., 1994). Their final database (see Table 3 in P07) includes the main parameters of the fitted components (e.g. the polar coordinates of the centers, the sizes and orientations of the major and minor axes, and the flux densities of the Gaussians) for each source at different epochs. All of the 77 sources in P07 can be found in the proper motion database as well. We note that 47 of them are ICRF2 defining sources, and thus are among the most stable and less prominently extended objects.
2.3 Data analysis
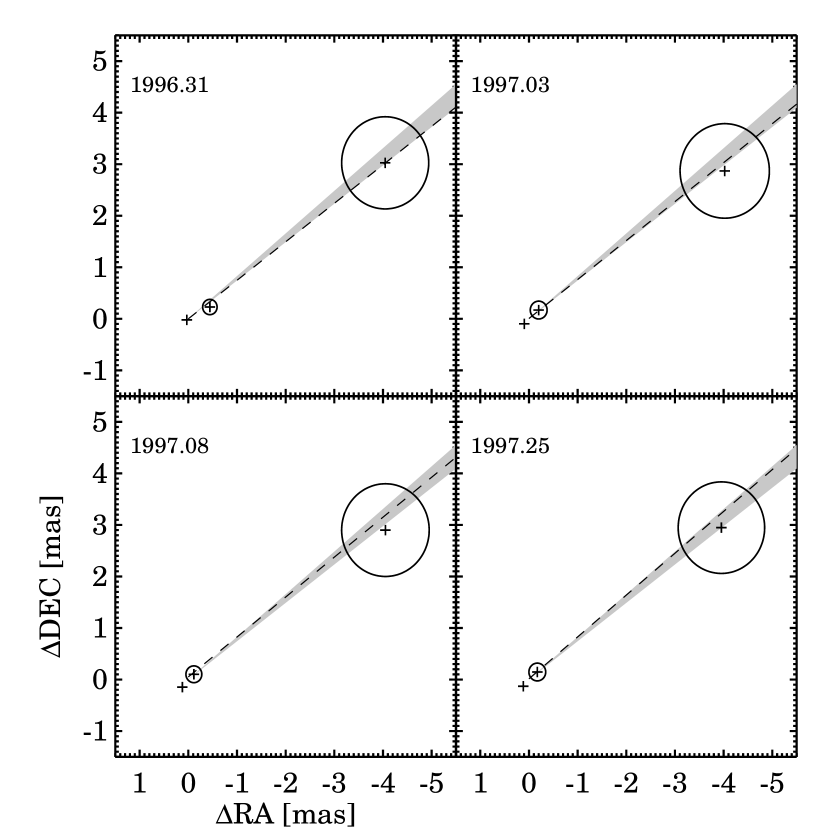
For the selected sources, the P07 database provides model brightness distributions at 3–19 different epochs over the years 1994–1998. We fitted a straight line to the positions of the components that describe a specific source using a weighted least-squares method. A position angle was calculated independently at each epoch. The fit was weighted by the flux densities of the individual emission features. Model components with ID=99 (Table 3 in P07) were not considered in our analysis, since these components could not be directly identified with model components that appear at other epochs in P07. The final characteristic core–jet direction () and its uncertainty () were computed as the average and the standard deviation of the position angles obtained at different epochs. Fig. 1 illustrates our fitting method for 0202+149.
The apparent proper motion values in right ascension and declination, and their uncertainties were transformed into polar coordinates, yielding four parameters for each source: the radial proper motion () and the position angle () with their uncertainties (, ). Sources with negligible apparent proper motions () were discarded from our sample and were not used in the further analysis. The derived parameters of the final selection of 62 sources are summarized in Table 1.
3 Results
The variations present in the apparent positions of AGNs are believed to be mainly caused by changes in the brightness distribution of the sources. According to this general picture, the direction of the apparent proper motion of a specific source should show correlation with the typical direction of the source core–jet structure in the sky. The multi-epoch VLBI structure maps offer a good opportunity to check whether the typical core–jet directions are stable in time for our sample. Both the real variations in the core–jet direction and the uncertainties of the fitted Gaussian models can contribute to the uncertainties of the derived position angles. For most of our sources, these values are relatively low (20), implying that the role of real variations may be negligible. Therefore in the further analysis we assumed that the derived directions are valid on longer time scales as well. The time span of the geodetic VLBI observations is up to five times longer than that of the structure maps analyzed in P07.
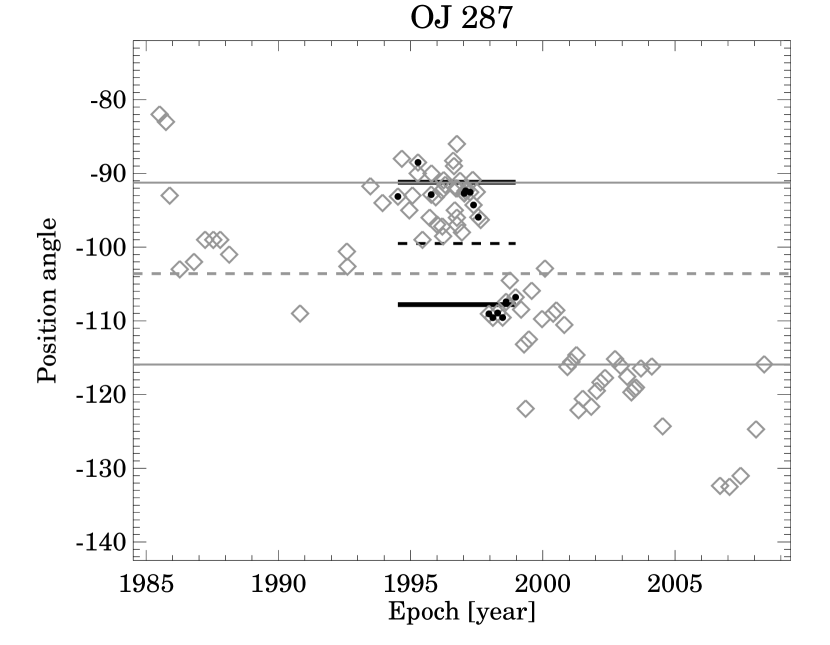
To verify our assumption, we studied an extreme example, the source OJ 287 (0851+202) in more detail. The blazar OJ 287 is known to have a rapidly changing inner radio jet structure (e.g. Tateyama & Kingham, 2004, and references therein) of which the kinematics could be revealed by frequent VLBI monitoring. We investigated the mas-scale jet direction in OJ 287, as defined by the component positions in 8-GHz VLBI imaging data, over a time interval much longer than covered by P07. To this end, we collected data from the literature (1985–1988, 1990–1996), and analyzed archival geodetic/astrometric VLBI visibility data (1994–2008). The total time range spanned is 24 years, comparable to the time range of the data from which the proper motion is estimated (§ 2.1).
A total of 59 epochs of 8-GHz Very Long Baseline Array (VLBA) data sets were taken from the VLBI database of compact radio sources111http://astrogeo.org/vlbi_images/, from 1994 to 2008. In comparison, P07 used data from 15 of these epochs, between 1994 and 1998. With the Difmap software, we model-fitted the calibrated interferometric visibilities at 40 additional epochs where sufficient data were available, adopting the same method used by P07. In addition, to extend the covered time interval backwards, we refer to Vicente et al. (1996) who analyzed 8-GHz geodetic VLBI observations at 10 epochs (jet component was detected in nine epochs) between 1985 and 1988. They explain the observed radio structure with a helical jet arising from a supermassive binary black hole system. A similar study by Tateyama et al. (1999) used 27 epochs between 1990 and 1996.
Fig. 2 shows the characteristic jet position angle of OJ 287 as a function of time. There is indeed a clear systematic change in this angle, quite consistent with the predictions of the ballistic precessing jet model of Tateyama & Kingham (2004). However, from the point of view of the present study, it is important to note that the jet always extends nearly to the west-southwest (position angles between about and ). Within the uncertainties, the characteristic core–jet direction () for OJ 287 we determined from the P07 data (§ 2.3) agrees with the average value over 24 years. In other words, our method of using only the 5-year P07 data is justified since it does not introduce a significant bias in the characteristic jet direction, even in the case of this peculiar radio source.
The changes in the brightness distribution of the radio sources could cause apparent positional variations in the opposite directions along the core–jet axis. In order to define a modulo 90 differential angle between the the two directions, we computed a angle for each object using the following formulae: () , if the difference between and is 90; () , if the angle between and is 90 and ; () , if the angle between and is 90 and . The differential angle () is therefore the smallest angle between the direction of the apparent proper motion and the axis defined by the core–jet structure. The derived parameters and their uncertainties are listed in the last column of Table 1.
3.1 General association between the characteristic directions
Since and are circular variables, the analysis of the possible association between them requires special methods. In order to test the hypothesis whether the two variables are independent, we performed a general test, following the procedures described in Fisher (1995). As a first step of this analyis, and were re-ordered to get data pairs of (),…,(), where are in cyclic order, and were determined as the rank of the corresponding values. Then we calculated
where
The total number of radio sources in the analysis was . The null hypothesis that and are independent can be rejected if is too large. In order to determine a critical value for , we performed a randomisation test (see also Fisher, 1995): () we added uniformly-distributed random numbers in the range of and to the position angles derived for the core–jet structures () and then re-calculated the value of ; () this treatment was repeated 1000 times, and the values obtained were compared with the original one. We found that the value of for our original sample is quite high: the test showed that the null hypothesis, that the two variables are independent, can be rejected at a level of 98.3%.
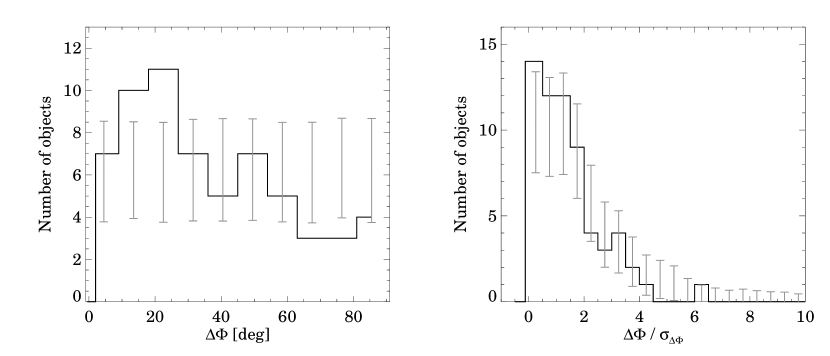
The distribution of the values is presented in Fig. 3 (left). The histogram shows a peak at low differential angles, which could be expected if there is correlation between the two directions. Using the results of the previous randomisation test, we also compiled the simulated distribution of (Fig. 3, left) and (Fig. 3, right) by averaging the results of the 1000 different runs in each bin. As Fig. 3 indicates, both distributions show an excess compared to the simulated distributions at their lower end. This finding also implies that there is an association between the two characteristic directions. For some sources this association seems to be very strong. The best examples were selected based on the following criteria: the differential angle between the two typical directions is , and . Two objects fall into this category, 0919-260 (catalog 0919-260) and 1156+295 (catalog 1156+295).
On the other hand, there are a couple of sources where the angle between the direction of the apparent proper motion and the axis defined by the core–jet structure is quite large. 0851+202 (catalog 0851+202) (OJ 287) is especially interesting from this point of view, since this object forms a clear outlier at in Fig. 3 (right) showing that its nearly orthogonal misalignment (see Table 1) is highly significant.
We note that the omission of the correction for the secular aberration in the calculation of proper motion data would not alter our main conclusion concerning the association between the two characteristic directions. To test this, we repeated the analysis using a data set derived without this correction. In that case, the null hypothesis could be rejected at a level of 99.5%. Before 1990, the general deficiency of the VLBI networks, including the number of observed sources and observing antennas per session, makes the VLBI products less reliable (see, e.g. Gontier et al., 2001; Malkin, 2004; Feissel-Vernier et al., 2004; Lambert & Gontier, 2009, who reported interesting statistical results and remarks about the VLBI evolution over the last two decades). In order to check the possible effect of these deficiencies on our findings, we repeated our analysis using a recompilation of the proper motion database without the geodetic data measured before 1990. We obtained a significance level of 96.6% for the rejection of the null hypothesis. It is in good agreement with the value derived utilizing the original data set.
4 Discussion
Based on our sample of 62 radio-loud AGNs, there is correlation between the direction of their apparent proper motion and the typical direction of their core–jet structure seen in cm-wavelength VLBI images. However, this does not necessarily mean that the proper motion is only influenced by changes in the source brightness structure. There exist individual objects where the apparent proper motion direction and the characteristic core–jet structure direction differ significantly.
In fact different angular scales are probed by the 8-GHz VLBI imaging and the astrometric position measurements. While the typical angular size of the core–jet structures we investigated is mas, the measured proper motion values are at most in the mas/year range. The characteristic inner jet direction could be different within the “core” that remains unresolved in the VLBI images at 8 GHz. In the extensive 15-GHz Monitoring Of Jets in Active Galactic Nuclei (MOJAVE) survey with the VLBA, Homan et al. (2009) found that jet components often change direction after ejection. The motion of about half of the 203 components they studied is significantly non-radial. These misalignments are typically within but can reach up to (Fig. 3 of Homan et al., 2009). Misalignments between the apparent jet position angles in compact extragalactic radio sources are well known at larger angular scales as well. The distribution of the misalignments of the mas-scale structures probed by VLBI, and the arcsecond-scale jets seen in the images made by the connected-element Very Large Array (VLA) interferometer shows a bimodal form, with peaks close to and (Conway & Murphy, 1993; Appl et al., 1996).
In our study, the nearly orthogonal misalignment found in 0851+202 (OJ 287) could possibly be explained with a similar effect, on a smaller angular scale. OJ 287 is a source known to have a precessing jet (Tateyama & Kingham, 2004, and references therein). Interestingly, the highest-resolution VLBI image available for OJ 287 (86 GHz, Lee et al., 2008) shows a hint on a as-scale weak extension to the compact unresolved core, close to the direction of the apparent proper motion measured for this source (; Table 1).
Proper motion directions could be more favorably compared with VLBI images made at an order of magnitude higher resolution. This can be achieved by decreasing the observing wavelength () and/or by using Space VLBI (SVLBI) to increase the length of the interferometer baselines (). (The angular resolution of an interferometer array is proportional to .) For example, a recent, and currently the most extended, global 86-GHz VLBI survey (Lee et al., 2008) contains single-epoch information on structural properties of more than 100 extragalactic radio sources at sub-mas scale. A practical complication is that the extended optically thin steep-spectrum features fade away at high frequencies. Therefore it may prove difficult to use the mm-VLBI images which are more dominated by a single “core” component to define a characteristic jet direction for a large sample of objects. The technique of SVLBI offers an increase in resolution in another way. It involves an antenna orbiting around the Earth which is co-observing with a ground-based radio telescope network. The recently canceled second-generation Japanese SVLBI mission ASTRO-G (Tsuboi, 2008) would have provided ground–space baselines that exceed the Earth diameter by a factor of .
It is possible that systematic effects other than changes in the source brightness distribution structure also affect the measured apparent proper motions. The estimated dipole and quadrupole harmonics in the pattern of the vector field of the proper motions in the sky (MacMillan, 2005; Titov, 2009, and references therein ) could in principle be interpreted in several ways: as a consequence of the galactocentric rotation of the Solar system (note that our proper motion data have already been corrected for the estimated amount of this systematic effect); as a result of an anisotropic Hubble expansion; as an indication of the primordial gravitational waves in the early Universe (Kristian & Sachs, 1966; Pyne et al., 1996; Gwinn et al., 1997; Sovers et al., 1998; MacMillan, 2005; Titov, 2009). Observationally establishing the magnitude of the all-sky systematic effects is complicated by the fact that the reference source distribution is uneven, especially in the southern hemisphere. For instance, correlation coefficients between the first and second degree spherical harmonics could reach 0.8–0.9 due to the paucity of the radio sources below declination (Titov & Malkin, 2009).
Gontier et al. (2001) suggest that at low declinations (), tropospheric mismodelling could lead to more uncertain position estimates, preferentially in the north–south direction. We could not detect any declination-dependent effect in the values of , maybe due to the small size of our sample.
In our analysis presented above, we assumed that the apparent proper motion of the sources can be represented by a linear change as a function of time. The VLBI position time series we used span nearly a quarter of a century for many of the objects. While the linear approximation is valid for most of the sources, the problem in general is clearly more complex. Physically, many of the sources could have undergone multiple jet component ejections over the time range studied. Although the position angle of the jet trajectories (the path of the subsequent components) could remain similar for a given source, these patterns in the jet flow may change their apparent speed. Indeed, there are a few AGNs known to show non-linear proper motions (e.g. Titov, 2007; Zharov et al., 2009). Coordinate time series for the most extreme cases are available in the ICRF2 document (Chapter 4, Fey et al., 2009). Therefore the linear fit applied here is not necessarily the best representation of their coordinate changes. This fact is reflected in the higher formal errors obtained for the fitted linear proper motion values for these sources. However, here we analysed the directions, and used the fitted absolute values of the apparent proper motion only to select the objects that show significant motion. Future extensions of our work could look for directional changes as well, since the apparent proper motions could follow curved paths. It would also be interesting to find a relation between the magnitude of the detected proper motions and the structural properties of AGNs.
5 Conclusions
We studied a sample of 62 compact extragalactic radio sources for which reliable long-term VLBI time series of astrometric positions as well as detailed 8-GHz VLBI brightness distribution models (Piner et al., 2007) were available (Table 1). We compared the direction of their apparent proper motion and the characteristic direction of their mas-scale radio jet structure. Earlier, for a number of individual sources, the observed astrometric proper motions have been found to be in a good agreement with the apparent motion of bright jet components in the mas-scale radio structure (e.g. 4C +39.25, Fey et al., 1997; Titov, 2007). However, the assumption that the apparent proper motions are closely related to changes in the radio brightness distribution has not yet been tested on a large sample of sources. With a statistical analysis, we found that there is a general correlation between the direction of proper motion and the characteristic direction of core–jet sources. However, there are some individual objects where this relationship does not hold. In particular, a nearly orthogonal misalignment was found in the case of OJ 287, a blazar with a known precessing jet. Our results imply that the apparent proper motion is in general influenced by the changes in the source brightness structure. This could be better verified in the future with higher-resolution mm-VLBI and/or Space VLBI imaging data.
References
- Appl et al. (1996) Appl, S., Sol, H., & Vicente, L. 1996, A&A, 310, 419
- Blandford & Königl (1979) Blandford, R.D., & Königl, A. 1979, ApJ, 232, 34
- Charlot (2002) Charlot, P. 2002, in International VLBI Service for Geodesy and Astrometry 2002 General Meeting Proceedings, NASA/CP-2002-210002, ed. N.R. Vandenberg, & K.D. Baver (Hanover, MD: NASA), 233
- Conway & Murphy (1993) Conway, J.E., & Murphy, D.W. 1993, ApJ, 411, 89
- Feissel-Vernier (2003) Feissel-Vernier, M. 2003, A&A, 403, 105
- Feissel-Vernier et al. (2004) Feissel-Vernier, M., Ray, J., Altamimi, Z., Dehant, V., & de Viron, O. 2004, in International VLBI Service for Geodesy and Astrometry 2004 General Meeting Proceedings, NASA/CP-2004-212255, ed. N.R. Vandenberg, & K.D. Baver (Hanover, MD: NASA), 22
- Fey et al. (1997) Fey, A.L., Eubanks, T.M., & Kingham, K.A. 1997, AJ, 114, 2284
- Fey et al. (2009) Fey, A.L., Gordon, D., & Jacobs, C.S. (eds.) 2009, The Second Realization of the International Celestial Reference Frame by Very Long Baseline Interferometry, IERS Technical Note 35 (Frankfurt am Main: Verlag des BKG)
- Fisher (1995) Fisher, N.I. 1995, Statistical analysis of circular data (Cambridge: Cambridge Univ. Press)
- Gontier et al. (2001) Gontier, A.-M., Le Bail, K., Feissel, M., & Eubanks, T. M. 2001, A&A, 375, 661
- Gwinn et al. (1997) Gwinn, C.R., Eubanks, T.M., Pyne, T., Birkinshaw, M., & Matsakis, D.N. 1997, ApJ, 485, 87
- Homan et al. (2009) Homan, D.C., Kadler, M., Kellermann, K.I., Kovalev , Y.Y., Lister, M.L., Ros, E., Savolainen, T., & Zensus, J.A. 2009, ApJ, 706, 1253
- Kopeikin & Makarov (2006) Kopeikin, S.M., & Makarov, V.V. 2006, AJ, 131, 1471
- Kovalev et al. (2008) Kovalev, Y.Y., Lobanov, A.P., Pushkarev, A.B., & Zensus, J.A. 2008, A&A, 483, 759
- Kristian & Sachs (1966) Kristian, J., & Sachs, R. K. 1966, ApJ, 143, 379
- Lambert & Gontier (2009) Lambert, S.B., & Gontier, A.-M. 2009, A&A, 493, 317
- Lee et al. (2008) Lee, S.-S., Lobanov, A.P., Krichbaum, T.P., Witzel, A., Zensus, A., Bremer, M., Greve, A., & Grewing, M. 2008, AJ, 136, 159
- Lobanov (1998) Lobanov, A.P. 1998, A&A, 330, 79
- Ma et al. (1998) Ma, C., et al. 1998, AJ, 116, 516
- MacMillan (2005) MacMillan, D.S. 2005, in Future Directions in High Resolution Astronomy: The 10th Anniversary of the VLBA, ed. J.D. Romney, & M.J. Reid, ASP Conf. Ser., 340, 477
- MacMillan & Ma (2007) MacMillan, D.S., & Ma, C. 2007, J. Geod., 81, 443
- Malkin (2004) Malkin, Z. 2004, in International VLBI Service for Geodesy and Astrometry 2004 General Meeting Proceedings, NASA/CP-2004-212255, ed. N.R. Vandenberg, & K.D. Baver (Hanover, MD: NASA), 47
- Piner et al. (2007) Piner, B.G., Mahmud, M., Fey, A.L., & Gospodinova, K. 2007, AJ, 133, 2357 (P07)
- Pyne et al. (1996) Pyne, T., Gwinn, C.R., Birkinshaw, M., Eubanks, T.M., & Matsakis, D.N. 1996, ApJ, 465, 566
- Reid et al. (2009) Reid, M.J., et al. 2009, ApJ, 700, 137
- Schlüter & Behrend (2007) Schlüter, W., & Behrend, D. 2007, J. Geod., 81, 379
- Shepherd et al. (1994) Shepherd, M.C., Pearson, T.J., & Taylor, G.B. 1994, BAAS, 26, 987
- Sovers et al. (1998) Sovers, O.J., Fanselow, J.L., & Jacobs, C.S. 1998, Rev. Mod. Phys., 70, 1393
- Tateyama & Kingham (2004) Tateyama, C.E., & Kingham, K.A. 2004, ApJ, 608, 149
- Tateyama et al. (1999) Tateyama, C.E., Kingham, K.A., Kaufmann, P., Piner, B.G., Botti, L.C.L., & de Lucena, A.M.P. 1999, ApJ, 520, 627
- Titov (2007) Titov, O.A. 2007, Astron. Lett., 33, 481
- Titov (2009) Titov, O. 2009, in Proc. 19th European VLBI for Geodesy and Astrometry Working Meeting, ed. G. Bourda, P. Charlot, & A. Collioud (Bordeaux: Université Bordeaux 1), 14
- Titov (2010) Titov, O. 2010, MNRAS, 407, L46
- Titov et al. (2011) Titov, O., Lambert, S. B., & Gontier, A.-M. 2011, A&A, accepted (arXiv:1009.3698)
- Titov & Malkin (2009) Titov, O., & Malkin, Z. 2009, A&A, 506, 1477
- Tsuboi (2008) Tsuboi, M. 2008, Proc. SPIE, 7010, 701024
- Véron-Cetty & Véron (2003) Véron-Cetty, M.-P., & Véron, P. 2003, A&A, 412, 399
- Vicente et al. (1996) Vicente, L., Charlot, P., & Sol, H. 1996, A&A, 312, 727
- Wagner & Witzel (1995) Wagner, S.J., & Witzel, A. 1995, ARA&A, 33, 163
- Zharov et al. (2009) Zharov, V.E., Sazhin, M.V., Sementsov, V.N., Kuimov, K.V. & Sazhina, O.S. 2009, Astron. Rep., 53, 579
| Basic properties | Structure maps | Geodetic VLBI observations | |||||||
|---|---|---|---|---|---|---|---|---|---|
| Name | Class | ||||||||
| () | (as/year) | () | () | ||||||
| 0003066 | B | 0.35 | 0 | 68.04.6 | 11 | 21.310.9 | 24.320.3 | 1226 | 43.620.8 |
| 0104408 | Q | 0.58 | 2 | 25.811.4 | 7 | 8.78.0 | 51.253.8 | 940 | 25.455.0 |
| 0111021 | B | 0.05 | 0 | 131.64.3 | 8 | 41.022.5 | 123.332.8 | 178 | 8.333.1 |
| 0119041 | Q(HP) | 0.64 | 0 | 96.12.3 | 14 | 14.66.0 | 90.240.6 | 1554 | 6.340.6 |
| 0119115 | Q(HP) | 0.57 | 2 | 5.91.4 | 12 | 15.210.0 | 18.624.8 | 1112 | 12.724.8 |
| 0133476 | Q(HP) | 0.86 | 3 | 28.26.2 | 13 | 4.94.6 | 42.453.2 | 1466 | 14.253.6 |
| 0202149 | G | 0.41 | 0 | 51.91.5 | 13 | 48.17.4 | 23.56.7 | 972 | 28.36.8 |
| 0229131 | Q | 2.06 | 2 | 37.53.1 | 14 | 16.85.7 | 31.916.4 | 2413 | 5.616.7 |
| 0234285 | Q(HP) | 1.21 | 2 | 11.70.5 | 13 | 14.68.8 | 55.945.2 | 1215 | 44.245.2 |
| 0336019 | Q(HP) | 0.85 | 0 | 69.22.2 | 13 | 10.25.3 | 117.136.0 | 1918 | 6.436.0 |
| 0402362 | Q | 1.42 | 2 | 22.62.8 | 6 | 33.714.4 | 175.117.3 | 553 | 17.617.5 |
| 0528134 | Q | 2.06 | 0 | 45.612.4 | 14 | 14.63.1 | 77.918.4 | 3302 | 32.322.2 |
| 0537441 | Q(HP) | 0.89 | 2 | 58.134.8 | 8 | 11.37.4 | 11.330.5 | 1148 | 46.946.3 |
| 0552398 | Q | 2.37 | 2 | 71.11.3 | 18 | 10.92.8 | 124.016.5 | 4304 | 15.116.5 |
| 0642449 | Q | 3.40 | 3 | 95.01.4 | 11 | 23.35.5 | 82.716.0 | 1305 | 12.316.0 |
| 0727115 | Q | 1.59 | 2 | 64.831.2 | 17 | 11.43.1 | 93.821.9 | 3457 | 21.438.1 |
| 0742103 | G | 2.62 | 0 | 7.14.0 | 9 | 35.221.5 | 76.453.8 | 325 | 69.354.0 |
| 0804499 | Q(HP) | 1.43 | 3 | 133.88.9 | 13 | 8.86.0 | 87.944.5 | 1373 | 45.945.4 |
| 0805410 | Q | 1.42 | 3 | 33.89.1 | 3 | 24.110.8 | 17.422.5 | 573 | 16.424.3 |
| 0851202 | B | 0.31 | 2 | 99.58.3 | 15 | 14.53.5 | 15.610.1 | 3599 | 84.013.1 |
| 0919260 | Q | 2.30 | 0 | 86.46.4 | 12 | 93.527.6 | 84.520.4 | 409 | 1.921.4 |
| 0920397 | Q | 0.59 | 2 | 179.83.0 | 7 | 66.530.8 | 171.321.7 | 150 | 8.522.0 |
| 0923392 | Q | 0.70 | 0 | 80.03.3 | 14 | 30.73.1 | 124.76.2 | 3898 | 24.77.0 |
| 0953254 | Q | 0.71 | 0 | 130.50.6 | 5 | 30.09.4 | 20.114.4 | 974 | 29.314.4 |
| 0955476 | Q | 1.87 | 3 | 137.711.3 | 14 | 5.35.0 | 128.055.7 | 2033 | 85.756.8 |
| 1004141 | Q | 2.71 | 0 | 129.90.1 | 9 | 29.617.8 | 117.438.7 | 265 | 12.538.7 |
| 1034293 | Q(HP) | 0.31 | 2 | 126.510.6 | 11 | 28.66.8 | 137.213.5 | 1654 | 10.617.1 |
| 1044719 | Q | 1.15 | 0 | 66.420.4 | 8 | 27.06.1 | 6.712.4 | 1220 | 73.123.9 |
| 1101384 | B | 0.03 | 2 | 37.73.5 | 11 | 36.015.6 | 154.524.8 | 420 | 12.225.0 |
| 1124186 | Q | 1.05 | 2 | 148.324.8 | 11 | 10.39.0 | 166.638.7 | 1142 | 18.446.0 |
| 1128385 | Q | 1.73 | 3 | 163.15.4 | 15 | 10.06.1 | 110.740.1 | 1290 | 86.240.5 |
| 1145071 | Q | 1.34 | 2 | 71.62.4 | 12 | 37.817.9 | 25.324.1 | 148 | 46.324.2 |
| 1156295 | Q(HP) | 0.73 | 2 | 7.66.9 | 12 | 12.78.3 | 174.525.7 | 1289 | 2.226.6 |
| 1219044 | Q | 0.97 | 3 | 174.53.6 | 11 | 19.06.4 | 71.928.0 | 1204 | 77.428.2 |
| 1228126 | G | 0.004 | 0 | 77.62.9 | 12 | 8.78.5 | 174.444.3 | 1235 | 72.044.4 |
| 1253055 | Q(HP) | 0.54 | 0 | 113.91.3 | 3 | 273.427.8 | 88.29.6 | 258 | 22.19.7 |
| 1255316 | Q | 1.92 | 0 | 21.90.1 | 5 | 51.923.8 | 110.729.0 | 418 | 88.829.0 |
| 1313333 | Q | 1.21 | 2 | 85.318.3 | 11 | 29.822.9 | 141.644.2 | 193 | 56.347.8 |
| 1334127 | Q(HP) | 0.54 | 2 | 153.70.9 | 11 | 10.94.8 | 135.824.8 | 2767 | 70.524.8 |
| 1351018 | Q | 3.71 | 2 | 138.87.9 | 6 | 35.813.4 | 11.913.0 | 832 | 53.115.2 |
| 1418546 | B | 0.15 | 3 | 130.22.8 | 8 | 6.25.9 | 117.257.4 | 817 | 67.557.5 |
| 1424418 | Q(HP) | 1.52 | 2 | 104.551.3 | 7 | 13.811.2 | 146.342.7 | 792 | 41.966.7 |
| 1514241 | B | 0.05 | 0 | 158.51.8 | 11 | 40.436.0 | 25.441.7 | 248 | 46.941.8 |
| 1606106 | Q | 1.23 | 3 | 58.93.0 | 14 | 12.45.6 | 175.218.0 | 2390 | 54.118.3 |
| 1611343 | Q | 1.40 | 0 | 169.42.1 | 12 | 25.54.9 | 159.28.4 | 1934 | 31.48.7 |
| 1622253 | Q | 0.79 | 2 | 13.316.0 | 11 | 20.38.3 | 153.718.5 | 1970 | 39.624.5 |
| 1638398 | Q(HP) | 1.66 | 2 | 175.413.2 | 14 | 9.69.2 | 21.839.8 | 1198 | 26.441.9 |
| 1726455 | Q | 0.72 | 3 | 91.813.4 | 10 | 12.38.6 | 59.843.5 | 1302 | 32.045.5 |
| 1741038 | Q(HP) | 1.05 | 2 | 171.610.3 | 13 | 4.44.4 | 178.338.9 | 3551 | 10.140.2 |
| 1745624 | Q | 3.89 | 3 | 147.21.7 | 12 | 19.38.2 | 51.625.0 | 820 | 18.825.1 |
| 1749096 | Q(HP) | 0.32 | 2 | 32.38.8 | 17 | 5.14.7 | 166.537.1 | 2792 | 18.738.2 |
| 1803784 | Q(HP) | 0.68 | 2 | 99.12.8 | 12 | 9.93.4 | 79.320.5 | 2449 | 19.820.7 |
| 1908201 | Q | 1.12 | 2 | 33.11.4 | 11 | 19.818.7 | 164.834.9 | 752 | 48.334.9 |
| 1921293 | Q(HP) | 0.35 | 2 | 27.45.1 | 14 | 22.67.6 | 27.516.1 | 1743 | 54.916.9 |
| 1958179 | Q(HP) | 0.65 | 2 | 133.636.9 | 3 | 18.36.5 | 93.320.2 | 1341 | 46.942.1 |
| 2136141 | Q | 2.43 | 3 | 119.213.5 | 8 | 16.28.1 | 122.232.1 | 1031 | 61.434.8 |
| 2145067 | Q | 0.99 | 1 | 130.03.1 | 19 | 26.45.7 | 29.110.6 | 2217 | 20.911.1 |
| 2200420 | B | 0.07 | 0 | 169.15.2 | 12 | 20.46.6 | 16.115.8 | 1026 | 27.016.6 |
| 2230114 | Q(HP) | 1.04 | 0 | 157.81.4 | 6 | 29.413.1 | 129.726.8 | 175 | 28.126.8 |
| 2234282 | Q(HP) | 0.80 | 0 | 132.211.2 | 12 | 31.04.2 | 112.09.0 | 2271 | 20.114.4 |
| 2243123 | Q(HP) | 0.63 | 0 | 1.76.4 | 12 | 17.57.5 | 119.332.2 | 971 | 62.432.9 |
| 2255282 | Q | 0.93 | 2 | 136.42.1 | 9 | 17.510.0 | 177.823.8 | 1398 | 41.423.9 |
Note. — Col.(1): Name of the radio source derived from B1950 equatorial coordinates. Col.(2): Optical class of the source. B = BL Lac object, Q = quasar, G = galaxy, HP refers to high polarization. The class information was taken from Véron-Cetty & Véron (2003). Col.(3): Redshift values (adopted from Piner et al., 2007). Col.(4): Shows whether the specific object is a defining source of the ICRF1/ICRF2. =1 and 2 mark ICRF1 and ICRF2 defining sources, respectively. =3 indicates sources that are defining objects in both ICRF1 and ICRF2. Col.(5): Position angle of the final characteristic core–jet direction () and its uncertainty (). Position angle is measured in degrees from north through east. Col.(6): Number of observations used to compute . Col.(7): Radial component of the apparent proper motion () and its uncertainty () in as/year. Col.(8): Position angle of the apparent proper motion () and its uncertainty () in degrees. Col.(9): Number of observations used to compute . Col.(10): The smallest angle between the direction of the apparent proper motion and the characteristic core–jet direction in degrees.