Extremely broad radio recombination maser lines toward the high-velocity ionized jet in Cepheus A HW2
Abstract
We present the first detection of the H40, H34 and H31 radio recombination lines (RRLs) at millimeter wavelengths toward the high-velocity, ionized jet in the Cepheus A HW2 star forming region. From our single-dish and interferometric observations, we find that the measured RRLs show extremely broad asymmetric line profiles with zero-intensity linewidths of 1100 km s-1. From the linewidths, we estimate a terminal velocity for the ionized gas in the jet of 500 km s-1, consistent with that obtained from the proper motions of the HW2 radio jet. The total integrated line-to-continuum flux ratios of the H40, H34 and H31 lines are 43, 229 and 280 km s-1, clearly deviating from LTE predictions. These ratios are very similar to those observed for the RRL maser toward MWC349A, suggesting that the intensities of the RRLs toward HW2 are affected by maser emission. Our radiative transfer modeling of the RRLs shows that their asymmetric profiles could be explained by maser emission arising from a bi-conical radio jet with a semi-aperture angle of 18∘, electron density distribution varying as r-2.11 and turbulent and expanding wind velocities of 60 and 500 km s-1.
Subject headings:
stars: formation — masers — ISM: individual (Cepheus A) — ISM: jets and outflows1. Introduction
Radio recombination lines (RRLs) are excellent probes of the kinematics of the ionized gas in ultracompact (UC) HII regions (Garay, 1989; Churchwell et al., 1989). These lines typically show simple Gaussian profiles with linewidths of 25-30 km s-1, attributed to unresolved gas motions and/or pressure broadening (Gaume et al., 1995; Afflerbach et al., 1996; Keto et al., 2008).
In addition to the classical UC HII regions with simple narrow (30 km s-1) Gaussian RRLs, Jaffe & Martín-Pintado (1999) reported that 30% of the observed UC HII regions show even broader RRL emission with linewidths of 70-200 km s-1. These sources have power law continuum spectra with spectral indeces 0.6 (characteristic of constant velocity stellar winds; Olnon, 1975), and elongated/bipolar morphologies resembling ionized flows. Jaffe & Martín-Pintado (1999) proposed that broad RRL emission could arise from bipolar ionized winds generated in photo-evaporating neutral disks (Hollenbach et al., 1994; Gorti & Hollenbach, 2009).
MWC349A is the best studied object with broad H recombination lines at optical, IR, centimeter and millimeter wavelengths (Hartmann, Jaffe & Huchra, 1980; Hamann & Simon, 1986; Altenhoff, Strittmatter & Wendker, 1981; Martín-Pintado et al., 1989). This source, which has a rotating edge-on disk with a bipolar ionized flow (Cohen et al., 1985), is unique in its category because its RRLs at 2 mm (quantum numbers n35) are masers (optical depths -1; Martín-Pintado et al., 1989, 1994). The RRL maser spots are located on the ionized surface of the disk (Planesas, Martín-Pintado & Serabyn, 1992; Weintroub et al., 2008; Martín-Pintado et al., 2011), where the densities of the ionized gas are high enough (106 cm-3) to invert the population of the levels involved in the RRL (Walmsley, 1990). Although these masers are expected to be found in other UC HII regions (Martín-Pintado, 2002), MWC349 is the only object where this emission has been reported so far in star forming regions.
We present the first detection of RRL maser emission toward the Cepheus A HW2 high-mass star forming region. This source shows a collimated, high-velocity ionized jet, with a continuum spectral index 0.6 (Rodríguez et al., 1994). Like MWC349A, the molecular material around HW2 is mainly distributed in a neutral circumstellar disk (Patel et al., 2005; Jiménez-Serra et al., 2009) that seems to be photo-evaporating (Jiménez-Serra et al., 2007). The proper motions of the HW2 radio jet suggest an expanding velocity for the outflowing gas of 500 km s-1 (Curiel et al., 2006). This is consistent with the extremely broad line profiles (zero-intensity linewidths of 1100 km s-1) of the H40, H34 and H31 maser lines detected in our single-dish and interferometric observations. Cepheus A HW2 is the second RRL maser object detected to date in star forming regions.
2. Observations
The H40 line at 99 GHz was observed toward Cepheus A HW2 with the IRAM Plateau de Bure Interferometer (PdBI) in the D configuration (beam of 5.0′′4.5′′, P.A.=91∘)111Based on observations carried out with the IRAM 30 m and Plateau de Bure Interferometer. IRAM is supported by INSU/CNRS (France), MPG (Germany) and IGN (Spain). The phase center was set at =22h56m17.98s, =+62∘01′49.5′′. The wide-band correlator WideX provided a continuous frequency coverage of 3.6 GHz, and a spectral resolution of 1.95 MHz (i.e. a velocity coverage and resolution of 10900 km s-1 and 6 km s-1, respectively). 3C454.3 (23 Jy) and 3C273 (12 Jy) were used as bandpass calibrators. We observed MWC349 (1.2 Jy) and 1749+096 (2 Jy) as flux calibrators, and 0016+731 (0.6 Jy) and 2146+608 (0.3 Jy), as phase calibrators. Data reduction, calibration, imaging and cleaning were performed with the GILDAS software222See http://www.iram.fr/IRAMFR/GILDAS..
The H34 line at 160 GHz, was detected toward HW2 with the IRAM 30 m telescope in a single-pointing observation during 140 min. The EMIR E1 receiver was tuned to single sideband (SSB) with rejection of 10 dB. The beam size was 15′′. The wide-band auto-correlator WILMA provided a total bandwidth and spectral resolution of 4 GHz and 2 MHz (6700 km s-1 and 3.7 km s-1, respectively). Typical system temperatures were 200-225 K. Intensities were calibrated in , and converted into total flux (Jy) by using =6.4 Jy/K 333See http://www.iram.es/IRAMES/mainWiki/Iram30mEfficiencies..
The H31 line at 210 GHz was imaged toward HW2 with the Submillimeter Array (SMA) in the subcompact configuration (beam of 4.8′′3.8′′, P.A.=21∘)444The Submillimeter Array is a joint project between the Smithsonian Astrophysical Observatory and the Academia Sinica Institute of Astronomy and Astrophysics and is funded by the Smithsonian Institution and the Academia Sinica.. The correlator setup provided a total bandwidth of 4 GHz per side-band, and a spectral resolution of 0.8 MHz. This corresponds to a velocity coverage of 5700 km s-1 and a velocity resolution of 1.1 km s-1. 3c279 was used as bandpass calibrator; MWC349, as flux calibrator (1.8 Jy); and 0102+584 (1.1 Jy) and BLLAC (5 Jy), as gain calibrators. Data calibration was performed within the MIR IDL package, while imaging and cleaning was done with MIRIAD.
3. Results
| RRL | (MHz) | (mm) | (Jy) | (km s-1) | (km s-1) | (Jy km s-1) | (Jy)aaTotal continuum (dust + free-free) emission flux measured toward HW2. | (Jy)bbFree-free continuum flux obtained by assuming a spectral index of 0.6, as derived from the VLA data of Rodríguez et al. (1994). | |
|---|---|---|---|---|---|---|---|---|---|
| H40 | 99022.96 | 3.0 | B | 0.0029 (0.0010)ccThe error in the RRL peak intensity corresponds to the 1 noise level in the spectra (1 mJy, 9 mJy and 6 mJy for the H40, H34 and H31 RRLs respectively; see lower panels in Figure 1). | 210 | 620 | 1.9 (0.1)ddThe error in the integrated intensity flux of the RRLs is calculated as =1, with the velocity resolution of 15-17 km s-1 in the RRL spectra (see Section 3), and the linewidth derived in the Gaussian fit (Column 7 in this Table). | 0.12 | 0.059 |
| R | 0.0034 (0.0010) | 368 | 190 | 0.68 (0.05) | |||||
| H34 | 160211.52 | 1.9 | B | 0.033 (0.009) | 60 | 410 | 14.4 (0.7) | 0.37eeDerived from the continuum flux measured with the PdBI and SMA at 3 mm and 1.4 mm . | 0.082 |
| R | 0.024 (0.009) | 400 | 180 | 4.4 (0.5) | |||||
| H31 | 210501.77 | 1.4 | B | 0.055 (0.006) | 36 | 313 | 18.5 (0.4) | 0.69 | 0.099 |
| R | 0.035 (0.006) | 316 | 240 | 8.9 (0.4) |
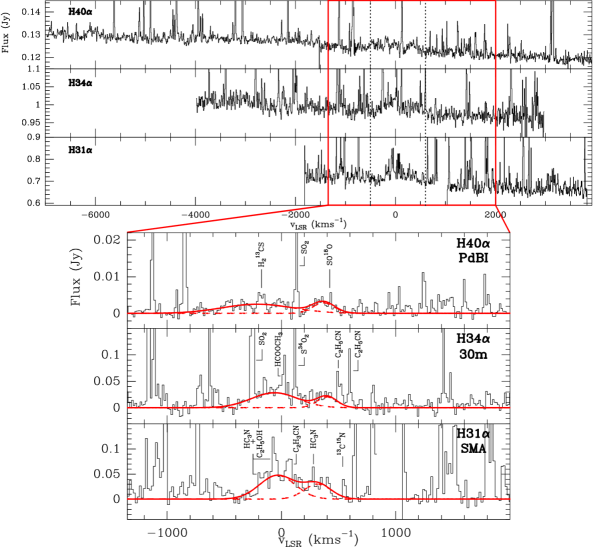
In Figure 1 (upper panels), we present the full spectra measured toward Cepheus A HW2 at the wavelengths of the H40, H34 and H31 RRLs, and smoothed to a velocity resolution of 6 km s-1. Since the HW2 radio jet is unresolved in the PdBI and SMA images (size of 2′′; Rodríguez et al., 1994; Curiel et al., 2006), the H40 and H31 spectra were averaged within the 5-beam of the PdBI and SMA observations. The measured RRL spectra (Figure 1) show three different features: i) a strong slope due to the increase of the dust continuum emission with frequency (); ii) a forest of narrow molecular lines arising mainly from the HC source in HW2 (Martín-Pintado et al., 2005; Jiménez-Serra et al., 2009); and iii) three faint and extremely broad features extending in velocity from -500 km s-1 to 600 km s-1 (zero-intensity linewidths of 1100 km s-1).
From the slope in the RRL spectra, we derive spectral indeces for the continuum emission of 2, consistent with that calculated by Comito et al. (2007). The PdBI and SMA indeces were obtained after subtracting the SEDs of the bandpass calibrators 3C454.3, 3C273 and 3C279. The derived continuum (dust+free-free) level at the frequencies of the H40 and H31 RRLs is 0.12 and 0.69 Jy, respectively. For the H34 line, this level was affected by an anomalous diffraction within the E1 receiver, although this did not affect the observed continuum slope and molecular line flux. The 2 mm continuum level (0.37 Jy) is estimated from the measured 3 mm and 1.4 mm continuum fluxes (Column 9 in Table 1).
From Figure 1, it is clear that molecular line confusion becomes an issue in this kind of studies, since multiple line blending could generate broad features mimicing broad emission from RRLs. Molecular lines from species such as SO2, C2H5CN, HC3N or C2H5OH are indentified at frequencies close to the RRLs (lower panels in Figure 1). However, their linewidths are narrow (4-8 km s-1), and the resulting blending features do not exceed 100 km s-1. Note that other blending features are also found across the RRLs spectral bands, with similar widths. It is then unlikely that line blending is resposible for the extremely broad emission, with zero-intensity linewidths of 1100 km s-1, detected toward Cepheus A HW2. The probability to detect three similar (and extremely broad) features as a result of line confusion at three different frequency ranges, is also very small. We thus conclude that these features are likely associated with the emission of the H40, H34 and H31 RRLs, formed in the high-velocity HW2 ionized jet (Section 5).
Figure 1 (lower panels) shows a zoom-in of the continuum-subtracted RRL spectra, smoothed to a velocity resolution of 15-17 km s-1. The continuum emission was subtracted by fitting a polynomial function of order 1.
Although less clear for the H40 line, the extremely broad RRL profiles are asymmetric and have a similar kinematical structure with two broad (red- and blue-shifted) velocity components. The two-component Gaussian fits of this emission are shown in Figure 1 (see solid and dashed lines). The derived parameters for the red- (R) and blue-shifted (B) components are given in Table 1.
Table 1 also reports the contribution from only the free-free continuum emission at 3, 1.9 and 1.4 mm (Column 10), derived by extrapolating the HW2 fluxes at centimeter wavelengths and by assuming an spectral index 0.6 (Rodríguez et al., 1994). These values, however, should be considered as upper limits since the actual free-free emission at millimeter wavelengths could be smaller than reported in Table 1 (Comito et al., 2007). If overestimated, these fluxes would imply an even stronger maser amplification effect for the observed RRLs (Section 4).
The derived integrated intensities of the RRLs lie above the 9 level (Column 8), with the integrated intensity error in the spectra (see caption in Table 1). The derived peak and integrated intensities not only show a systematic trend to increase for increasing frequency (or decreasing quantum number n) for both velocity components, but to be brighter for the blue-shifted emission compared to the red-shifted component. This asymmetry in the RRL profiles can be explained as RRL maser emission in the HW2 jet (Section 5).
Ignoring the results from the H40 blue-shifted component (its peak velocity and linewidth are factors of 4 and 2 larger than for H34 and H31; Table 1), the averaged peak velocities and linewidths are, respectively, 50 km s-1 and 360 km s-1 for the blue-shifted emission, and 360 km s-1 and 200 km s-1 for the red-shifted gas.
4. Line-to-Continuum flux ratios: Radio Recombination Line Masers in HW2
Martín-Pintado et al. (1989) showed that the generation of RRL emission at millimeter wavelengths can suffer from non-LTE effects that lead to the formation of RRL masers in ionized winds. Since Cepheus A HW2 shows similar properties to the RRL maser object MWC349A, it is possible that the RRLs toward HW2 also form under non-LTE conditions.
In Section 3, we have shown that there is a trend for the RRL peak and integrated intensities to increase with frequency. This behavior is expected for RRL emission, since the integrated line-to-continuum flux ratios for RRLs (ILTRs, defined as ; Martín-Pintado et al., 1989) increase with frequency as for optically thin emission and LTE conditions. From Table 2 (Columns 2 and 3), however, we find that the measured ILTRs for these lines clearly deviate from the LTE predictions. The RRLs detected toward HW2 are therefore affected by maser effects. Like MWC349A (Column 4 in Table 2), the deviations from LTE for the ILTR of the H40 line are less prominent than those of H34 and H31 at higher frequencies. This is explained by the fact that the factors (the factor is proportional to the effective absorption coefficient of the RRL; Walmsley, 1990) are expected to be more negative for RRLs with n35 than for those with n=40, at the electron densities of 1-5104 cm-3 derived toward HW2 (Curiel et al., 2006).
| RRL | HW2aaDerived from the results shown in Columns 8 and 10 of Table 1. (km s-1) | LTEbbCalculated for optically thin continuum emission, =104 K and (He+)/(H+)=0.08. (km s-1) | MWC349 (km s-1) |
|---|---|---|---|
| H40 | 43 | 30 | 39ccILTRs of the H41 and H31 RRLs measured toward MWC349A by Martín-Pintado et al. (1989). |
| H34 | 229 | 43 | 110ddILTRs of the H34 RRL obtained toward MWC349A by Thum, Martín-Pintado & Bachiller (1992). |
| H31 | 280 | 58 | 215ccILTRs of the H41 and H31 RRLs measured toward MWC349A by Martín-Pintado et al. (1989). |
5. Modelling of the extremely broad radio recombination line emission
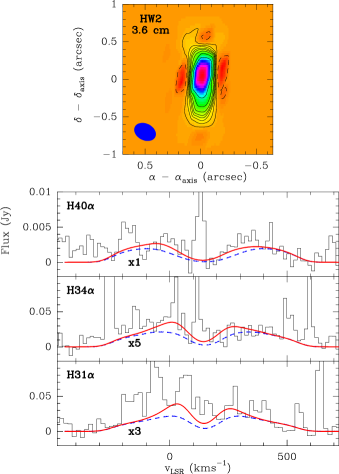
We try to reproduce the observed RRL profiles toward HW2 by using the 3D radiative transfer model of Martín-Pintado et al. (1993, 2002, 2011), which includes the LTE departure coefficients, and , calculated by Walmsley (1990). The model considers an isothermal ( 104 K) collimated, bi-conical ionized radio jet with a semi-opening angle of 18∘ and an inclination angle with respect to the line-of-sight of 52∘. This inclination angle is similar to that derived by Patel et al. (2005, of 62∘10∘) or Vlemmings et al. (2010, of 56∘). However, the semi-opening angle (18∘) is a factor of 2 larger than that derived by Rodríguez et al. (1994, of 7.5∘). The determination of this angle is subject to large uncertainties since the radiocontinuum emission of the HW2 jet is variable, and its semi-minor axis is unresolved (Curiel et al., 2006). Despite the 18∘ semi-opening angle, our model reproduces well the radiocontinuum fluxes at centimeter wavelengths, and the extremely broad RRL profiles measured toward HW2 (see below).
The radiocontinuum spectrum of HW2 is fitted with a mass loss rate of 3.210-6 M⊙ yr-1. Although this rate is a factor of 4 larger than that estimated by Rodríguez et al. (1994, 810-7 M⊙ yr-1), the predicted radiocontinuum fluxes at centimeter wavelengths agree well (within 13%) with those reported by these authors (Table 3). In Figure 2 (upper panel), we show the morphology of the 3.6 cm (8.44 GHz) radiocontinuum emission predicted by our model for the HW2 radio jet. This image is very similar to that observed with the VLA (Rodríguez et al., 1994). The derived free-free continuum fluxes at 3, 1.9 and 1.4 mm (0.058, 0.079 and 0.094 Jy, respectively) are also consistent with those shown in Table 1.
| Frequency | Observed aaFrom Rodríguez et al. (1994). | Predicted bbPredicted by our model for a mass loss rate of 3.210-6 M⊙ yr-1, and a semi-opening angle of 18∘. | Relative error |
|---|---|---|---|
| (GHz) | (mJy) | (mJy) | (%) |
| 1.49 | 3.4 | 3.3 | 1.6% |
| 4.86 | 7.5 | 7.6 | 1.1% |
| 8.44 | 9.8 | 11.1 | 12.9% |
| 14.9 | 15.8 | 16.3 | 3.2% |
| 43.3 | 35 | 33.4 | 4.5% |
The assumed electron density distribution in the HW2 jet varies as , with the distance to the central protostar extending out to 0.41 (285 AU at a distance of 700 pc; Reid et al., 2009). The electron density at the inner radius of 6.7 AU is 2.7108 cm-3, sufficient to obtain the maser effect in the RRLs.
To explain the extremely broad linewidths and the lack of emission at systemic velocities, we have considered that the ionized gas in the jet is accelerated constantly to reach a terminal velocity of 500 km s-1 (Curiel et al., 2006) at 35 AU from the protostar. The model also includes electron impact (pressure) broadening and a turbulent velocity of 60 km s-1. However, pressure broadening is expected to be negligible for the observed RRLs (Keto et al., 2008).
Figure 2 (lower panels) shows the RRL profiles predicted under LTE (dashed lines) and non-LTE conditions (solid lines), overlaid on the observed RRLs. To match the observations, we needed to (red-)shift the predicted RRLs by 160 km s-1 with respect to the systemic velocity of the cloud (10 km s-1; Martín-Pintado et al., 2005). Water masers toward HW2 also show significant shifts in their peak velocities, associated with the dynamics of the HW2 rotating disk and wide-angle outflow (Torrelles et al., 1996, 2011). However, their velocity spans (40 km s-1) are too small to explain the 160 km s-1 shift. The morphology and kinematics of the inner regions in the jet are unknown. Asymmetries in the density, temperature and kinematics between the red and blue lobes of the jet could give rise, due to the maser phenomenon, to large asymmetries in the RRL profiles, as expected from the larger spatial scales needed for RRL maser amplification compared to molecular masers (see below). Future modelling will explore whether these asymmetries are responsible for the 160 km s-1 shift observed in the RRLs.
From Figure 2, we find that the model qualitatively reproduces the two-component line profiles, with zero-intensity linewidths of 1000 km s-1, of the RRLs toward HW2. It can be seen that maser amplification (solid lines) occurs at radial velocities smaller than 300 km s-1 with respect to the systemic velocity of the jet. This is due to i) high-enough electron densities at those velocities (3105-4107 cm-3; Strelnitski, Ponomarev & Smith 1996); and ii) large enough coherent lengths, which lead to substantial amplification of the radiation along a velocity-coherent path (Ponomarev, 1994). For larger velocities (300 km s-1), the electron densities are also high (3105-8106 cm-3). However, the coherence length is very small making the maser effect negligible (Ponomarev, 1994). Maser amplification is maximum at radial velocities of 140-200 km s-1 with respect to the systemic velocity of the jet, because the electron densities at these velocities correspond to the optimum values for maser amplification (i.e. 6.8106 cm-3 for H40, 1.7107 cm-3 for H34, and 3.0107 cm-3 for H31; Figure 8 in Strelnitski et al., 1996). Toward MWC349A, Martín-Pintado et al. (1994) also reported the detection of RRL maser emission at velocities very different from the ambient cloud velocity (60 km s-1), and predicted that they arise from ionized outflowing gas (Martín-Pintado et al., 2011).
Although the model reproduces
well the intensity of the H40 line, it fails to
predict the intensities of the H34 and
H31 lines (note that these intensities have been multiplied in
Figure 2 by factors of 5 and 3, respectively).
This problem of unmatched intensities for RRLs with n40, was already
noted by Martín-Pintado et al. (1989) for the MWC349A RRL maser object, and could be due either to small density and temperature inhomogeneities in the stellar wind, or to uncertainties in the coefficients (Martín-Pintado et al., 1993). Despite the unmatched intensities, our model
reproduces the asymmetry observed in the RRLs
(Section 3), which can only be explained by RRL maser
effects. All this suggests that the extremely broad features
detected in the millimeter spectra toward Cepheus A HW2, are associated with RRL masers generated in the HW2 ionized jet.
In summary, we report the detection of the H40, H34 and H31 RRLs toward the high-velocity ionized jet in Cepheus A HW2. This emission shows extremely broad line profiles with zero-intensity linewidths of 1100 km s-1. The derived ILTRs significantly deviate from those in LTE, suggesting that these lines are RRL masers formed in the HW2 ionized jet with a expanding velocity of 500 km s-1. Together with MWC349A, the discovery of RRL masers in HW2 suggests that this mechanism could be a common feature in dense UC HII regions (Martín-Pintado, 2002).
References
- Afflerbach et al. (1996) Afflerbach, A., Churchwell, E., Acord, J. M., Hofner, P., Kurtz, S., & Depree, C. G. 1996, ApJS, 106, 423
- Altenhoff, Strittmatter & Wendker (1981) Altenhoff, W. J., Strittmatter, P. A., & Wendker, H. J. 1981, A&A, 93, 48
- Cohen et al. (1985) Cohen, M., Bieging, J. H., Welch, W. J., & Dreher, J. W. 1985, ApJ, 292, 249
- Churchwell et al. (1989) Churchwell, E., Walmsley, C. M., Wood, D. O. S., & Steppe, H. 1989, in the proceedings of the 125 IAU Symposium, Radio Recombination Lines: 25 Years of Investigation, Ed. by M. A. Gordon & R. L. Sorochenko, Dordrecht: Kluwer, p.83
- Comito et al. (2007) Comito, C., Schilke, P., Endesfelder, U., Jiménez-Serra, I., & Martín-Pintado, J. 2007, A&A, 469, 207
- Curiel et al. (2006) Curiel, S., et al. 2006, ApJ, 638, 878
- Garay (1989) Garay, G. 1989, in the proceedings of the 125 IAU Symposium, Radio Recombination Lines: 25 Years of Investigation, Ed. by M. A. Gordon & R. L. Sorochenko, Dordrecht: Kluwer, p.73
- Gaume et al. (1995) Gaume, R. A., Goss, W. M., Dickel, H. R., Wilson, T. L., & Johnston, K. J. 1995, ApJ, 438, 776
- Gorti & Hollenbach (2009) Gorti, U., & Hollenbach, D. 2009, ApJ, 690, 1539
- Hamann & Simon (1986) Hamann, F., & Simon, M. 1986, ApJ, 311, 909
- Hartmann, Jaffe & Huchra (1980) Hartmann, L., Jaffe, D., & Huchra, J. P. 1980, ApJ, 239, 905
- Hollenbach et al. (1994) Hollenbach, D., Johnstone, D., Lizano, S., & Shu, F. 1994, ApJ, 428, 654
- Jaffe & Martín-Pintado (1999) Jaffe, D. T., & Martín-Pintado, J. 1999, ApJ, 520, 162
- Jiménez-Serra et al. (2007) Jiménez-Serra, I., Martín-Pintado, J., Rodríguez-Franco, A., Chandler, C., Comito, C., & Schilke, P. 2007, ApJ, 661, L187
- Jiménez-Serra et al. (2009) Jiménez-Serra, I., Martín-Pintado, J., Caselli, P., Martín, S., Rodríguez-Franco, A., Chandler, C., & Winters, J. M. 2009, ApJ, 703, L157
- Keto et al. (2008) Keto, E., Zhang, Q., & Kurtz, S. 2008, ApJ, 672, 423
- Martín-Pintado et al. (1989) Martín-Pintado, J., Bachiller, R., Thum, C., & Walmsley, M. 1989, A&A, 215, L13
- Martín-Pintado et al. (1993) Martín-Pintado, J., Gaume, R., Bachiller, R., Johnston, K., & Planesas, P. 1993, ApJ, 418, L79
- Martín-Pintado et al. (1994) Martín-Pintado, J., Neri, R., Thum, C., Planesas, P., & Bachiller, R. 1994, A&A, 286, 890
- Martín-Pintado (2002) Martín-Pintado, J. 2002, in the Proceedings of the 206 IAU Symposium, Cosmic Masers: From Proto-Stars to Black Holes, ed. V. Mineese and M. Reid, Astronomical Society of the Pacific, p.226
- Martín-Pintado et al. (2005) Martín-Pintado, J., Jiménez-Serra, I., Rodríguez-Franco, A., Martín, S., & Thum, C. 2005, ApJ, 628, L61
- Martín-Pintado et al. (2011) Martín-Pintado, J., Thum, C., Planesas, P., & Báez-Rubio, A. 2011, A&A, submitted
- Olnon (1975) Olnon, F. M. 1975, A&A, 39, 217
- Patel et al. (2005) Patel, N. A., et al. 2005, Nature, 437, 109
- Planesas, Martín-Pintado & Serabyn (1992) Planesas, P., Martín-Pintado, J., & Serabyn, E. 1992, ApJ, 386, L23
- Ponomarev (1994) Ponomarev, V. O. 1994, Astronomy Letters, 20, 151
- Reid et al. (2009) Reid, M. J., et al. 2009, 2009, ApJ, 700, 137
- Rodríguez et al. (1994) Rodríguez, L. F., Garay, G., Curiel, S., Ramírez, S., Torrelles, J. M., Gómez, Y., & Velázquez, A. 1994, ApJ, 430, L65
- Strelnitski et al. (1996) Strelnitski, V. S., Ponomarev, V. O., & Smith, H. A. 1996, ApJ, 470, 1118
- Thum, Martín-Pintado & Bachiller (1992) Thum, C., Martín-Pintado, J., & Bachiller, R. 1992, A&A, 256, 507
- Torrelles et al. (1996) Torrelles, J. M., Gómez, J. F., Rodríguez, L. F., Curiel, S., Ho, P. T. P., & Garay, G. 1996, ApJ, 457, L107
- Torrelles et al. (2011) Torrelles, J. M., et al. 2011, MNRAS, 410, 627
- Vlemmings et al. (2010) Vlemmings, W. H. T., Surcis, G., Torstensson, K. J. E., & van Langevelde, H. J. 2010, MNRAS, 404, 134
- Walmsley (1990) Walmsley, C. M. 1990, A&ASS, 82, 201
- Weintroub et al. (2008) Weintroub, J., Moran, J. M., Wilner, D. J., Young, K., Rao, R., & Shinnaga, H. 2008, ApJ, 677, 1140