VLT/FORS2 observations of the optical counterpart of the isolated neutron star RBS 1774††thanks: Based on observations collected at ESO, Paranal, under Programme 383.D-0485(A)
Abstract
Context. X-ray observations performed with the Röntgen Satellite (ROSAT) led to the discovery of a group (seven to date) of X-ray dim and radio-silent middle-aged isolated neutron stars (a.k.a. XDINSs), which are characterised by pure blackbody spectra ( eV), long X-ray pulsations ( s), and appear to be endowed with relatively high magnetic fields, (– G). Optical observations of XDINSs are important, together with the X-ray ones, to study the cooling of the neutron star surface and to investigate the relation betwen XDINSs and other isolated neutron star classes. RBS 1774 is one of the few XDINSs with a candidate optical counterpart, which we discovered with the Very Large Telescope (VLT).
Aims. We aim at constraining the optical spectrum of RBS 1774, for which only two B-band flux measurements are available, and to determine whether its optical emission is either of thermal or of non-thermal origin.
Methods. We performed deep observations of RBS 1774 in the R band with the VLT to disentangle a non-thermal power-law spectrum from a Rayleigh-Jeans, whose contributions are expected to be very much different in the red part of the spectrum.
Results. We did not detect the RBS 1774 candidate counterpart down to a limiting magnitude of . The constraint on its colour, , rules out that it is a background object, positionally coincident with the X-ray source. Our R-band upper limit is consistent with the extrapolation of the B-band flux (assuming a uncertainty) for a set of power-laws with spectral indeces . If the optical spectrum of RBS 1774 were non-thermal, its power-law slope would be very much unlike those of all isolated neutron stars with non-thermal optical emission, suggesting that it is most likely thermal. For instance, a Rayleigh-Jeans with temperature eV, for an optically emitting radius km and a source distance pc, would be consistent with the optical measurements. The implied low distance is compatible with the 0.04 X-ray pulsed fraction if either the star spin axis is nearly aligned with the magnetic axis or with the line of sight, or it is slightly misaligned with respect to both the magnetic axis and the line of sight by .
Conclusions. New observations, both from the ground and from the Hubble Space Telescope (HST), are important to characterise the optical/near-ultraviolet (UV) spectrum of RBS 1774, to better constrain the values of , , and and measure the source proper motion from which indirect constraints on the source distance can be inferred.
Key Words.:
Optical: stars; neutron stars: individual RBS 17741 Introduction
One of the most intriguing results of the all sky survey performed by the Röntgen Satellite (ROSAT) has been the discovery of seven X-ray dim and radio-silent, middle-aged isolated neutron stars (a.k.a. XDINSs, see Haberl 2007 and Turolla 2009, for the most recent reviews). XDINSs stand apart with respect to most X-ray emitting INSs due to their pure blackbody X-ray spectra ( eV), produced from the cooling of the neutron star surface. Shallow X-ray pulsations ( s), likely from large and hot polar caps, are observed for all but one of them. The measurement of the period derivative in some XDINSs (see Kaplan & van Kerkwijk 2009 and references therein) yielded, assuming magneto-dipolar spin-down, ages of Myrs and rotational energy losses ergs s-1, too small to power detectable magnetospheric emission. Interestingly, XDINSs appear to be endowed with relatively high magnetic fields, – G, as inferred from spin-down measurements and the detection of broad spectral features which could be attributed to proton cyclotron scattering and/or electron transitions in H/He-like atoms. Besides the X-rays, XDINSs are only detected in the optical. In radio, stringent upper limits have been obtained at 820 MHz (Kondatriev et al. 2009), while the detections of RX J1308.6+2127 and 1RXS J214303.7+065419 at 111 MHz (e.g. Malofeev et al. 2007) is yet unconfirmed. XDINSs feature a optical excess with respect to the extrapolation of the X-ray spectrum (see, e.g. Mignani 2011) and, at least in the two best-studied cases (RX J0720.43125 and RX J1856.53754), their optical fluxes closely follow a Rayleigh-Jeans (R-J) distribution, with a possible additional power-law (PL) component for the former (Kaplan et al. 2003). Whether the XDINSs optical emission is produced from regions of the star surface which are larger and cooler than those producing the X-rays (e.g. Pons et al. 2002) is debated.
Recently, we observed 1RXS J214303.7+065419 (a.k.a. RBS 1774), the last of the ROSAT discovered XDINS (Zampieri et al. 2001) and possibly that with the highest inferred magnetic field ( G; Zane et al. 2005)111This value has been inferred from the observations of an absorption feature in the X-ray spectrum of the source. However, the recent measurement of the pulsar spin-down (Kaplan & van Kerkwijk 2009) implies a magnetic field of G, with the Very Large Telescope (VLT) and we identified its optical counterpart (B=27.4 0.2; Zane et al. 2008). Interestingly, the neutron star flux was found to be a factor above the optical extrapolation of the XMM-Newton X-ray spectrum ( eV; ; Zane et al. 2005), and a slightly larger optical excess was measured with the Large Binocular Telescope (LBT) by Schwope et al. (2009). So far, nothing is known about the optical/IR spectrum of RBS 1774, for which only the two B-band flux measurements of Zane et al. (2008) and Schwope et al. (2009) are available. Prior to our detection of the optical counterpart, the neutron star was observed both at optical and infrared (IR) wavelengths (Lo Curto et al. 2007; Rea et al. 2007; Posselt et al. 2009) but no counterpart was found.
In order to constrain the optical spectrum of RBS 1774, we performed new observations with the VLT in the R band to disentangle the slope of a flat PL continuum from that of a R-J distribution and, thus, to determine whether the optical emission is non-thermal or thermal, i.e. associated either with the magnetosphere or the neutron star surface.
This paper is organised as follows: observations, data reduction and analysis are described in Sect. 2, while results are presented and discussed in Sect. 3 and. Conclusions follow.
2 Observations and data analysis
2.1 Observation description
We obtained optical images of the RBS 1774 field with the VLT Antu telescope at the ESO Paranal observatory on September 19 and 20, 2009. Observations were performed in service mode with the FOcal Reducer/low dispersion Spectrograph (FORS2), a multi-mode camera for imaging and long-slit/multi-object spectroscopy (Appenzeller et al. 1998), using the default filter ( Å; Å). In order to achieve the highest sensitivity at longer wavelengths, FORS2 was equipped with its red-sensitive MIT detector, a mosaic of two 2k4k CCDs optimised for wavelengths longer than 6000 Å. In its standard resolution mode, the detector has a pixel size of 025 (22 binning) which corresponds to a projected field–of–view of 8 over the CCD mosaic. However, due to vignetting, the effective sky coverage of the two detectors is smaller than the projected detector field–of–view, and it is larger for the upper CCD chip. To include a larger number of reference stars for a precise image astrometry, as well as to increase the signal–to–noise ratio per pixel, we performed the observations in standard resolution mode. We positioned RBS 1774 in the upper CCD chip to exploit its larger effective sky coverage (). The instrument was operated in its standard low gain, fast read-out mode.
To allow for cosmic ray removal, a sequence of 20 exposures of 775 s each were obtained in the two nights, for a total integration time of 9300 s and 6200 s for the first and second night, respectively. Exposures were taken in dark time and under photometric conditions, as recorded by the ESO ambient condition monitor222http://archive.eso.org/asm/ambient-server and close to the zenith, with an airmass mostly below 1.3. The image quality (IQ) was not constant during our observations. The seeing values measured by the Paranal differential image motion monitor (DIMM) are relative to the zenith and not to the pointing direction of the telescope and are subject to ground-layer turbulence (see also Martinez et al. 2010). Thus, they are not necessarily indicative of the actual IQ. For this reason, we computed it from the measured point spread function (PSF), derived by fitting the full width half maximum (FWHM) of a number of well-suited field stars using the Sextractor tool (Bertin & Arnouts 1996), following the recipe used by the FORS2 data quality control procedures333www.eso.org/observing/dfo/quality/FORS2/qc/qc1.html. The average IQ in the first night was , while in the second night it was . Bias, twilight flat–fields frames, and images of standard star fields (Landolt 1992) were obtained as part of the FORS2 science calibration plan.
2.2 Data analysis
Data were reduced through the ESO FORS2 data reduction pipeline444www.eso.org/observing/dfo/quality/FORS2/pipeline for bias subtraction, and flat–field correction. Photometric calibration was applied using the extinction-corrected night zero points computed by the FORS2 pipeline and available through the instrument data quality control database. We converted the FORS2 zero points, computed in units of electrons/s, to units of ADU/s by applying the corresponding electrons–to–ADU conversion factors. We finally co-added the reduced science images using the IRAF task drizzle applying a filter on the single pixel average to filter out residual hot and cold pixels. In order to achieve a better signal–to–noise, we decided to use only the images taken on the first night, which have the best IQ in our sample and provide the longest integration time (9300 s). Of course, we verified that adding the images taken on the second night does not improve the signal–to–noise.
To locate the RBS 1774 candidate counterpart in our FORS2 image, we used as a reference its position measured in our original FORS1 observation. Since the FORS1 detector was also a mosaic of two 2k4k CCDs (but blue-optimised), with the same pixel size and field–of–view as FORS2 at standard resolution, we decided to register the counterpart position on our co-added FORS2 image through a relative astrometry procedure. Whenever possible, this approach yields a position registration in the detector reference frame which is more accurate than that achievable through absolute astrometry, since it is not affected by the intrinsic absolute accuracy of the used reference catalogue. Moreover, most of the reference stars from e.g. the GSC-2 (Lasker et al. 2008) are saturated in our images. For our relative astrometry, we used as a reference the positions of several point-like objects detected in the field–of–view with Sextractor, after filtering out objects that are either saturated, or too faint, or too close to the CCD edges. The relative frame registration was performed using standard tools available in IRAF and turned out to be accurate to better than 0.05 pixels () in both the and directions, which are aligned with right ascension and declination to better than . To this, we added the uncertainty on the candidate counterpart centroid on the FORS1 image which is pixels (). Since the FORS1 position refers to July 11, 2007 (MJD=54292), we have to account for an additional positional uncertainty due to the unknown neutron star proper motion to the date of our FORS2 observations (MJD=55093). This corresponds to a yearly displacement of , where and are the unknown neutron star transverse velocity and distance555Posselt et al. (2009) quote a fiducial lower limit of pc, estimated from models of the distribution. in units of 100 km s-1 and 100 pc, respectively. For, e.g. an average neutron star velocity of km s-1 (Hobbs et al. 2005) and a distance of 300 pc, this would translate into an additional positional uncertainty of , which obviously dominates over the uncertainty on our relative astrometry.
3 Results
3.1 Photometry
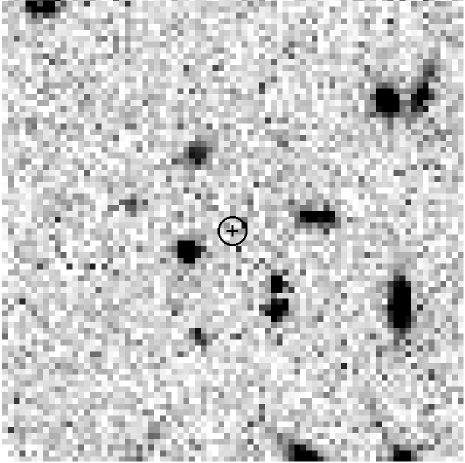
The computed position of the RBS 1774 candidate counterpart, overlaid on the co-added FORS2 R-band image, is shown in Fig. 1. As it is apparent, no source can be visually identified at the expected neutron star position. We ran an automatic search with Sextractor but we did not detect any object above the detection threshold. We applied an image smoothing using a Gaussian function over pixel cells but we could not detect any new feature which could be unambiguously associated to a real object and not to an enhanced background fluctuation. Thus, we conclude that the optical counterpart of RBS 1774 is undetected in our images. We note that the 06 positional uncertainty shown in Fig. 1 corresponds to the assumed values of the neutron star distance (300 pc) and transverse velocity (400 km s-1) and, thus, it is is only indicative. However, our conclusions are not affected by the actual position uncertainty of the neutron star since no new object is detected within a radius of 5″ from the nominal candidate counterpart position with respect to those already detected (see Fig. 1 of Zane et al. 2008). We determined the detection limit of our FORS2 image from the number of counts corresponding to a detection in an aperture of 2 pixel radius (05), derived from the standard deviation of the background sampled around the expected neutron star position. We then corrected the number of counts for the airmass, using the atmospheric extinction coefficients measured for FORS2 and available through the instrument data quality control database, and we applied the aperture correction. The latter was computed from the measured growth curve of a number of relatively bright but unsaturated stars in the field, with no adjacent star closer than 5″, and whose photometry is not affected by strong background gradients. The final limit of is about 1.3 magnitudes fainter than the upper limit reported by Rea et al. (2007).
The non-detection of the Zane et al. (2008) candidate in our new VLT R-band images might cast some doubts as whether this object is indeed the optical counterpart of RBS 1774, although the low chance coincidence probability with the Chandra position (; Zane et al. 2008) already made the association quite robust. Given the flux of the candidate counterpart (), its non-detection in the R band corresponds to an observed . The observed upper limit on the colour, together with the brightness of the candidate counterpart, can be used to rule out that this is a background object, positionally coincident with the neutron star. Since RBS 1774 coordinates point at a quite high galactic latitude (, ), as shown by the many galaxies identified in the field, the candidate counterpart might be, in principle, an AGN. Indeed, most AGNs at have , which is compatible with the colour of RBS 1774 candidate counterpart. The fact that no transient/persistent radio source was detected at its position in recent, deep 840 MHz observations (Kondriatev et al. 2009) would only rule out a radio-loud AGN. However, an AGN not detected in X-rays666Chandra observations of RBS 1774 rule out a blend with a background X-ray source. would be either very much absorbed or at a much higher redshift, which would be hardly compatible with the constraint on its and with its detection in the B band, respectively. On the other hand, a would be compatible with a main sequence star of spectral type earlier than F but this should be well outside the Galaxy to reproduce the observed B-band flux. Thus, both the counterpart colour and its brightness are only compatible with a neutron star.
| Model | NH | kT | Eline | (dof) | |
|---|---|---|---|---|---|
| ( cm-2) | (eV) | (eV) | (eV) | ||
| (1) bbody | 2.70.2 | 102.01.2 | 1.51 (133) | ||
| (2) bbody+gauss | 2.60.2 | 104.22.1 | 72816 | 3131 | 1.20 (130) |
| (3) bbody*gauss | 2.60.2 | 104.12.1 | 73317 | 3130 | 1.20 (130) |
3.2 Multi-band spectrum
We compared our -band magnitude upper limit with the best-fit model to the XMM-Newton spectrum of RBS 1774 and with the available multi-band photometry (Rea et al. 2007; Zane et al. 2008; Schwope et al. 2009). We computed the interstellar extinction correction from the hydrogen column density derived from the X-ray spectral fit. To this aim, we fitted the XMM-Newton spectrum anew using updated calibrations and response files. We re-extracted the EPIC-pn spectrum from the original May 2004 observation using version 10.0.0 of the XMM-Newton Science Analysis System (SAS), a circular region of radius, and selecting only single-pixel events. Since combined fits with pn and MOS spectra are dominated by the higher statistical quality of the pn spectrum, we concentrated on the pn spectrum only. For comparison with the results obtained by Schwope et al. (2009) and Cropper et al. (2007) we fitted the spectrum with either a black body (BB) model, a BB plus an (additive) Gaussian line, and a BB plus a (multiplicative) absorption edge. In each case, interstellar absorption was included by using the XSPEC (version 12.6.0k) model phabs with abundances from Wilms et al. (2000). The best fit parameters are summarised in Table 1. As in previous analyses, inclusion of an absorption feature improves the fit over a simple BB model, although the current energy resolution does not allow to discriminate a Gaussian line in absorption from an edge. The slight differences between the model parameters reported here and those given by Schwope et al. (2009) and Cropper et al. (2007) are largely due to the different revisions of the soft spectral response calibration of the EPIC-pn camera and possibly different elemental abundances used for the absorption model. The new spectral fit with an absorbed BB plus an (additive) Gaussian line yields a best-fit temperature of eV, consistent with that obtained by Zane et al. (2005) by fitting the same XMM-Newton data but with older calibrations and response files. However, we note that our new spectral fit yields a best-fit value of cm-2 which is somewhat lower than that obtained by Zane et al. (2005), cm-2, and which was used both in Rea et al. (2007) and in Zane et al. (2008) to compute the interstellar extinction. This resulted in slightly larger extinction-corrected fluxes, where the effect is magnitudes, i.e. well below the uncertainties on their absolute photometry. Nonetheless, in the following we assume as a reference cm-2, obtained from our updated spectral fits to the XMM-Newton spectrum. From this value, we derived an interstellar reddening using the relation of Predehl & Schmitt (1995).777This relation is affected by uncertainties for close objects, due to the problems of modelling the interstellar medium (ISM) at small distance from the Sun where microstructures weight more. We checked that, when using the relations of Bohlin et al. (1978) and of Paresce (1984) extinction corrections are consistent within 0.04 magnitudes, well below the pure statistical error on the source count rate. and, from this, we computed the interstellar extinction in the different bands using the extinction coefficients of Fitzpatrick (1999). We then corrected the available multi-band photometry accordingly.
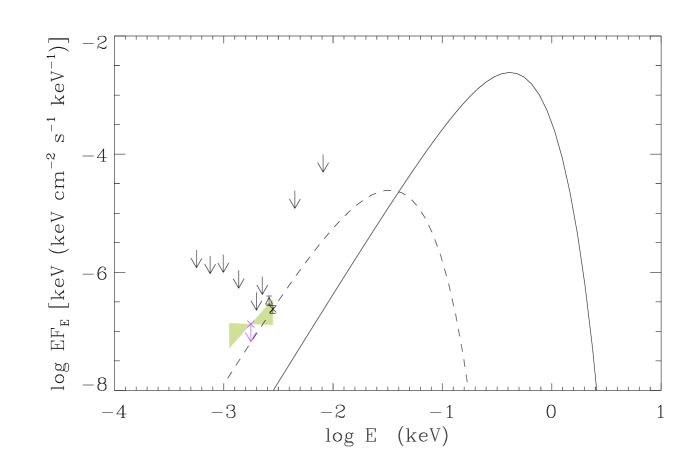
The new extinction-corrected multi-band fluxes from Rea et al. (2007), Zane et al. (2008), and Schwope et al. (2009) are shown in Fig. 2, together with the best-fit XMM-Newton spectrum and its extrapolation in the optical domain. To these points, we added flux measurements obtained in the near-ultraviolet (UV). The RBS 1774 field has been observed with the GALEX satellite (Martin et al. 2005) in both the NUV ( Å; Å) and FUV passbands ( Å; Å). We retrieved the fully reduced and calibrated imaging data from the GALEX archive888www.galex.stsci.edu for inspection but we could not detect the source down to upper limits of 2.76 Jy and 5.77 Jy in the NUV and FUV passbands, respectively. We corrected these fluxes for the interstellar extinction using as a reference the derived above and the extinction coefficients of Fitzpatrick (1999) for the NUV passband and of Seaton (1979) for FUV one. The field has been also observed with the XMM-Newton Optical Minotor (Mason et al. 2001) in the UWW1 ( Å; Å), UWM2 ( Å; Å), and UVW2 ( Å; Å) filters but the source was not detected down to limits which are not deeper than the GALEX/NUV one. At shorter wavelengths, the source was not detected by EUVE during its all-sky scan and was not targeted by pointed observations (Bowyer et al. 1996). As seen from Fig. 2, the GALEX points lie at least two orders of magnitude above the X-ray spectrum extrapolation. Thus, they can not be used to constrain the shape of the optical spectrum.
3.3 The optical excess
We note that the extrapolation of the new best-fit spectrum in the optical domain lies a factor 1.35 above the extrapolation derived in Zane et al. (2008). Thus, as the result of the new fit to the XMM-Newton spectrum the optical excess of the VLT B-band flux is ( confidence level). This is lower than the value of () published in Zane et al. (2008) although still marginally consistent within errors. As shown in Sect. 3.2, the difference in the obtained from our spectral fit and that of Zane et al. (2005) only corresponds to a difference of magnitudes in the dereddened B-band flux. Thus, it has only a negligible effect in the lower optical excess that we derive, which is mainly due to the difference in the extrapolation of the best-fit XMM-Newton spectrum, resulting from the use of new calibrations and response files. We also note that the value of the optical excess is insensitive to which of the two best-fit spectral models, (2) and (3) in Table 1, is actually assumed, since both the spectral parameters of the underlying blackbody and the inferred are virtually identical. We note that Schwope et al. (2009), using LBT data, obtained a slightly brighter B-band magnitude of with respect to our value of (Zane et al. 2008), which they interpreted as hint of a possible flux variability from the source. Taking the magnitude difference at face value, this would imply a difference of in the optical excess. However, we note that the magnitude difference between the two measurements, ( error), is not statistically compelling. Moreover, the two measurements have been taken with different telescope/detectors and with non-identical filters, which brings in an additional uncertainty due to the colour-term correction, and have been calibrated using different sets of standard stars, using default atmospheric extinction corrections. While Zane et al. (2008) applied the average B-band atmospheric extinction coefficient provided by ESO999www.eso.org/observing/dfo/quality/FORS1/qc/qc1.html computed from observations performed at the Paranal Observatory over the April 2007-September 2007 semester with the same telescope/instrument set-up used in their own observations, Schwope et al. (2009) applied the B-band extinction coefficients measured at the LBT site a few months apart, during the commissioning of the instrument. Since the measured atmospheric extinction coefficients can display a night-to-night scatter up to 0.1 magnitudes, this would introduce, on both measurements, an additional uncertainty of up to magnitudes on the absolute photometry, for a target observed at the zenith, which is obviously larger if the target is observed at larger zenith angles. Accounting for all the above sources of uncertainties, the difference between the two B-band flux measurements are significantly smoothed out, and we regard them as consistent with in the errors. Thus, in the following we use as a reference a value of the optical excess of , corresponding to our VLT B-band measurement.
4 Discussion
4.1 Non-thermal emission
Our new R-band magnitude upper limit corresponds to an unabsorbed spectral flux keV (keV cm-2 s-1 keV-1), at a central energy of 1.77 eV. As it is seen from Fig. 2, the R-band upper limit is consistent with a set of PLs with spectral indeces which pass above/below the B-band flux (shaded area). If the optical spectrum of RBS 1774 were non-thermal, such a range of PLs would be only marginally compatible with the spectral indeces measured for other types of isolated neutron stars with non-thermal optical emission, like the rotation-powered pulsars for which (see Mignani et al. 2007b, 2010a,b). However, since the actual R-band flux of RBS 1774 is obviously below the derived upper limit, the PL would most likely have a negative spectral index, which makes the spectrum rising and not declining towards the near-UV. Thus, although we can not rule out the presence of a PL component of non-thermal nature, we regard it as unlikely that the optical spectrum of RBS 1774 can be described by a single PL. Moreover, it is not clear what the origin of such a non-thermal PL could be. In Zane et al. (2008) we already deemed unlikely that non-thermal optical emission from RBS 1774 can be powered by the neutron star rotational energy loss which, if of the order of erg s-1 as observed in the other XDINSs, would imply an anomalously large optical emission efficiency, times larger than that of rotation-powered pulsars (Zharikov et al. 2006). Alternatively, on the basis of a detection in one band only and lacking a deep upper limit in the R band, we suggested that non-thermal optical emission could be powered by the presumably large neutron star magnetic field ( G; Zane et al. 2005), as it has been proposed for the magnetars, whose optical/IR emission efficiency is also a factor of larger than that of the radio pulsars (Mignani et al. 2007a). However, in the few cases where multi-band photometry is available, magnetar optical spectra are consistent with PLs with spectral index , again very much different from our limit for RBS 1774.
4.2 Thermal emission from the neutron star surface
The R-band upper limit is consistent with a R-J spectrum which passes through the B-band flux. A linear function connecting the VLT B-band point and the R-band upper limit has a slope , and the R-band upper limit lies only above the extrapolation of the R-J spectrum that passes through the central value of the measured B-band flux. This is well compatible with both the B and R-band fluxes being on the same R-J spectrum, conceivably emitted by a region of the star surface which is colder than that responsible for the X-ray emission.


As in Zane et al. (2008), we consider a picture in which the optical emission originates from a colder fraction of the neutron star surface, which emits a blackbody spectrum at a temperature (Braje & Romani 2002; Pons et al. 2002; Kaplan et al. 2003; Trümper et al. 2004). In the R-J tail, the ratio between the optical and X-ray fluxes scales as , where is the size of the optically emitting region (which, of course, cannot exceed the value of the neutron star radius), while and are the radius and temperature of the X-ray emitting region, as inferred from X-ray spectroscopy, eV, km. Since the RBS 1774 distance is unknown, we iterated our computations over several values of and and derived the value of that corresponds to a given value of the optical excess, (as computed from the B-band flux). Since no contribution from such a cold component is observed in the 0.1-1 keV XMM-Newton spectrum101010A soft thermal component to the X-ray spectrum could be compatible with the XMM-Newton RGS data which show an emission excess at low energies (Schwope et al. 2009), it must be , where
Furthermore, the extrapolation of the cold blackbody component in the R band must be compatible with our new VLT upper limit. We have performed the calculation for a large set of parameters, varying the source distance between and pc, the B-band excess within the limits (), and considering , , and km111111Neutron star radii of km are unlikely for most equations of state (e.g., Lattimer & Prakash 2004).. We found that the data are quite constraining: a radius km is compatible with the considered range of only for pc (which implies km) and eV. Assuming a smaller radius ( km), the observed excess is only compatible with even smaller distances ( pc, corresponding to km) and eV. On the other hand, assuming a larger radius ( km) the observed excess is compatible with distances up to 300 pc (corresponding to km) and eV. As an example, we plotted in Fig.2 a blackbody with eV, corresponding to km and pc.
Next, we verified if the inferred size of the hotter caps is compatible with the observed pulsed fraction (PF)
where () are the maximum (minimum) value of the flux along the pulse The PF was computed numerically by means of an IDL script for different allowed combinations of , and (that is for which the condition was met), and assuming in all cases eV. We also used two values of the star mass, to check how sensitive our results are to general relativistic effects (which depend on the compactness ; e.g Beloborodov 2002). Since it is always , we took the latter to coincide with the star radius. Results are shown in Fig.3, where the curve of constant PF (0.04) is plotted as a function of the two geometrical angles, , the angle between the neutron star spin and magnetic axes, and , the angle between the spin axis and the line-of-sight (LOS), for the case reported in Fig. 2. Overplotted to the numerical contour is the analytical curve obtained following the method presented by Beloborodov (2002), and which is strictly valid only for point-like caps. The present analyses confirms previous findings (Zane et al. 2008; Schwope et al. 2009). One possibility is that either the spin axis is nearly aligned with the magnetic axis, hence the star is a nearly aligned rotator, or the spin axis is nearly aligned with the LOS. The other possibility is that the spin axis is slightly misaligned with respect to both the magnetic axis and the LOS by . We note that although the numerical and analytical curves are qualitatively similar there are quantitative differences. The allowed range in the two angles is somehow smaller in the complete calculation, as it is expected when the finite (albeit small) size of the caps is accounted for. This also may explain the somehow different conclusions reached by Schwope et al. (2009), who used a treatment valid only for point-like caps. The small opening of the X-ray emitting regions does not constrain the geometry too much, and several combinations of the angles and are possible.
5 Summary and conclusions
We performed deep optical observations of RBS 1774 in the R band with FORS2 at the VLT to obtain the first characterisation of its optical spectrum. We did not detect RBS 1774 candidate counterpart at its expected position down to a limiting magnitude of . The constraint on the colour of the candidate counterpart, , rules out a foreground object, positionally coincident with the X-ray source. We re-analysed the XMM-Newton data of RBS 1774 using new calibrations and response files (see Sect. 3.2). We found that the optical excess of the VLT B-band flux (Zane et al. 2008) with respect to the best-fit X-ray spectrum extrapolation is now ( confidence level). This value is still incompatible with rotation-powered non-thermal emission from RBS 1774, unless its optical emission efficiency is times larger than that of rotation-powered pulsars (Zharikov et al. 2006). Moreover, our R-band upper limit would most likely imply a PL spectral index , while rotation-powered pulsars have usually (Mignani et al. 2007b; 2010a,b). On the other hand, explaining the optical excess in terms of pure thermal emission from the neutron star surface would require both a small distance and rather stringent limits on the inclination of the LOS and the magnetic axis with respect to the neutron star spin axis. For instance, a radius km implies a neutron star distance pc, which implies eV and km. Such a small X-ray emitting area is compatible with the X-ray pulsed fraction if either the star spin axis is nearly aligned with the magnetic axis or with the LOS, or it is slightly misaligned with respect to both the magnetic axis and the LOS by . Observations in the near-UV would obviously be crucial to constrain the slope of the RBS 1774 optical spectrum and to better constrain and . With the GALEX fluxes falling well above all possible R-J spectra compatible with the VLT flux measurements, only the Hubble Space Telescope (HST) can provide the required near-UV sensitivity. Future optical observations, both from the ground and from space, will also be important to measure the source proper motion, to independently confirm the optical identification and to infer indirect constraints on the distance.
Acknowledgements.
RPM thanks the ESO User Support Department and the Paranal Science Operation team for support in the scheduling and execution of the VLT observations.References
- (1) Appenzeller, I., et al., 1998, The Messenger, 94, 1
- Beloborodov (2002) Beloborodov, A.M., 2002, ApJ, 566, L85
- (3) Bertin, E. & Arnouts, S., 1996, A. & A. Suppl., 117, 393
- Bohlin et al. (1978) Bohlin, R.C., Savage, B. D., Drake, J. F. 1978, ApJ, 224, 132
- (5) Bowyer, S., Lampton, M., Lewis, J., et al., 1996, ApJS, 102, 129
- Braje & Romani (2002) Braje, T.M., Romani, R.W. 2002, ApJ, 580, 1043
- Cropper et al. (2007) Cropper, M. et al. 2007, Ap&SS, 308, 161
- Fitzpatrick (1999) Fitzpatrick, E.L., 1999, PASP, 111, 63
- (9) Geppert, U., Küker, M., Page, D., 2006, A&A, 457, 937
- (10) Haberl, F., 2007, Ap&SS, 308, 181
- (11) Hobbs, G., Lorimer, D. R., Lyne, A. G., & Kramer, M. 2005, MNRAS, 360, 974
- Kaplan et al. (2003) Kaplan, D.L., van Kerkwijk, M. H., Marshall, H. L., et al. 2003, ApJ, 590, 1008
- (13) Kaplan, D. L., van Kerkwijk, M. H., 2009, ApJ, 692, L62
- (14) Kondratiev, V. I., McLaughlin, M. A., Lorimer, D. R., et al., 2009
- Landolt (1992) Landolt, A.U. 1992, AJ, 103, 340
- (16) Lasker, B. M., Lattanzi, M. G., McLean, B. J., et al., 2008, AJ, 136, 735
- (17) Lattimer, J.M., Prakash, M. 2004, Science, 304, 536
- (18) Lo Curto, G., Mignani, R.P., Perna, R., et al. 2007, A&A 473, 539
- Malofeev et al. (2007) Malofeev, V. M., Malov, O. I., Teplykh, D. A., 2007, Ap&SS, 308, 211
- (20) Martin D. C., et al., 2005, ApJ, 619, L1
- (21) Martinez, P., Kolb, J., Sarazin, M., Tokovinin, A., 2010, The Messenger, 141, 3
- (22) Mason, K.O., Breeveld, A., Much, R., et al., 2001, A&A, 365, L36
- (23) Mignani, R.P., Perna, R., Rea, N., et al., 2007a, A&A, 471, 265
- (24) Mignani, R.P., Zharikov, S., Caraveo, P.A., 2007b, A&A, 473, 891
- (25) Mignani, R.P., Sartori, A., De Luca, A., et al., 2010a, A&A, 515, 110
- (26) Mignani, R.P., Pavlov, G.G., Kargaltsev, O., 2010b, ApJ, 720, 1635
- (27) Mignani, R.P., 2011, ASpR, in press, arXiv:0912.2931
- Paresce (1984) Paresce, F. 1984, AJ, 89, 1022
- Pons et al. (2002) Pons, J.A., et al. 2002, ApJ, 564, 981
- (30) Posselt, B., Neuhäuser, R., Haberl, F., 2009, A&A, 496, 533
- Predehl & Schmitt (1995) Predehl, P. & Schmitt, J.H.M.M. 1995, A&A 293, 889
- (32) Rea, N., et al., 2007, MNRAS, 379, 1484
- (33) Schwope, A., et al., 2009, A&A, 499, 267
- (34) Seaton, M.J., 1979, MNRAS, 187, 73
- Trümper et al. (2004) Trümper, J.E., Burwitz, V., Haberl, F., Zavlin, V.E. 2004, Nuclear Physics B Proceedings Supplements, 132, p. 560-565.
- (36) Turolla, R., 2009, ASSL, 357
- (37) Wilms, J., Allen, A., McCray, R., 2000, ApJ, 542, 914
- (38) Zane, S. et al., 2005, ApJ, 627, 397
- (39) Zane, S., Mignani, R.P., Turolla, R., et al., 2008, ApJ, 682, 487
- Zampieri et al. (2001) Zampieri L., et al. 2001, A&A, 378, L5
- (41) Zharikov, S., Shibanov, Yu., Komarova, V., 2006, AdSpR, 37, 1979