Constraining the Rate of Relativistic Jets from Tidal Disruptions Using Radio Surveys
Abstract
Tidal disruption of stars by massive black holes produce transient accretion flows that flare at optical, UV, and X-ray wavelengths. At late times, these accretion flows may launch relativistic jets that can be detected through the interaction of the jet with the dense interstellar medium of the galaxy. We present an upper limit for the flux density of a radio counterpart to a tidal disruption event detected by GALEX that is a factor of 6 below theoretical predictions. We also examine existing radio surveys for transients with a time scale of 1 year and use these to set a upper limit on the rate of tidal disruption events producing relativistic jets of . This rate is an order of magnitude lower than the highest values from theoretical models and is consistent with detection rates from optical and X-ray surveys.
1 Introduction
Massive black holes at the centers of galaxies disrupt stars that pass within the tidal radius of the black hole, resulting in a process of transient accretion (e.g., Rees, 1988). Dynamical models predict that these processes occur every to y per galaxy (Wang & Merritt, 2004). The accretion process leads to a flare that peaks at X-ray or UV wavelengths and has a power-law decline with a characteristic timescale of months. Such events are recognized by the flare and the transition from a normal galaxy to a state with an AGN spectrum. Gezari et al. (2009) summarize the current state of our knowledge regarding tidal disruption events detected at X-ray, UV, and optical wavelengths. In total, 10 events have been characterized. Synoptic optical surveys may detect tens of such events and prove powerful in characterizing tidal disruption events and determining their statistics (Strubbe & Quataert, 2010; van Velzen et al., 2010).
A significant astrophysical problem is the coupling between accretion and the launching of jets. Such systems are ubiquitous yet there is no complete theory that can predict jet properties based on a known accretion flow. Tidal disruption events represent a unique laboratory for exploring the accretion-outflow coupling under a range of different accretion conditions over a short period of time. If accretion leads to a relativistic outflow, this will likely radiate synchrotron emission, which can be detected at radio wavelengths. A recent model explores radio emission that results from the interaction of the outflow with the interstellar medium (Giannios & Metzger, 2011). Radio surveys have the advantage that they are unaffected by extinction in the dense nuclear environments of the host galaxy; however, there are no known detections of radio emission from tidal disruption events.
In this paper we examine what constraints that existing and future radio surveys can place on tidal disruption events. In § 2, we briefly summarize a new model for radio emission from tidal disruptions. In § 3, we discuss the relevant survey data and identify candidate events. In § 4, we use these results to set constraints on the rate of tidal disruptions that produce relativistic jets. In § 5, we present archival Very Large Array results for a tidal disruption event detected by GALEX. In § 6, we summarize our results.
2 Radio Emission from Jet-Induced Reverse Shocks
Giannios & Metzger (2011, hereafter, GM) introduce a model in which a reverse shock from the interaction of a jet with the dense interstellar medium of the galaxy produces an afterglow. The afterglow has a peak flux density
| (1) |
where is the distance to the source and is a constant of order unity that depends on details of the jet and ISM physics. The spectrum peaks at frequency of GHz and extends as to lower frequencies before reaching the self-absorption frequency. As the source cools, the peak flux density propagates to lower frequencies with proportionality . The reverse shock spectrum is expected to peak year following the tidal disruption event and have a duration of 1 year or less. This afterglow has the important property that it emits isotropically. Accordingly, events are not limited by the beaming angle of the relativistic jet that creates the relativistic shock.
A significant challenge in identification of a tidal disruption event in a nearby galaxy may be confusion with galactic emission. In this case, the tidal disruption would not appear as a true transient but rather as significant variability in a detected source. The amplitude of this variability must be large in the model of GM, however. For example, the galaxy NGC 891 has a flux density of 700 mJy at 1.4 GHz. If moved from its current distance of 7 Mpc to 1 Gpc, it would have a flux density of 35 microJy, a factor of 10 below the predictions of GM for a tidal flare at this distance. Thus, in practice tidal disruption events will appear as transients or extreme variables in most surveys.
3 Survey Results
We summarize here existing radio surveys that have sensitivity on timescales of year and are, therefore, sensitive to tidal disruption events. In Table 1, we give the frequency (), limiting flux density (), survey area (), number of epochs (), and number of candidate events (). The number of epochs is the number of independent year-long observations.
The archival VLA survey (Bower et al., 2007) at 5.0 and 8.4 GHz observed a single pointing weekly for 20 years, producing nearly 1000 independent epochs. Bower et al. (2007) produced maps and searched for transients on time scales of a single epoch, 2 month integrations, and 1 year integrations. No radio transients were detected from the 1-year integrations. Two radio transients were detected from the 2-month integrations but neither is associated with the nucleus of an optically-detected galaxy. A characteristic sensitivity of 0.1 mJy is chosen to represent the overall survey at 2-month and 1-year sensitivity. At this flux density, the effective survey area over all epochs is 0.26 deg2 at 1 year. This quantity is equal to . Dividing over , we find the per epoch area of 0.013 deg2. Limits for two-month integrations are similar to the 1-year results. Angular resolution of the survey ranged from ″to ″.
An analysis of 3C 286 observations from the VLA archives at 1.4 GHz was presented by Bower & Saul (2011). This paper explored daily variations in data obtained over 23 years in 1852 epochs. Since integrations longer than a single day were not produced, the single epoch flux density threshold sets the transient sensitivity limit. This limit is relatively poor, limiting the overall sensitivity of this result to month- or year-long events. These data were taken in the C and D configurations of the VLA, giving characteristic angular resolution ″. No radio transients were found above a characteristic flux density of 70 mJy. The solid angle is set by the field of view imaged.
The PiGSS-I (Bower et al., 2010) and ATATS-I (Bower et al., 2010) results are from Allen Telescope Array (Welch et al., 2009) single-epoch surveys at 3.1 and 1.4 GHz, respectively. These survey results are compared against the NVSS catalog (Condon et al., 1998) to determine the rate of transient sources. The characteristic timescale of both of these efforts is any timescale longer than the integration timescale of NVSS, which is less than 1 minute. NVSS observations were conducted more than 1 decade earlier than the ATA observations. The PiGSS-I catalog is constructed from observations spread over 4 months in 2009 and has a resolution of 100″. The ATATS-I catalog is constructed from observations spread over 4 months in 2008 and has a resolution of ″.
Light curves of sources detected in the VLA, 3C 286, PiGSS-I, and ATATS-I surveys indicate no variability greater than a factor of a few in all surveys on long timescales.
Levinson et al. (2002) and Gal-Yam et al. (2006) presented analyses of a comparison of the VLA FIRST (Becker et al., 1995) and NVSS 1.4-GHz catalogs in search of radio transients. The characteristic separation time between these catalogs is year. A radio supernova was the only transient identified. The characteristic resolution of the two surveys was 5 and 45″, respectively. The authors report no evidence of extreme variability in sources in either epoch.
Bannister et al. (2010) searched the archives of the Molongolo Synthesis Telescope to identify all fields observed multiple times over a 22-year period. The total surface area surveyed was 2776 deg2 at a flux density threshold of 6 mJy. All MOST observations were conducted at 0.843 GHz with a resolution of 45″. The heterogeneous nature of the sample makes determination of the sensitivity of the survey at year and longer timescales difficult. Examination of Figure 5 in their paper indicates that approximately two-thirds of the observations were paired with others on timescales greater than 1 year. Accordingly, we scale the total area by a factor of two-thirds.
The MOST survey identified 53 variable and 15 transient sources. Of the 15 transient sources from MOST, only three are unambiguously identified with known objects (SN 1987A, Nova Muscae 1991, and GRO 1655-40). Another source is offset from the nucleus of a nearby spiral galaxy and, therefore, unlikely to be a tidal disruption event. We can also exclude three sources showing variability on timescales much less than 1 year. We further exclude four sources that exhibit multiple detections with intervening non-detections. Two of the remaining four sources have optical detections in archival data indicative of a quasar. The dates of these optical observations are unclear but the surveys from which the data are drawn began and ended several years prior to the transient detection epoch for both sources. The authors argue that these are scintillating AGN. The remaining two sources (J064149-371706 and SUMSS J102641-333615) have a single detection with MOST, a non-detection with MOST about a year after the original detection, and no identified optical counterpart. We note that both sources have apparent NVSS counterpart that the authors did not identify, indicating that these are variable sources rather than true transients. Thus, none of the MOST transients qualify as plausible tidal disruption candidates.
Additionally, two variable sources (J201524-395949 and J200936-554236) from MOST are possibly associated with the nuclei of spiral galaxies at redshifts of 0.02 and 0.032, respectively. J201524-395949 exhibits an increasing flux density over 10 years with amplitude of mJy and a factor of 4 total increase. J200936-554236 exhibits a 5 mJy rise in flux density over three years (corresponding to less than factor of 2 increase in flux density). The amplitude of variability in both sources falls well below the predictions of GM ( mJy at this distance). Nevertheless, these sources broadly follow the expectations for tidal disruptions and are plausible candidates.
4 Limit on the Tidal Disruption Rate Producing Jets
We also tabulate calculated values for the limiting distance () at which tidal disruptions would be visible under the model of GM and an upper limit to the tidal disruption rate producing jets (). is computed directly from the limiting sensitivity of the surveys and explicitly making use of the decreasing peak flux density at lower frequencies (). We compute the rate from
| (2) |
where is the volume surveyed. For the case of no candidates, we set the upper limit at with . We give in units of .
These estimates clearly indicate that three surveys set the strongest limits. The VLA archival survey sets limits of for both two-month and 1-year integrations, respectively. The FIRST-NVSS comparison sets an upper limit while the MOST survey gives a rate limit . Note that in the case of MOST, the existence of plausible but not convincing candidates still leaves this value as an upper limit. Summing over all independent surveys, we estimate . We can place an upper limit of at confidence.
The radio upper limit is consistent with estimates based on ROSAT (Donley et al., 2002) and SDSS observations (van Velzen et al., 2010). The latter estimates a rate . For a space density of galaxies with massive black holes of , the optical rate implies . The limit that we have set falls more than an order of magnitude below the most optimistic model for the event rate of tidal disruptions, which estimates (Wang & Merritt, 2004).
Tidal disruption rates for radio detected events are likely to be lower than in the optical given that only a fraction of accreting systems typically produce radio jets. Thus, the radio limit can be considered consistent with the most optimistic optical constraints if % of the systems produce relativistic jets. Similarly, changes in the jet physics model of GM can strongly influence the event rate limit. For instance, the rate scales as the jet luminosity to the -3/2 power.
Future surveys will be capable of significantly improving sensitivity. As GM note, the complete PiGSS results have the capability to detect tens of events. Non-detections would place significant constraints on and the reverse shock model. Similarly, further analysis of data from the VLA archives can provide significantly more sensitivity. Year- or month-long integrations of the 3C 286 data would likely set sensitivity levels at 1 mJy or better while covering comparable area. The resulting sensitivity to would be in the range of . Use of additional sources or data at other frequencies could lead to an order of magnitude improvement. The VAST intermediate depth survey with ASKAP will achieve 250 microJansky sensitivity over deg2 in multiple passes and have substantial sensitivity to phenomena of this kind (Chatterjee et al., 2010).
5 VLA Images in the Field of GALEX J141929+525206
Gezari et al. (2006) reported the detection of a UV flare from an early-type galaxy with no prior evidence for AGN activity at z=0.37. The source was undetected in 2003 June 21 - 29, first appeared in 2004 March 25 - June 24, and then decayed steadily until it was not detected in 2006 March 5 - 7.
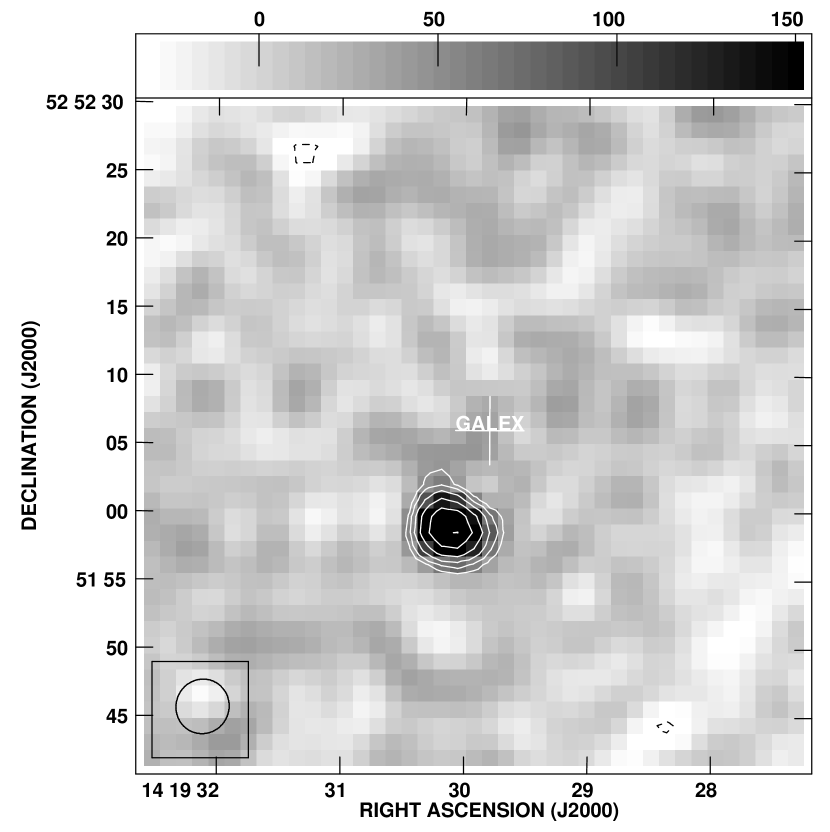
We used archival VLA data of observations in the field of the tidal flare candidate source. Data were obtained at a frequency of 1.4 GHz in spectral line mode to enable full field of view imaging on 2003 December 2, 2005 April 18, and 2005 June 20 as part of a campaign to survey the extended Groth strip (Ivison et al., 2007). No source was detected in these individual epochs at the location of the GALEX source with image rms of Jy. We integrate together all data to produce an image with 15 Jy rms and a synthesized beam (Figure 1). Again, no source is detected in the image of the GALEX source. A bright, extended source in the field is associated with the galaxy SDSS J141930.12+525159.
The model of GM predicts a radio flux of 0.2 mJy for this source at a frequency of 1.4 GHz. This is a factor of 6 higher than our upper limits in the integrated image. Thus, our observations, which are coincident with the first appearance of the UV flare and extend to 1.5 y after the peak, demonstrate that this source likely did not produce a relativistic jet that led to a reverse shock in the interstellar medium, or that the reverse shock emission was relatively short-lived.
In addition, we note that van Velzen et al. (2010) obtained upper limits for a radio counterpart of mJy at 8.5 GHz to tidal disruption event TDE2 in a galaxy at a distance of 1.05 Gpc. The flux densities fall well below the GM peak-flux predictions of mJy. These limits were obtained 7 and 92 days following the first initial optical detection, and so may not probe the late-time shock event.
6 Summary
We have presented here a summary of existing radio surveys with sensitivity to transients with timescales of y. These surveys provide the first constraint based on radio data of the rate of tidal disruption events around massive black holes in the nearby Universe. This upper limit is consistent with rates set via optical methods. Note that the rate we have set depends on details of the GM model for the jet and its interaction with the interstellar medium of the galaxy. Factors such as the fraction of systems that produce jets, the efficiency with which accretion power is converted to jet luminosity, and the density of the interstellar medium can significantly affect the estimated rates. The non-detection of a radio counterpart to a tidal disruption event demonstrates the degree to which we do not understand the accretion-outflow characteristics of systems of this kind.
Ongoing surveys such as PiGSS, future surveys such as VAST, and analysis of archival data can contribute to our constraints on radio properties of tidal disruptions. Equally important is follow-up of candidate events with sensitive observations using the EVLA. Unambiguous detection of a single radio counterpart would provide significant insight. Future optical surveys such as those carried out by Pan-STARRS are predicted to detect events per year (Gezari et al., 2009). Following up all events at a sensitivity 10 times deeper than the predictions of GM would provide a window into what mechanism in the accretion-outflow coupling leads to the paucity of radio emission from tidal disruption events.
References
- Bannister et al. (2010) Bannister, K., Murphy, T., Gaensler, B. M., Hunstead, R., & Chatterjee, S. 2010, ArXiv e-prints
- Becker et al. (1995) Becker, R. H., White, R. L., & Helfand, D. J. 1995, ApJ, 450, 559
- Bower & Saul (2011) Bower, G. C., & Saul, D. 2011, ApJ, 728, L14+
- Bower et al. (2007) Bower, G. C., Saul, D., Bloom, J. S., Bolatto, A., Filippenko, A. V., Foley, R. J., & Perley, D. 2007, ApJ, 666, 346
- Bower et al. (2010) Bower, G. C., et al. 2010, ApJ, 725, 1792
- Chatterjee et al. (2010) Chatterjee, S., Murphy, T., & VAST Collaboration. 2010, in Bulletin of the American Astronomical Society, Vol. 42, American Astronomical Society Meeting Abstracts #215, 470.12–+
- Condon et al. (1998) Condon, J. J., Cotton, W. D., Greisen, E. W., Yin, Q. F., Perley, R. A., Taylor, G. B., & Broderick, J. J. 1998, AJ, 115, 1693
- Donley et al. (2002) Donley, J. L., Brandt, W. N., Eracleous, M., & Boller, T. 2002, AJ, 124, 1308
- Gal-Yam et al. (2006) Gal-Yam, A., et al. 2006, ApJ, 639, 331
- Gezari et al. (2006) Gezari, S., et al. 2006, ApJ, 653, L25
- Gezari et al. (2009) —. 2009, ApJ, 698, 1367
- Giannios & Metzger (2011) Giannios, D., & Metzger, B. D. 2011, ArXiv e-prints
- Ivison et al. (2007) Ivison, R. J., et al. 2007, ApJ, 660, L77
- Levinson et al. (2002) Levinson, A., Ofek, E. O., Waxman, E., & Gal-Yam, A. 2002, ApJ, 576, 923
- Rees (1988) Rees, M. J. 1988, Nature, 333, 523
- Strubbe & Quataert (2010) Strubbe, L. E., & Quataert, E. 2010, ArXiv e-prints
- van Velzen et al. (2010) van Velzen, S., Farrar, G. R., Gezari, S., Morrell, N., Zaritsky, D., Ostman, L., Smith, M., & Gelfand, J. 2010, ArXiv e-prints
- Wang & Merritt (2004) Wang, J., & Merritt, D. 2004, ApJ, 600, 149
- Welch et al. (2009) Welch, J., et al. 2009, IEEE Proceedings, 97, 1438
| Name | |||||||
|---|---|---|---|---|---|---|---|
| (GHz) | (mJy) | (sr) | (Gpc) | () | |||
| VLA | 5.0 | 0.1 | 3.9e-06 | 20 | 0 | 2.99 | |
| 3C286 | 1.4 | 70.0 | 1.6e-04 | 23 | 0 | 0.08 | |
| PiGSS-I | 3.1 | 2.0 | 3.0e-03 | 1 | 0 | 0.59 | |
| ATATS-I | 1.4 | 230.0 | 2.1e-01 | 1 | 0 | 0.05 | |
| MOST | 0.8 | 14.0 | 5.5e-01 | 1 | 2 | 0.16 | |
| FIRST-NVSS | 1.4 | 6.0 | 1.9e-01 | 1 | 0 | 0.28 |