Hubble Space Telescope Observations of
Main Belt Comet (596) Scheila
Abstract
We present Hubble Space Telescope Observations of (596) Scheila during its recent dust outburst. The nucleus remained point-like with absolute magnitude = 8.850.02 in our data, equal to the pre-outburst value, with no secondary fragments of diameter 100 m (for assumed albedos 0.04). We find a coma having a peak scattering cross-section 2.2104 km2, corresponding to a mass in micron-sized particles of 4107 kg. The particles are deflected by solar radiation pressure on projected spatial scales 2104 km, in the sunward direction, and swept from the vicinity of the nucleus on timescales of weeks. The coma fades by 30% between observations on UT 2010 December 27 and 2011 January 04. The observed mass loss is inconsistent with an origin either by rotational instability of the nucleus or by electrostatic ejection of regolith charged by sunlight. Dust ejection could be caused by the sudden but unexplained exposure of buried ice. However, the data are most simply explained by the impact, at 5 km s-1, of a previously unknown asteroid 35 m in diameter.
1 Introduction
Main belt asteroid (596) Scheila (formerly 1906 UA and hereafter ``Scheila'') was discovered photographically in 1906 by August Kopff. It is a large body, with equivalent circular diameter = 1132 km and a visual geometric albedo = 0.0380.004 (Tedesco et al. 2002). The normalized (to 5500Å) optical reflection spectrum of Scheila (Bus and Binzel 2004) has a gradient = 6.21%/1000Å (the uncertainty is our estimate of the systematic error; the statistical error is only 0.04%/1000Å). The low albedo and the spectral slope together suggest that Scheila can be spectrally classified as a primitive P- or D- type (Dahlgren and Lagerkvist 1995). Under the assumption of a bulk density = 2000 kg m-3 and a spherical shape, the approximate escape speed from Scheila is = 60 m s-1.
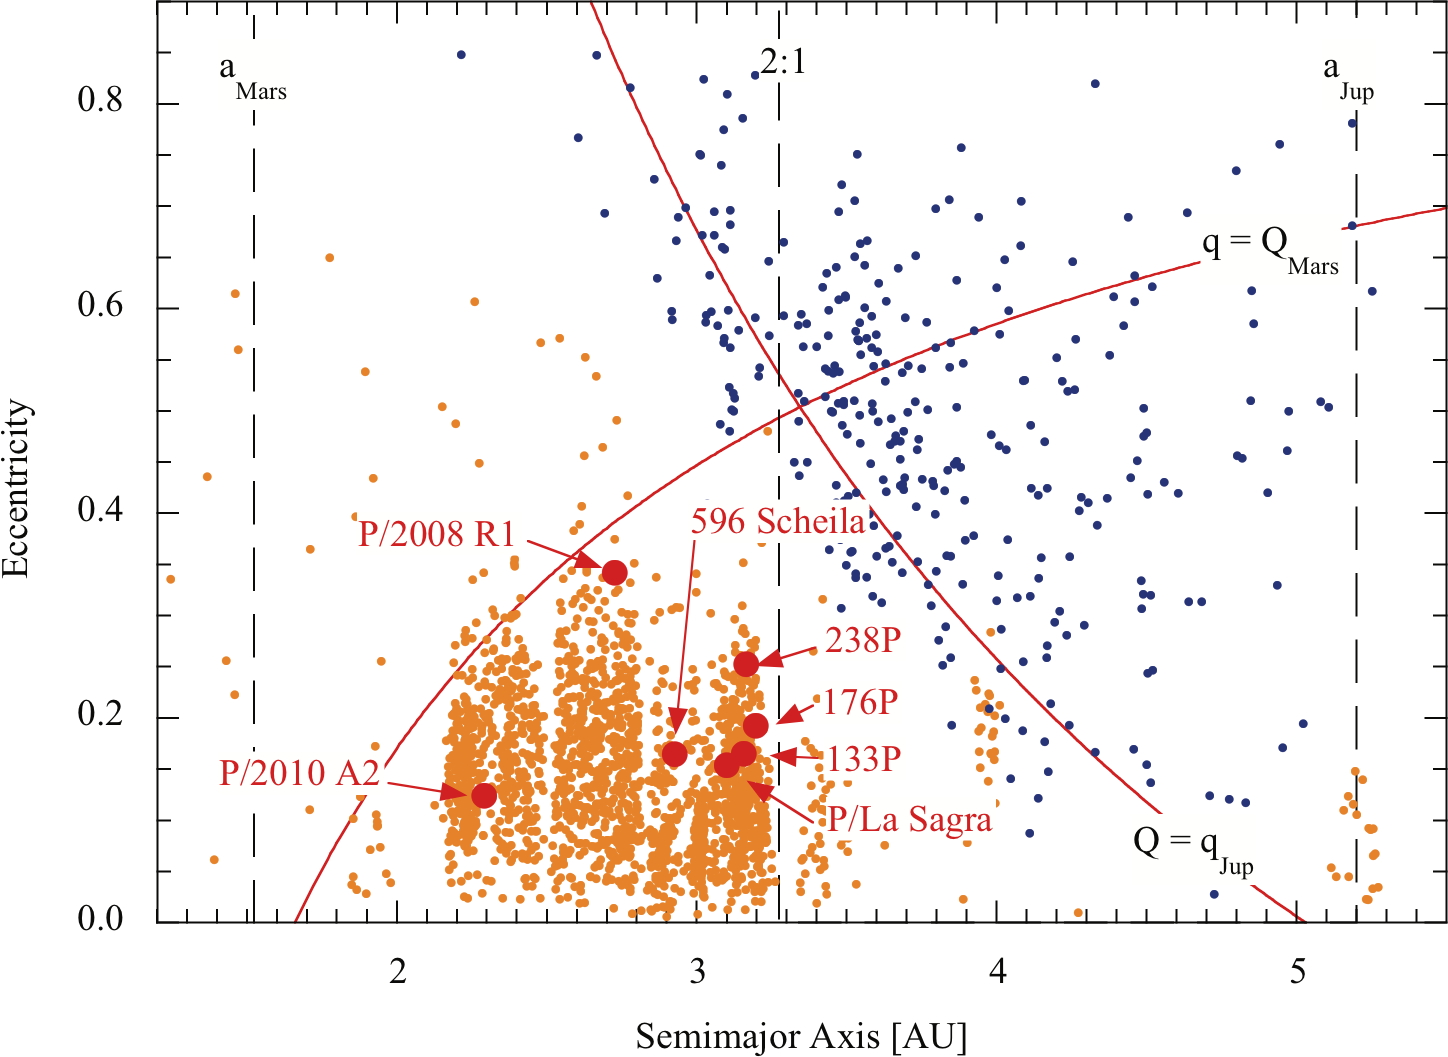
Scheila's orbit lies in the outer asteroid belt (semimajor axis, = 2.926 AU, eccentricity, = 0.1644, and inclination, = 14.7). The Tisserand parameter with respect to Jupiter, = 3.21, is typical of asteroids and lies far above the = 3 dynamical dividing line separating comets from asteroids (Kresak 1980). However, Larson (2010) discovered a comet-like appearance in observations taken UT 2010 December 11.44-11.47 with the 0.68 meter Catalina Schmidt telescope. Observations with the same telescope on UT 2010 Dec 3.4 showed a slightly diffuse appearance and an integrated magnitude = 13.2, about 1.3 mag brighter than in the previous month, when the object appeared point-like (Alex Gibbs, reported in Larson 2010). With a main-belt orbit ( 3) and a comet-like morphology, Scheila satisfies the definition of a main-belt comet (MBC: Hsieh and Jewitt 2006). It is the seventh known example (and by far the largest) of this class (Figure 1). The MBCs appear to be of diverse origins, including examples likely to be driven by the sublimation of near surface ice (e.g., 133P/Elst-Pizarro; Hsieh and Jewitt 2006) and others likely to result from recent, probably collisional, disruption (e.g., P/2010 A2; Jewitt et al. 2010, Snodgrass et al. 2010).
Here we report initial observations with the Hubble Space Telescope (HST), taken to examine Scheila at high angular resolution shortly after its outburst.
2 Observations
We secured two orbits of HST Director's Discretionary Time on UT 2010 Dec. 27.9 and UT 2011 Jan 04.9 with the WFC3 camera (Dressel et al. 2010). On each orbit we took six exposures each of 4 s duration to image the near-nucleus environment and four exposures each of 390 s duration to examine the low surface brightness coma. The short integrations employed the F621M filter (central wavelength 6210Å and FWHM [full width at half maximum] 640 Å) to prevent saturation while maintaining the point-spread function of the image. The long integrations used the F606W filter ( 6000Å and FWHM 2300 Å) to maximize sensitivity to low surface brightness coma. At the time of observation the 0.04 pixels corresponded to 66 km at the comet, so that the Nyquist sampled (2 pixel) resolution was 133 km. A brief journal of observations is given in Table 1.
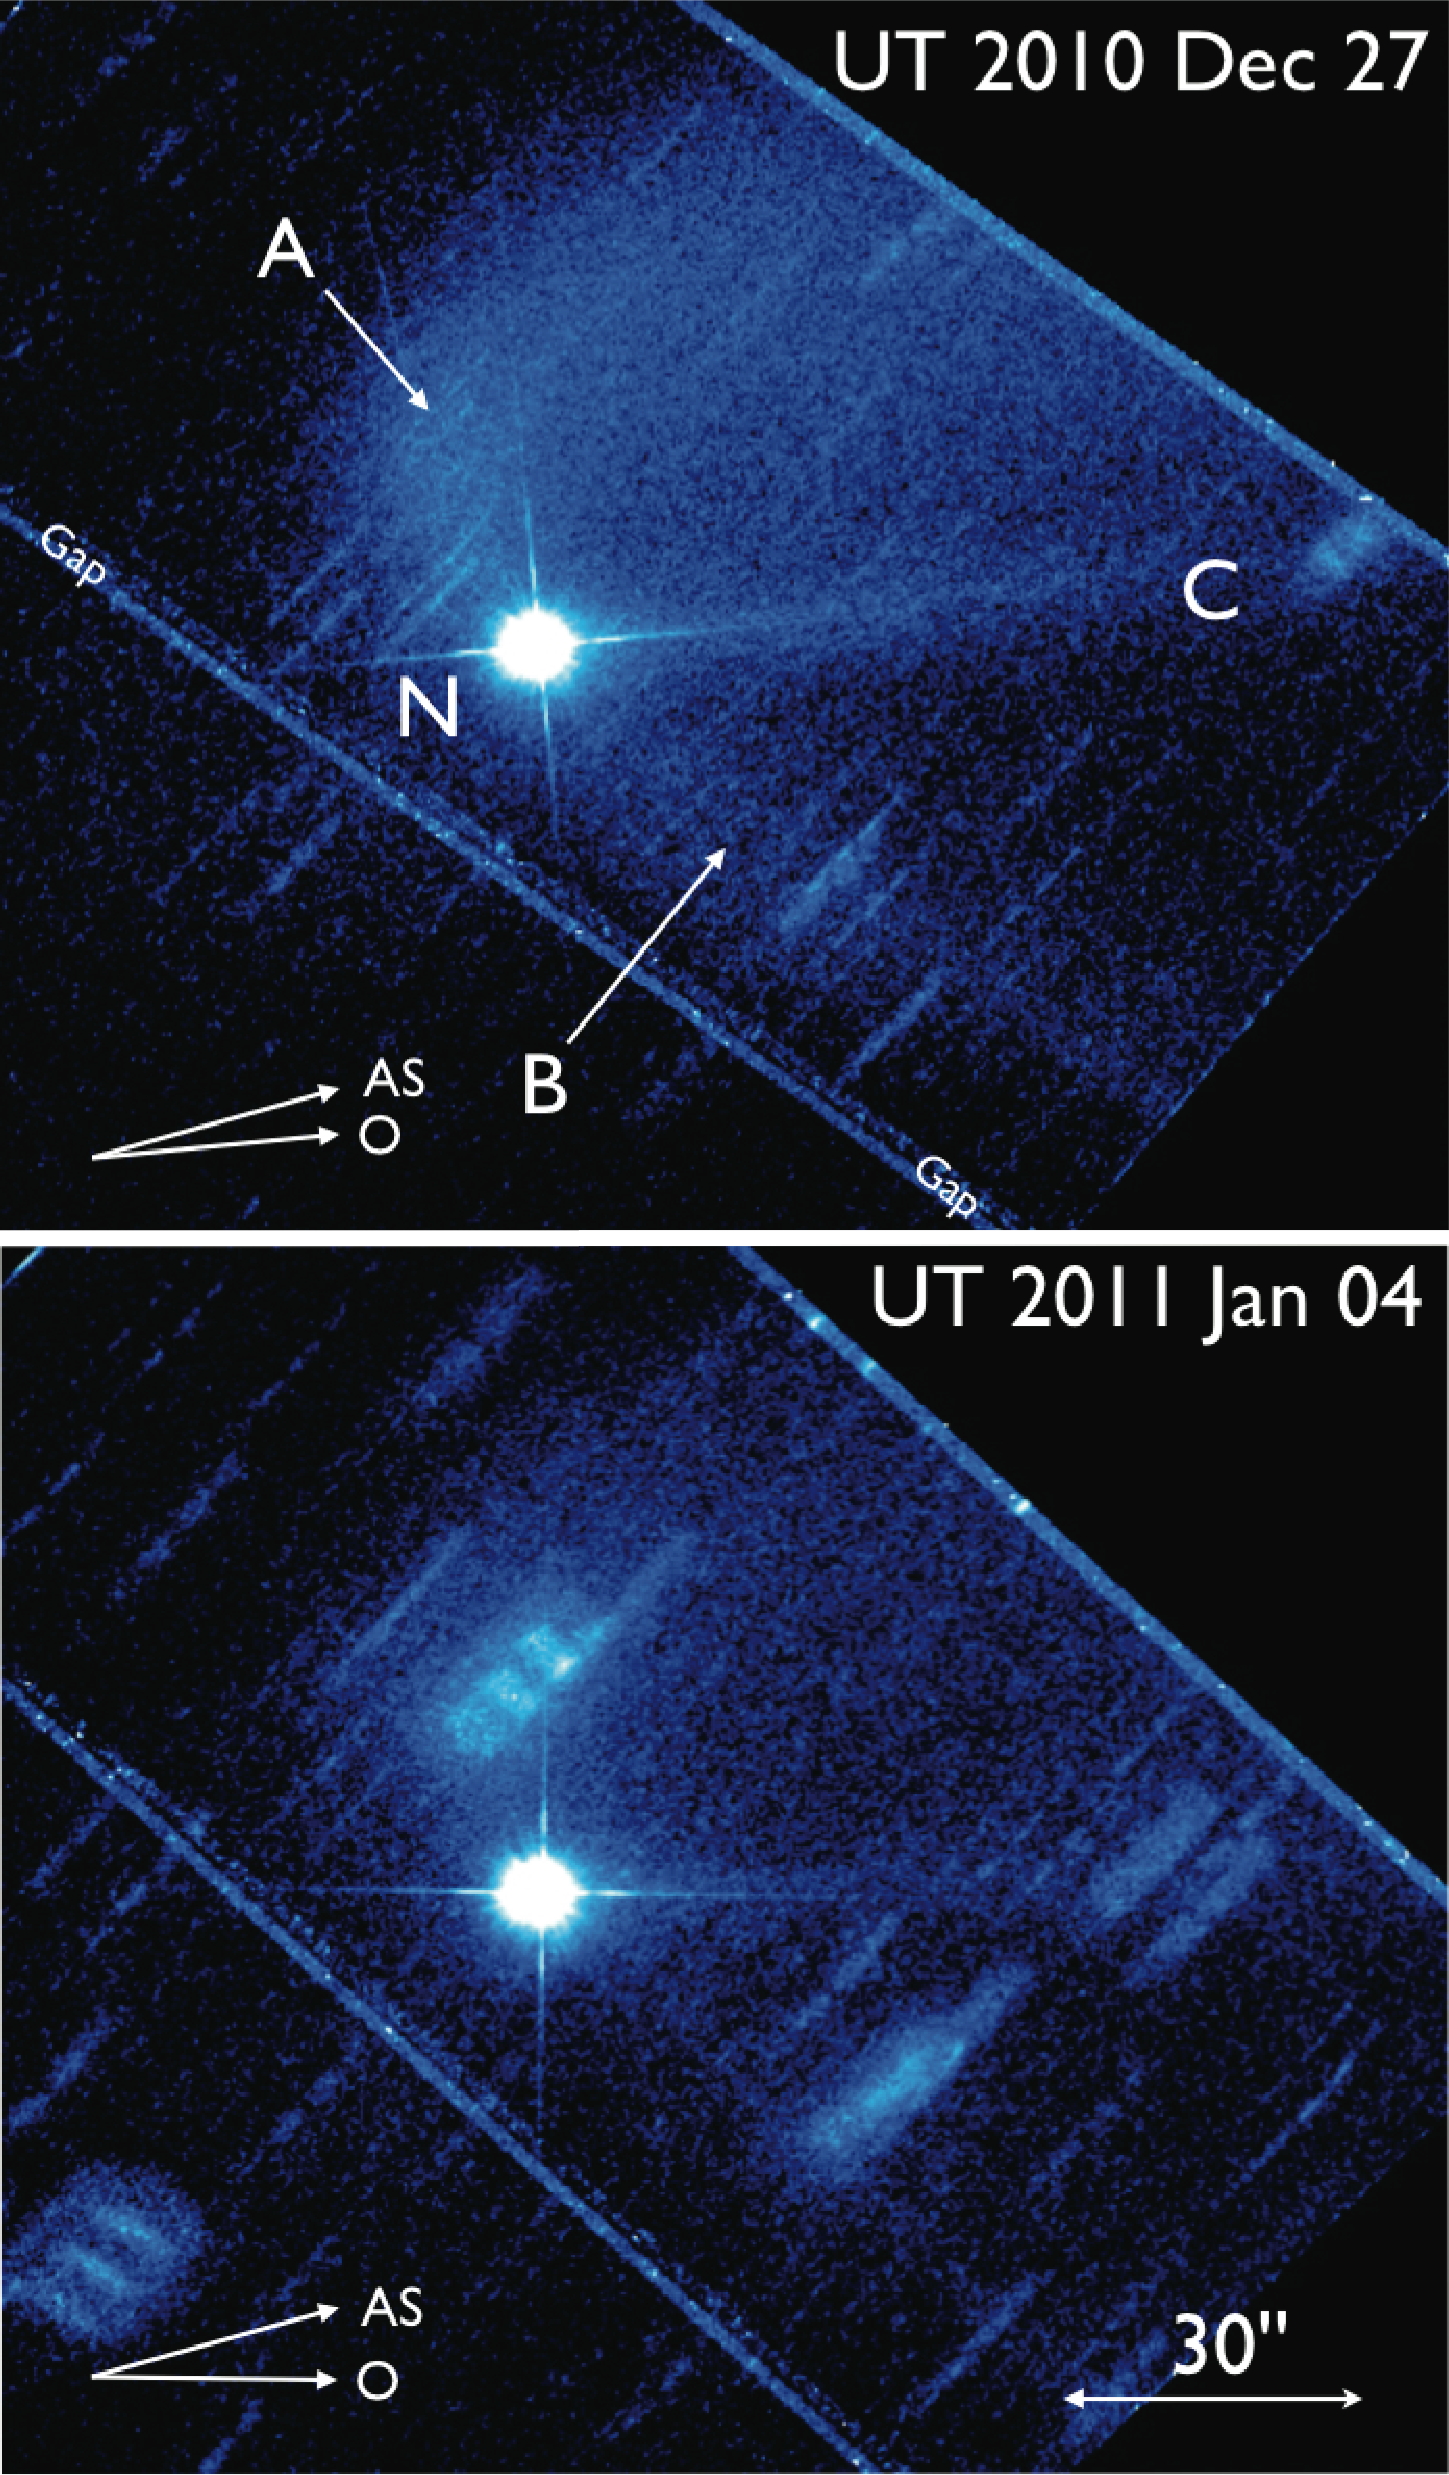
The images from each orbit were combined into composites having 24 s effective integration for the nucleus and 1560 s integration for the coma. The nucleus ( in Figure 2) was found to be point-like, with FWHM = 2.2 pixels (0.09). Photometry of the nucleus was obtained within a circular projected aperture of radius 0.4, with sky subtraction from a concentric annulus with inner and outer radii 0.6 to 0.8, respectively (Table 2). The absolute magnitude, , (the magnitude if observed from heliocentric and geocentric distances = = 1 AU and at phase angle = 0) is computed from
| (1) |
in which is the phase function. For the latter we adopt the formalism of Bowell et al. (1989), with = 0.0760.060 as found from pre-outburst observations (Warner 2010). As seen in Table 2, the nucleus apparent magnitude brightened by 0.12 mag in the 8 day interval between the HST observations, but this brightening is consistent with the changing observing geometry of the object, since = 8.850.02 remains constant. The derived absolute magnitudes from HST are consistent with the pre-outburst value, 8.840.04 (Warner 2010), showing that near-nucleus dust is insignificant.
On larger scales, the coma appeared diffuse and asymmetric, being brighter and more extended to the North than to the South of the nucleus on both visits ( and in Figure 2). The sunward extension of the coma was 10, corresponding to 16,000 km in the plane of the sky. The overall form of the coma suggests that dust particles launched sunwards are being slowed by solar radiation pressure and so are concentrated near their turn-around points, giving rise to a bright-edged parabola (Figure 2). We connect , the turn-around distance along the Sun-comet line to , the initial sunward particle speed from
| (2) |
where is the dimensionless radiation pressure factor and is the gravitational acceleration towards the Sun. (Strictly, the data provide only a lower limit to because of the effects of projection (the phase angle was 13, c.f. Table 1)). Substituting for we obtain
| (3) |
where is the gravitational constant, the heliocentric distance and the mass of the Sun. The characteristic ejection velocity must be , since slower particles should fall back to the nucleus under gravity. Substituting 60 m s-1 in Equation 3 we obtain 0.2. The magnitude of is inversely related to particle size; 0.2 is compatible with dielectric particles having radii 0.1 to 1 m (Bohren and Huffmann 1983). We conclude that the diffuse coma of Scheila is populated by small dust grains just like those in other comets at 3 AU. In this model, the characteristic travel time from the nucleus to the apex of motion is = , or = 5105 s (1 week), while the residence time in the HST field of view would be a month or more. We note that the rapid fading of the coma on timescales of approximately a month strongly suggests that we are not observing large (10 m) slow-moving grains in Scheila, in stark contrast to the situation for P/2010 A2 (Jewitt et al. 2010).
To measure the brightness of the surrounding coma, we first digitally removed field star and galaxy image trails that were not already cancelled by the image combination process. For this purpose we replaced afflicted pixels with the average pixel value measured in a surrounding region. The coma brightness was measured using a projected circular aperture 64 in radius, with sky subtraction from the median signal measured within a contiguous aperture having outer radius 80. The integrated magnitudes are brighter than the nucleus by about = 1.3 mag on Dec 27 but only by = 1.0 mag on Jan 04 (cf. Table 2). This 30% fading of the coma in the 8 days between measurements is broadly consistent with the timescale deduced above from radiation pressure sweeping, assuming the coma is not being continuously replenished.
We calculated the effective scattering cross-section of the coma from , where = = 1.0104 km2 is the geometric cross-section of the nucleus. We further calculated the mass of dust particles in the coma from the scattering cross-section using
| (4) |
where is the particle density, taken to be = 2000 kg m-3, and is the average particle radius in the coma. We take = 1 m, corresponding to the upper limit estimated above from radiation pressure effects. This size is consistent with the radiation pressure considerations discussed above and is also characteristic of optical observations of normal comets since much smaller particles are inefficient scatterers of optical photons while much larger particles are rare. The resulting dust cross-sections and masses are listed in Table 2. The computed mass in micron-sized grains is strictly a lower limit to the total mass, since large particles may hold significant mass while presenting negligible scattering cross-section. Both and decreased between December 27 and January 4 by about 30%, indicating that the escape of particles from the projected 64 radius photometry aperture substantially exceeded the supply of fresh particles from the nucleus in this period.
In addition to the diffuse coma, an approximately linear tail (the ``spike'') is evident (marked in Figure 2), with a position angle 277 on Dec 27 and 273 on Jan 04. The position angles are slightly different from both the antisolar direction (position angles 276 and 269 on Dec 27 and Jan 04, respectively) and the projected orbit (position angle 286 on both dates). Therefore, it is not possible to interpret the spike as a simple synchrone, as was done for P/2010 A2. Instead, it must consist of particles whose motion is determined by their initial velocity as well as radiation pressure.
We set upper limits to the allowable brightness of co-moving companions to Scheila by digitally adding scaled versions of the (unsaturated) nucleus. At projected distances 6 (10,000 km), any companion with 28 could not escape detection. Assuming that any companion has the same albedo as Scheila, a limit to the diameter of any secondary is set at 0.1 km.
3 Discussion
Two mechanisms considered previously as possible explanations for activity in main-belt comets are inoperable on Scheila, as a result of its large size and slow rotation. First, mass loss through rotational instability is ruled out by the measured rotational period, = 15.848 hr (Warner 2006). The latter greatly exceeds the critical period at which the centripetal acceleration at the surface of a sphere equals the gravitational acceleration, assuming a bulk density = 2000 kg m-3. Second, the ejection of grains through electrostatic charging of the surface can be ruled out since the speeds generated electrostatically (v 1 m s-1) (Rennilson and Criswell 1974) are far smaller than the 60 m s-1 escape speed from the nucleus. Another mechanism must be responsible for the ejection of dust.
The simplest explanation is that Scheila ejected material after being struck by another, much smaller, asteroid. This is the explanation proposed elsewhere for the inner-belt MBC P/2010 A2 (Jewitt et al. 2010). In this interpretation, the estimated dust mass (Table 2) gives a crude estimate of the impactor properties. The velocity dispersion amongst main-belt asteroids is 5 km s-1, about 102 times the escape velocity from Scheila. At such a high speed, experiments show that a projectile can excavate 103 times its own mass from the target. However, the bulk of the ejecta moves too slowly to escape. Specifically, the mass of the ejecta leaving with 10-2 is comparable to the impactor mass (Figure 4 of Housen and Holsapple 2011). Therefore, the impact hypothesis requires that Scheila be struck by a body having mass 4.4107 kg (Table 2). If also of density = 2000 kg m-3, the impactor diameter would have been 35 m and the kinetic energy of the impact 5.51014 J (about 0.1 MTonnes TNT equivalent). The resulting crater on Scheila would be of diameter 400 m.
Another possibility is that the coma is produced by sublimation of surface ice, as in 133P/Elst-Pizarro (Hsieh and Jewitt 2006). Radio spectral line observations limit the production rate from Scheila to log10Q 26.3 in the period December 14 - January 04, corresponding to mass production rates 6 kg s-1 in water (Howell and Lovell 2011). However, these production limits are model-dependent, and cannot exclude the possibility that Scheila outgassed more strongly at earlier times, launching dust from the surface by the action of gas drag forces.
The energy balance equation for sublimating ice may be written
| (5) |
in which = 1360 W m-2 is the Solar Constant, is the heliocentric distance expressed in AU, (m) is the nucleus radius, is the Bond albedo, is the emissivity, (K) the effective temperature of the nucleus, (J kg-1) the temperature-dependent latent heat of sublimation and (kg m-2 s-1) the rate of sublimation of the ice per unit area. Parameter in Equation (5) is a proxy for the surface temperature variation over the surface of the nucleus, itself dependent on the nucleus shape, thermal properties, rotation period and spin axis direction relative to the Sun. To solve Equation (5) requires additional knowledge of and . For this, we use the saturation vapor pressures and latent heat data for ice from Washburn (1926).
Allowable values of lie in the range 1 4. The high temperature limit, = 1, describes a flat plate oriented with its normal pointing towards the Sun, because then the absorbing and radiating areas are identical. This would approximate, for instance, the heating of the sunward pole on a nucleus whose spin-vector points towards the Sun. The cold limit, = 4, corresponds to an isothermal, spherical nucleus in which solar power is absorbed over an area but radiated from . True cometary nuclei probably possess intermediate effective values of . For example, a spherical nucleus with the Sun on the polar axis corresponds to = 2, while a nucleus with the Sun in the equator and with rotation so rapid as to maintain temperature along lines of constant latitude has = , and so on. The point is that the rotational and thermophysical properties of a nucleus are usually unknown, so that the effective value of , and thus the sublimation rate, cannot be accurately calculated.
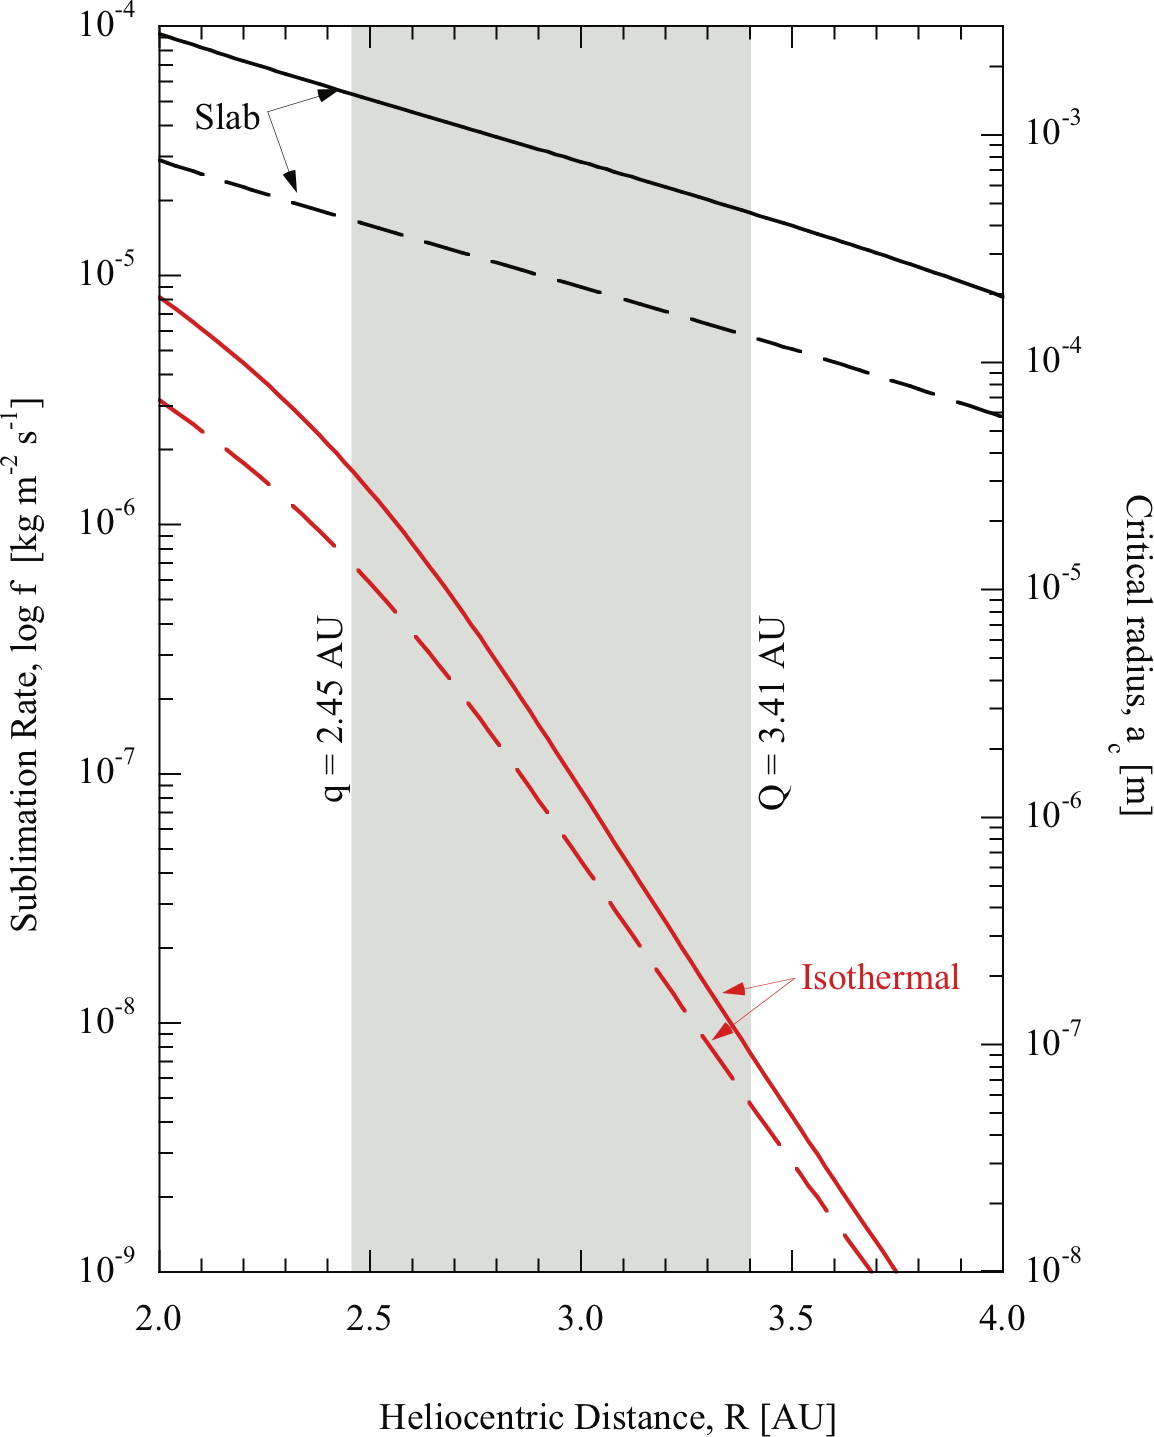
We used Equation (5) to calculate as a function of for spherical model comets with water ice exposed at the surface. We used = 0.03 and assumed = 0.9. The limiting values = 1 and = 4 were assumed in order to bracket the range of likely behaviors to be expected from the real comets. Results are shown in Figure (3) for 2 4 AU. Also shown in Figure (3) is the critical radius, , defined as the radius of the largest dust particle that can be ejected from Scheila against gravitational attraction to the nucleus, given sublimation at the rate computed from Equation (5).
Figure (3) shows that allowable temperature regimes on Scheila permit more than two orders of magnitude variation in the sublimation rate per unit area, from 310-5 kg m-2 s-1 in the hot case to 810-8 kg m-2 s-1 in the cold case, at = 3 AU. If we assume that the dust/gas ratio of ejected material is of order unity, and that the dust ejection occurred over a period of less than 1 month (2.5106 s), then the area of exposed ice needed to supply the 2107 kg coma mass is = 0.3 km2 in the high temperature case rising to = 100 km2 in the low temperature case. The surface area of Scheila is 40,000 km2, so that even sublimation from the larger area corresponds to only 0.25% of the surface.
The critical dust radius for ejection at 3 AU varies from about 10-4 m in the hot case to 610-6 m in the cold case. Thus, at this distance from the Sun, gas sublimated from exposed water ice is capable of launching dust particles above the escape speed no matter what the temperature regime on the surface. Even at aphelion and with the lowest plausible surface temperatures, sublimated ice can eject grains with 0.1 m, the minimum size for efficient scattering of optical photons. Therefore, both in terms of the area of exposed ice required, and in terms of the particle speeds induced by gas drag, ice sublimation is a plausible driver of the activity observed in Scheila at 3 AU, and potentially could supply observable coma at any position in the orbit.
The ice hypothesis has two problems, however. First, surface ice on Scheila is long-term unstable to sublimation and must be protected by a refractory mantle (Schorghofer 2008). What process exposed the ice in early December? The most obvious possible trigger is an impact which, by the discussion above, would need to expose an area of ice 0.3 km2 (corresponding to a circle 300 m in radius or larger). But, as discussed above, an impact this large could produce an impulsive coma as observed even without the need for a sublimating ice source.
Second, if ice sublimation is the driver of the activity, why does the coma fade on timescales of 8 days (7105 s)? At = 310-5 kg m-2 s-1, ice would recede into the surface by a distance = which, by substitution gives 0.01 m (1 cm). This is smaller than the diurnal thermal skin depth ( = 0.07 m [7 cm]) making it hard to see why the coma formation, once started, would so soon stop. For these two reasons, we conclude that the impact hypothesis provides the most simple and most likely explanation of the observed activity. Scheila now stands, after P/2010 A2, as the second example of an impact-activated main-belt comet.
4 Summary
From images of (596) Scheila obtained using the Hubble Space Telescope we find that:
-
1.
The coma has effective peak cross-section 2.2104 km2, is shaped by radiation pressure, and fades on a timescale consistent with radiation pressure clearing.
-
2.
The coma dust particles have radiation pressure factors 0.2, corresponding to micron-sized dielectric particles. The mass in micron-sized dust particles is 4107 kg.
-
3.
The scattering properties of the nucleus appear unchanged by the ejection of dust.
-
4.
No near-nucleus fragments or structures are apparent in the Hubble data.
-
5.
The measurements are consistent with dust ejection by impact into Scheila of a 35 m diameter projectile.
References
- Bohren & Huffman (1983) Bohren, C. F., & Huffman, D. R. 1983, New York: Wiley, 1983,
- Bowell et al. (1989) Bowell, E., Hapke, B., Domingue, D., Lumme, K., Peltoniemi, J., & Harris, A. W. 1989, Asteroids II, 524
- Bus & Binzel (2004) Bus, S., & Binzel, R. P. 2004, NASA Planetary Data System, 1, 1116
- Dahlgren & Lagerkvist (1995) Dahlgren, M., & Lagerkvist, C.-I. 1995, A&A, 302, 907
- Dressel et al (2010) Dressel, L., 2010. Wide Field Camera 3 Instrument Handbook, Version 3.0 (Baltimore: STScI)
- Housen & Holsapple (2011) Housen, K. R., & Holsapple, K. A. 2011, Icarus, 211, 856
- Howell & Lovell (2011) Howell, E. S., & Lovell, A. J. 2011, IAU Circ., 9191, 2
- Hsieh & Jewitt (2006) Hsieh, H. H., & Jewitt, D. 2006, Science, 312, 561
- Jewitt et al. (2010) Jewitt, D., Weaver, H., Agarwal, J., Mutchler, M., & Drahus, M. 2010, Nature, 467, 817
- Kalirai et al. (2009) Kalirai, J. et al. 2009. WFC3 instrument Science Report 2009-31 (Baltimore: STScI)
- Kresak (1980) Kresak, L. 1980, Moon and Planets, 22, 83
- Larson (2010) Larson, S. M. 2010, IAU Circ., 9188, 1
- Porco et al. (2005) Porco, C. C., et al. 2005, Science, 307, 1237
- Rennilson & Criswell (1974) Rennilson, J. J., & Criswell, D. R. 1974, Moon, 10, 121
- Schorghofer (2008) Schorghofer, N. 2008, ApJ, 682, 697
- Snodgrass et al. (2010) Snodgrass, C., et al. 2010, Nature, 467, 814
- Tedesco et al. (2002) Tedesco, E. F., Noah, P. V., Noah, M., & Price, S. D. 2002, AJ, 123, 1056
- Warner (2006) Warner, B. D. 2006, Minor Planet Bulletin, 33, 58
- Warner (2010) Warner, B. D. 2010, Central Bureau for Astronomical Telegrams, No. 2590 (December 15)
- Washburn (1926) Washburn, E. 1926, International Critical Tables of Numerical data, Physics, Chemistry and Technology, Vol. 3 (New York: McGraw-Hill).
| Instrument | UTaaUT Date of the observation | bbHeliocentric distance in AU | ccGeocentric distance in AU | ddPhase (sun-object-Earth) angle in degrees | eeOut-of-plane angle in degrees |
|---|---|---|---|---|---|
| WFC3/F606W/F621N | 2010 Dec 27.9 | 3.085 | 2.338 | 13.7 | -2.6 |
| WFC3/F606W/F621N | 2011 Jan 04.9 | 3.073 | 2.254 | 11.9 | -3.5 |
| Date | aaNucleus -band magnitude measured within a 0.4 radius aperture. The apparent V-band magnitude was computed from the observed count rate ``C" in electrons s-1) using , where = 24.45 for the F621M filter and 25.99 for the F606W filter (Kalirai et al. 2009). | bbAbsolute magnitude of the nucleus (Equation 1) | ccTotal -band magnitude measured within a 64 radius aperture | dd | eeEffective scattering cross-section in km2 | ffEffective dust mass, in kg |
|---|---|---|---|---|---|---|
| 2010 Dec 27.9 | 13.980.02 | 8.840.02 | 12.63 | 1.26 | 2.2104 | 4.4107 |
| 2011 Jan 04.9 | 13.860.02 | 8.860.02 | 12.86 | 1.00 | 1.5104 | 3.0107 |