The precession of the HH 111 flow in the infrared
Abstract
We present Spitzer IRAC images of the HH 111 outflow, that show a wealth of condensations/knots in both jet and counterjet. Studying the positional distribution of these knots, we find very suggestive evidence of a mirror symmetric pattern in the jet/counterjet flow. We model this pattern as the result of an orbital motion of the jet source around a binary companion. From a fit of an analytic, ballistic model to the observed path of the HH 111 system, we find that the motion in a binary with two stars (one of them being the HH 111 source), in a circular orbit with a separation of AU would produce the mirror symmetric pattern seen in the outflow.
1 Introduction
Over the past two decades considerable progress has been made in understanding the formation of stellar jets and their influence on the surrounding interstellar medium (see, e. g., Bally, Reipurth & Davis 2007; Arce et al. 2007). Nevertheless, some fundamental questions remain unanswered, mostly related with the nature of the acceleration and collimation of the jets themselves, the properties of the ’launch region’ and how both of these processes can be influenced by nearby objects, since many outflows arise from binary or multiple young stellar systems.
Since the discovery of HH 111 (Reipurth 1989) using standard narrow band imaging techniques to map the outflow in H and [S II] 6717/6731, HH 111 has become an icon of highly collimated stellar outflows, and has been the subject of a number of studies across the entire wavelength spectrum to determine the proper motions of their ’knots’ (Hartigan et al. 2001; Coppin, Davis & Micono 1998), kinematics (Reipurth, Raga & Heathcote 1992; Raga et al. 2002), ionization structure (Reipurth 1989; Davis, Hodapp & Desoches 2001; Nisini et al. 2002), circumstellar environment (Stapelfeldt & Scoville 1993; Yang et al. 2007), shock properties (Noriega-Crespo, Garnavich & Raga 1993; Morse et al. 1993), molecular flow morphology (Cernicharo & Reipurth 1996; Lefloch et al. 2007), and ejection history (Masciadri et al. 2002; Raga et al. 2002), among others. The original optical images were of the West lobe of HH 111, and the Eastern counterjet was later identified in the near infrared (NIR) (Gredel & Reipurth 1994; Davis, Mundt & Eislöffel 1994).
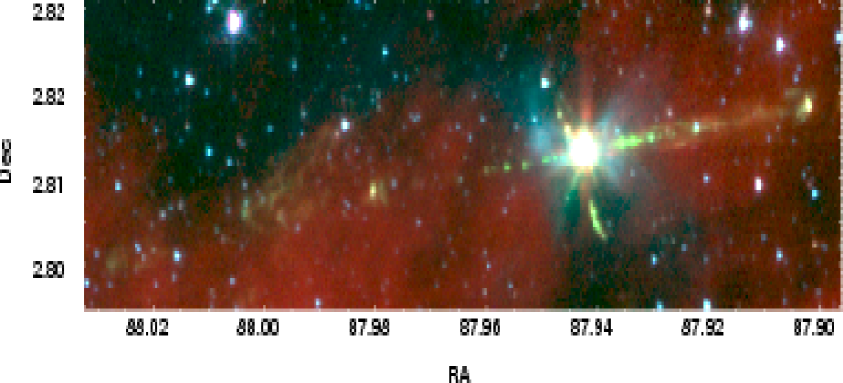
HH 111 lies in the L1617 cloud in Orion at a distance of pc and is oriented almost E-W (PA97.5°) with a length of 11′ in our IRAC images (see Fig 1). HH 111 is part of a quadrupolar flow (Reipurth et al. 1999; Rodríguez et al. 2008), with HH 121 arising nearly perpendicular (PA27.3°) to the HH 111 flow, suggesting that the VLA1 source is part of a close binary system. Reipurth et al. (1999) proposed that this binary could have a separation of 0″.1 ( 50 AU). Rodríguez et al. (2008) detect two elongated structures with a separation of 0″.036 ( 15 AU), which could correspond to the previously proposed binary.
Finally, we should note that HH 111 is the central region of a “giant HH jet”, with two lobes extending out to pc from the outflow source (Reipurth et al. 1997). The far ends of these lobes (HH 311 and HH 113, see Reipurth et al. 1997) show a point-symmetric deviation from the direction of the inner HH 111 outflow of . This change in direction between the inner and outer region of the HH 111 outflow is evidence for a precession of the outflow axis, with a period pc km s yr (considering the proper motion of km s-1 measured by Reipurth et al. 1997 for HH 311 and 113).
Recently, we have shown (Raga et al. 2011) that by using observations from the Spitzer Space Telescope (Spitzer) (Werner et al. 2004) in the mid-infrared, where the extinction is considerably lower than in the optical and near infrared, one can use the jet/counterjet symmetry to set some of the strongest constraints yet on the size of the jet formation region. In this study, we take advantage once again of the superb sensitivity and angular resolution of the Infrared Array Camera (IRAC) (Fazio et al. 2004) on board of Spitzer to study the positional distribution of the “knots” along the Herbig-Haro (HH) 111 flow, finding mirror symmetric deviations from the jet/counterjet axis. This is the first time that such a mirror symmetric pattern is seen in an HH outflow, which can be interpreted in terms of the presence of a binary outflow source.
2 Data
The observations of HH 111 are part of our original Spitzer General Observer (GO) program 3315 (PI Noriega-Crespo) obtained with IRAC and the infrared photometer MIPS (Rieke et al. 2004) in March 28, 2005. The data have been downloaded from the Spitzer Legacy Archive and the quality of the final images (Post Basic Calibrated Data or Post-BCD; S18.7 products) is outstanding, so that no further processing was required. The HH 111 outflow is part of a larger mosaic of the L1640 region obtained with IRAC in its four channels (1, 2, 3, 4) = (3.6, 4.5, 5.8 & 8.0 m) covering a FOV of ′ (the result of a 54 array map with a 260″ stepsize) and with a total integration time per pixel of 360 sec, using 30 sec High Dynamic Range (HDR) exposures. The final images are sampled with 0.6″ per pixel, nearly one third of the standard ″ IRAC angular resolution.
The IRAC images (Fig 1.), in comparison with the published NIR images (e.g. Davis, Mundt & Eislöffel 1994; Fig 5), display a similar morphology, but given their higher signal-to-noise and lower extinction permit us to define better the knots and identify a couple more on each side close to the VLA1 source. Like in other protostellar outflows observed with Spitzer (e.g., Noriega-Crespo et al. 2004; Looney, Tobin & Kwon 2007; Tobin et al. 2007; Ybarra & Lada 2009; Raga et al. 2011) HH 111 is brighter in channel 2, although it is well detected in all 4 IRAC channels. The emission is most likely dominated by the H2 pure rotational lines (De Buizer & Vacca 2010).
In the following we describe the emission peaks as condensations and/or knots. It is clear from the HST images at high angular resolution that many of these structures are bowshock-like (working surfaces) and that they can overlap one another. We use the intensity peaks to define the HH 111 flow. The measurements of the positions of the condensations/knots were carried out using the IRAF imexam routine interactively on the IRAC channel 2 image. For compact “knots” a two-dimensional gaussian was used for determining their centroids; for the more diffuse structures, we use the position of the pixel with the peak emission. The uncertainty of the centroids ranges from 0.1 to 0.3 of a fraction of a pixel for the bright and fainter knots, respectively. Since the “knots” are compact in most cases, we measured the flux densities using a circular aperture and an aperture correction. For the compact “knots” we used a 2.4″ radius for the photometric measurements with a 1.221 aperture correction; the background was measured off the jet/counterjet flow axis. For 7 “knots” that were obviously more extended or irregular than this aperture ( steradian area) a comparable polygonal area was used without an aperture correction. Some of these “knots” do have a low surface brightness, but it was still possible to measure the flux density and centroid.
In Table 1 we give the relative positions in (along the outflow axis) and (perpendicular to the outflow axis) with respect to the central source, VLA1 at RA=05:51:46.25 and Dec=02:48:29.5 (Reipurth et al. 1999) of the“knots” seen along the jet and the counterjet. Table 1 contains also their RA and Dec coordinates, flux density and uncertainty (both in mJy).
3 The mirror symmetry of the HH 111 jet/counterjet system
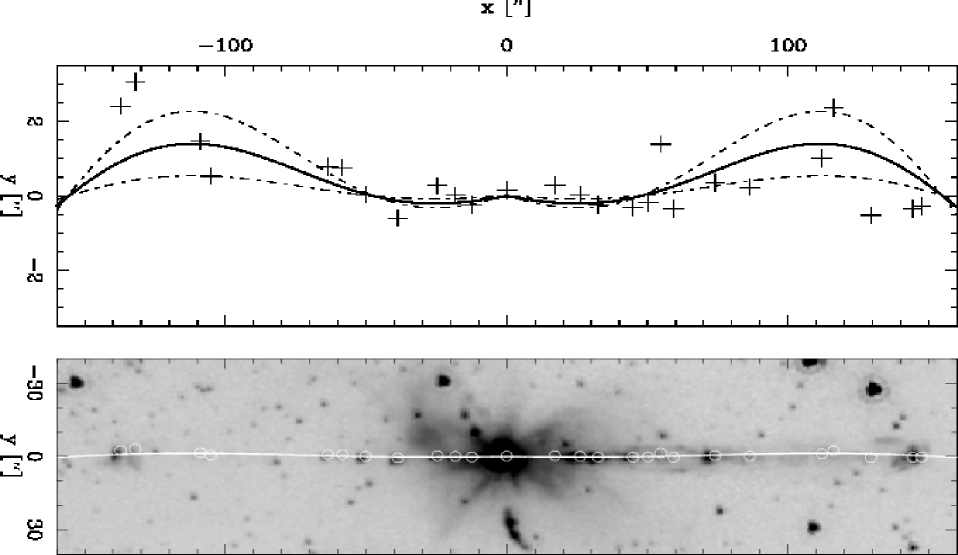
Figure 2 shows the inner region of the HH 111 outflow (top) with the measured positions of the knots with respect to the VLA1 source. The bottom plot shows the knot positions with an expanded -coordinate. It is clear that both the jet and the counterjet show an excursion in the -direction at a distance of from the source, and an excursion in the -direction at from the source. These excursions could be part of a mirror symmetric spiral shape with a step of .
These mirror-symmetric excursions of the jet/counterjet system could possibly be the effect of an orbital motion of the outflow source. Ballistic flows from sources in circular and elliptical orbits were described by Masciadri & Raga (2002) and González & Raga (2004), respectively.
For a ballistic flow, the path of the beam of a constant velocity jet ejected parallel to the orbital axis (of an outflow source in a circular orbit) is given by :
| (1) |
| (2) |
where is the axial coordinate, are axes parallel to the orbital plane, is the orbital phase, is the orbital period and is the ratio between the orbital and the jet velocities. As can be seen from a comparison of Equations (1-2) with the results presented by Masciadri & Raga (2002), in these equations we have considered that the orbital radius is negligibly small compared to and .
From Equation (1), we calculate the predicted locus of the jet/counterjet structure, and project it onto the plane of the sky, assuming an angle of between the orbital axis and the plane of the sky (Reipurth et al. 1992), and that the -axis is parallel to the plane of the sky). We then carry out a least squares fit in order to obtain the values of the model parameters that best fit the HH 111 jet/counterjet locus within from the outflow source. The results of the fit are shown in the left panel of Figure 2.
The following parameters are obtained from the fit :
-
1.
an orbital phase . This result implies that the line joining the two stars of the binary outflow source currently lies close to the line of sight,
-
2.
a spiral step . For a distance of 414 pc to HH 111 this corresponds to a distance of cm. Also, from the proper motions measured by Hartigan et al. (2001), we see that the knots at along the jet (corresponding to the first sideways excursion in the jet path, see Figure 2) have a spatial velocity km s-1. From Equation (3) we then obtain an orbital period yr,
- 3.
We now use the relation (valid for a circular orbit) between the mass of the jet source , the mass of the companion , the orbital period and the orbital radius (of the jet source) :
| (4) |
where the three values in the third term correspond to (the lower limits for and , see above), (the values that result in the lowest ) and (the upper limits).
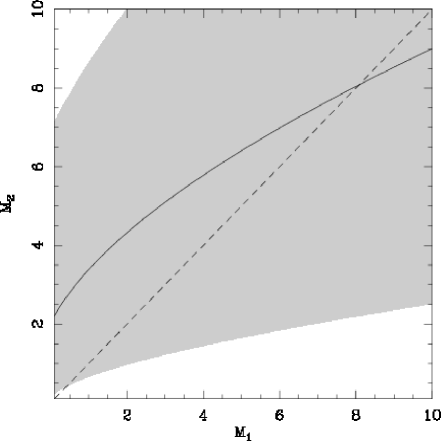
Each of the three values of the third term of Equation (4) corresponds to a curve in the vs. plane, which are shown in Figure 3. Together with the condition (i.e. assuming that the source of the strong HH 111 outflow is the more massive star of the binary), we then obtain an allowed region for the masses of the HH 111 source binary.
From Figure 3, we see that the observed shape of the HH 111 jet/counterjet system is consistent with a binary with two M⊙ stars. Such a mass is consistent with the masses of T Tauri stars.
If we consider M⊙ (consistent with the curved shape of the HH 111 system, see Figures 2 and 3) and yr, from the equations of a circular orbit we then obtain a separation AU between the two stars in the binary. Given that the orbial phase derived from the fit implies that the stars in the binary are closely aligned with the line of sight, the projected separation between the stars would be substantially smaller than 186 AU.
4 Summary and conclusions
We have presented new IRAC images of the HH 111 outflow. These images show chains of aligned knots along the jet and the counterjet. We have carried out astrometric measurements of the positions of these knots, and have also determined their fluxes in the IRAC 2 (4.5 m) channel.
The jet/counterjet knots within from the outflow source show mirror symmetric deviations from the outflow axis, which can be interpreted as the effect of an orbital motion of the outflow source. If we fit the observed shape of the projected path of HH 111 with a ballistic jet model (Masciadri & Raga 2002), we find that the observations imply the existence of a binary with a yr period, and an orbital velocity km s-1. This range of periods and orbital velocities would be consistent with a binary formed by two M⊙ stars, with a separation of AU. The model fit also implies that the stars are currently quite closely aligned with the line of the sight, so that this separation might be consistent with the considerably lower projected separation implied by the observations of Rodríguez et al. (2008).
Interestingly, the orbital period that we determine ( yr, see above) is times smaller than the precession period implied by the point-symmetrical “HH 111 giant jet” (see Reipurth et al. 1997 and the discussion at the end of section 1). The resulting ratio is consistent with the predictions from the precessing accretion disk models of Terquem et al. (1999).
Raga et al. (2009) pointed out that the models of Terquem et al. (1999) implied that outflows from binary sources would have mirror symmetries close to the outflow source (due to the orbital motion) and point symmetries at larger distances (if the ejection direction follows the disk precession). Our new observations show that the HH 111 jet/counterjet system has mirror symmetry within from the source. This result, combined with the point symmetry of the HH 111 giant jet (Reipurth et al. 1997) is the first evidence ever of an astrophysical jet with the predicted flip in types of symmetry between regions close to and far away from the outflow source.
It is evident that the mirror symmetric, side-to-side excursions of the HH 111 jet/counterjet are a quite subtle effect. If our interpretation of these deviations were incorrect, we would not expect that a comparison with a model of an outflow from an orbiting source would give us reasonable masses for the binary components. However, we find that a binary with two stars and a separation of AU produces the observed spiral shape of HH 111. This completely reasonable result is a strong indication that we might indeed be interpreting the data correctly (see also the case for HH 211 by Lee et al. 2010).
References
- (1)
- (2) Arce, H.G. et al. 2007 in “Protostars and Planets V” B. Reipurth, D. Jewitt & K. Keil eds. University of Arizona Press, p. 245
- (3) Bally, J., Reipurth, J., & Davis, C.J. 2007 in “Protostars and Planets V”, B. Reipurth, D. Jewitt & K. Keil (eds). University of Arizona Press, p. 215
- (4) Cernicharo, J. & Reipurth, B., 1996, ApJ, 460, 57
- (5) Coppin, K. E. K., Davis, C. J. & Micono, M. 1998, MNRAS, 301, 10
- (6) Davis, C. J., Mundt, R., & Eislöffel, J. 1994, ApJ, 437, 55
- (7) De Buizer, J. M. & Vacca, W. D. 2010, AJ, 140, 196
- (8) Fazio, G. et al. 2004, ApJS, 154, 10
- (9) González, R. F., Raga, A. C., 2004, RMxAA, 40, 61
- (10) Gredel, R. & Reipurth, B. 1994, A&A, 289, 19
- (11) Hartigan, P. et al. 2001, ApJ, 559, L157
- (12) Lee, Ch.-F. et al. 2010, ApJ, 713, 731
- (13) Lefloch, B. et al. 2007, ApJ, 658, 498
- (14) Looney, L. W., Tobin,J.J., Kwon, W. 2007, ApJ, 670, 131
- (15) Masciadri, E. et al. 2002, ApJ, 573, 260
- (16) Masciadri, E., Raga, A. C., 2002, ApJ, 568, 733
- (17) Nisini, B. et al. 2002, A&A, 393, 1035
- (18) Noriega-Crespo, A., Garnavich, P.M & Raga, A.C. 1993, AJ, 106, 1133
- (19) Noriega-Crespo et al. 2002, AAS, 20114202
- (20) Noriega-Crespo, A. et al. 2004, ApJS, 154, 352
- (21) Raga, A. C., et al. 2002, A&A, 395, 647
- (22) Raga, A. C. et al. 2002, ApJ, 565, 29
- (23) Raga, A. C., Esquivel, A., Velázquez, P. F., Cantó, J., Haro-Corzo, S., Riera, A., Rodríguez-González, A. 2009, ApJ, 707, L6
- (24) Raga, A. C. et al. 2011, arXiv:0184183
- (25) Reipurth, B. 1989 Nature, 340, 44
- (26) Reipurth, B., Raga, A. C., Heathcote, S. 1992, ApJ, 392, 145
- (27) Reipurth et al. 1999, A&A, 352, L83
- (28) Rieke, G. H. et al. 2004, ApJS, 154, 25
- (29) Rodríguez, L. F. et al. 2008, AJ, 136, 1852
- (30) Stapelfeldt, K. R. & Scoville, N. Z. 1993, 408, 239
- (31) Terquem, C., Eislöffel, J., Papaloizou, J. C. B., Nelson, R. P. 1999, ApJ, 512, L131
- (32) Tobin, J. J., Looney, L. W., Mundy, L. G., Kwon, W., Hamidouche, M. 2007, ApJ, 659, 1404
- (33) Yang, J. et al. 1997, ApJ, 475, 683
- (34) Ybarra, J. E., Lada, E. A. 2009, ApJ, 695, 12
- (35) Werner, M. W. et al. 2004, ApJS, 154, 1
| (″) | (″) | RA(°) | Dec(°) | F(mJy) | Unc(mJy) |
|---|---|---|---|---|---|
| 0.00 | 0.00 | 87.9426 | 2.8084 | 123.89 | 12.39 |
| -12.39 | -0.40 | 87.9460 | 2.8078 | 0.69 | 0.07 |
| -18.25 | -0.14 | 87.9476 | 2.8076 | 0.46 | 0.05 |
| -24.67 | 0.12 | 87.9494 | 2.8075 | 0.32 | 0.03 |
| -38.78 | -0.75 | 87.9533 | 2.8067 | 0.18 | 0.02 |
| -50.28 | -0.09 | 87.9564 | 2.8065 | 0.21 | 0.02 |
| -58.53 | 0.60 | 87.9587 | 2.8064 | 0.06 | 0.01 |
| -63.61 | 0.63 | 87.9601 | 2.8062 | 0.13 | 0.01 |
| -105.40 | 0.39 | 87.9716 | 2.8045 | 0.02 | 0.01 |
| -109.17 | 1.32 | 87.9727 | 2.8047 | 0.03 | 0.01 |
| -132.28 | 2.92 | 87.9791 | 2.8042 | 0.37aaOver a steradian area | 0.04 |
| -137.47 | 2.27 | 87.9805 | 2.8039 | 0.91bbOver a steradian area | 0.09 |
| -199.16 | -1.37 | 87.9973 | 2.8006 | 0.22ccOver a steradian area | 0.02 |
| -202.54 | 8.10 | 87.9986 | 2.8031 | 0.11 | 0.01 |
| -208.84 | 8.47 | 88.0004 | 2.8029 | 0.11 | 0.01 |
| -219.96 | 8.22 | 88.0034 | 2.8024 | 0.19 | 0.02 |
| -221.45 | 3.17 | 88.0036 | 2.8010 | 0.21 | 0.02 |
| -236.14 | -5.11 | 88.0074 | 2.7982 | 0.05 | 0.01 |
| -293.33 | -9.45 | 88.0230 | 2.7948 | 0.06 | 0.01 |
| -309.59 | -6.21 | 88.0275 | 2.7951 | 0.09 | 0.01 |
| 0.00 | 0.00 | 87.9426 | 2.8084 | 123.89 | 12.39 |
| 17.12 | 0.14 | 87.9379 | 2.8090 | 0.62 | 0.06 |
| 26.18 | -0.13 | 87.9354 | 2.8093 | 2.82 | 0.28 |
| 32.60 | -0.23 | 87.9336 | 2.8095 | 2.50 | 0.25 |
| 44.99 | -0.45 | 87.9302 | 2.8099 | 0.67 | 0.07 |
| 50.34 | -0.33 | 87.9288 | 2.8101 | 0.20 | 0.02 |
| 54.88 | 1.25 | 87.9276 | 2.8107 | 0.18 | 0.02 |
| 59.41 | -0.50 | 87.9263 | 2.8104 | 0.16 | 0.02 |
| 74.28 | 0.20 | 87.9222 | 2.8112 | 1.61ddOver a steradian area | 0.16 |
| 86.57 | 0.08 | 87.9188 | 2.8116 | 0.14 | 0.01 |
| 112.24 | 0.86 | 87.9118 | 2.8128 | 0.10 | 0.01 |
| 116.44 | 2.22 | 87.9107 | 2.8133 | 0.10 | 0.01 |
| 129.70 | -0.68 | 87.9069 | 2.8130 | 0.09 | 0.01 |
| 144.64 | -0.49 | 87.9028 | 2.8136 | 0.71eeOver a steradian area | 0.07 |
| 147.73 | -0.43 | 87.9020 | 2.8137 | 1.77 | 0.18 |
| 167.50 | -2.07 | 87.8965 | 2.8140 | 0.07ffOver a steradian area | 0.01 |
| 226.05 | -5.10 | 87.8803 | 2.8154 | 0.04ggOver a steradian area | 0.01 |