119–126
The large-scale structure
in the Chandra Deep Field South
Abstract
We have studied the large scale distribution of matter in the Chandra Deep Field South on the basis of photometric redshifts and we have identified several over-densities between redshift 0.6 and 2.3. We analyse two of these structures using the deepest X-ray observations ever obtained: 4 Ms with the Chandra satellite and 2.5 Ms with XMM-Newton. We set a very faint upper limit on the X-ray luminosity of a structure at redshift 1.6, and we find an extended X-ray emission from a structure at redshift 0.96 of which we can estimate the gas temperature and make a comparison with the scaling relations between the X-ray luminosity and mass or temperature of high redshift galaxy clusters.
keywords:
galaxies: clusters: general, X-rays: galaxies: clusters1 Introduction
Being the largest and most massive bound structures in the Universe, galaxy clusters provide the most biased environment for galaxy evolution. Thus, they are ideal laboratories for studying the physical processes responsible for galaxy formation and evolution. With optical selection, it is relatively easy to obtain large statistical samples of clusters. The main disadvantage is that these samples are seriously affected by projection effects. Only expensive spectroscopic campaigns can confirm overdensities in 3 dimensions. The X-ray detection is more robust against line-of-sight contamination, but it has a lower efficiency and higher observational cost as compared to optical surveys. Studying the X-ray properties of optically selected clusters is essential to understand the selection effect. On one hand, extremely deep X-ray surveys with Chandra and XMM-Newton, make the detection of the highest redshift cluster possible, on the other hand they are also extending the minimum luminosity, i.e. the least massive structures, to which X-ray clusters can be detected and analyzed at intermediate redshifts. Galaxy groups and clusters with 3 keV are more likely to display the effects of non gravitational energy into the intracluster medium (ICM) than hotter, more massive clusters.
In previous studies we have proposed a ”(2+1) Dimensions” method, based on photometric redshifts ([Trevese et al. (2007)]), to detect overdensities in the large scale distribution of galaxies, down to the faintest limits attainable nowadays with optical wide-band photometric surveys. A comprehensive study of the Chandra Deep Field South (CDFS) allowed us to detect 12 overdensities with redshifts in the range ([Castellano et al. (2007)], [Salimbeni et al. (2009)]).
We present preliminary results of the analysis of the deepest X-ray images available to date, from the 4 Ms Chandra observations of the CDFS recently made public by the Chandra X-ray Center, and 2.5 Ms XMM-Newton observations ([Comastri et al. (2011)]), restricted to two over-densities, with spectroscopic redshifts z=0.96 and z=1.6 respectively.
In the following we adopt =70 km s-1Mpc-1, =0.3, =0.7
2 Observations
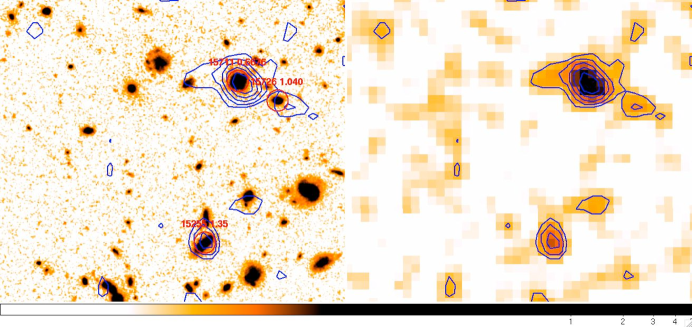
The over-density at z=1.61 All of the three X-ray sources detected in the area of the over-density at , correspond to objects identified in the GOODS-MUSIC catalogue ([Grazian et al. (2006)]), with redshifts 0.67, 1.04 and 1.35, thus not belonging to the structure at z=1.61 (Fig. 1). Eliminating these sources, we obtain a upper limit to the flux erg/cm2/s which corresponds to a bolometric luminosity erg/s, for = 3keV. [Kurk et al. (2009)] provided new spectroscopic redshifts, analysed the velocity distribution and estimated a virial mass . Assuming a typical density profile we can convert the mass to , where is the mass within a sphere with a mean inner density 500 times the critical density .
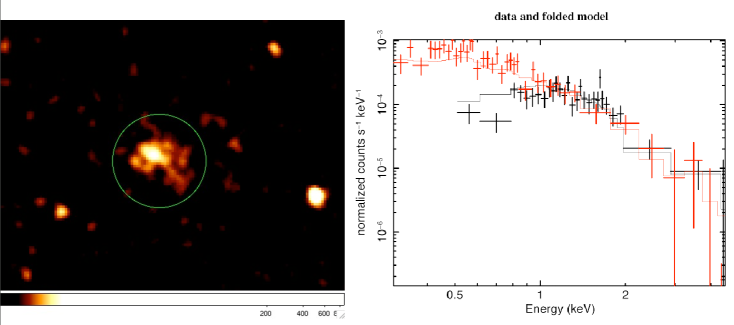
The over-density at z=0.96 An extended source is detected in the region of the overdensity at z=0.96 (Fig. 2). The peak of the X-ray emission coincides with a normal galaxy at z=0.96 with no emission lines ([Szokoly et al. (2004]). Notice that this implies a revision of the earlier classification of the X-ray source as Type 2 AGN.
Considering the extended character of the emission and the absence of AGN detections in the cluster area, we fitted simultaneously the Chandra and XMM-Newton X-ray spectra with a MEKAL model, with an abundance =0.3, obtaining a temperature keV (1 error) (Fig. 2).
From 11 redshifts available in the cluster area, the velocity dispersion is =420 Km/s, which would corresponds to a virial mass:
or to , assuming complete relaxation and following [Kurk et al. (2009)].
The M-T scaling relation obtained by [Popesso et al. (2005)] for clusters with mean redshift : would give, instead , possibly suggesting an evolution of the M-T relation from to .
3 Results
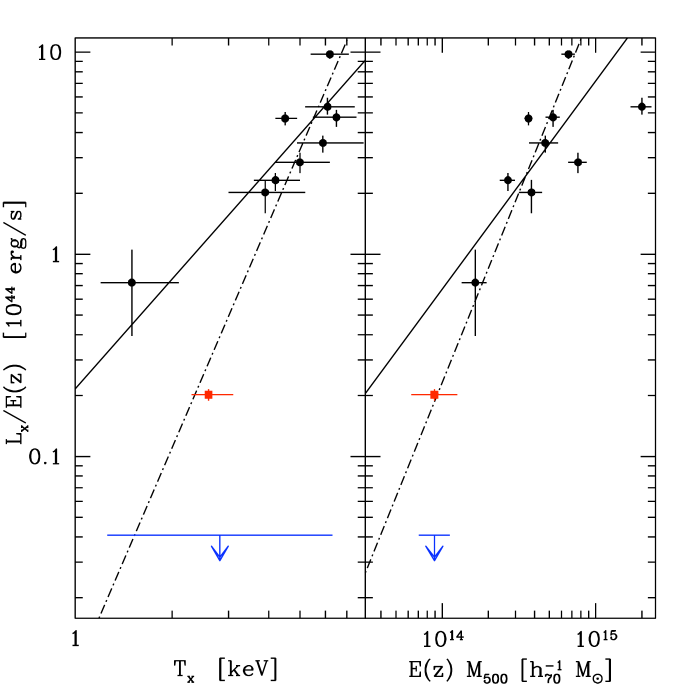
In figure 3 we compare our results with the and scaling relations obtained: i) by [Hicks et al. (2008)] for high redshift clusters with , optically selected by the Red-Sequence Cluster Survey (RCS) ([Gladders et al. (2005)]); ii) by [Ettori et al. (2004)] for X-ray selected clusters in the range .
-
•
For the structure at z=1.61 we indicate our upper limit on , while for the unknown temperature we indicate the range 1.2-6 keV. In both diagrams the structure is underluminous with respect to the scaling relations. This suggests it is a forming cluster which did not reach full relaxation.
-
•
The structure at z=0.96 is consistent with the steeper scaling relations of [Ettori et al. (2004)] and not with those of [Hicks et al. (2008)], despite it was selected in the optical band.
-
•
For the other structures we identified in the CDFS ([Castellano et al. (2007)], [Salimbeni et al. (2009)]) the analysis of the deepest X-ray data existing to date is in progress.
-
•
The present result, if confirmed, would strengthen the evidence of a strong redshift evolution of the scaling relation, of the type found by Ettori et al. 2004.
-
•
The detection of very low X-ray luminosity objects among optically selected structures could be related to the fact that our ”(2+1) D” method ([Trevese et al. (2007)]), unlike the RCS, is independent of the presence of a red sequence, which tends to be less evident at high redshift.
References
- [Castellano et al. (2007)] Catellano, M., Salimbeni, S., Trevese, D., Grazian, A. et al. 2007, ApJ, 671, 1497
- [Comastri et al. (2011)] Comastri, A., Ranalli, P., Iwasawa, K. et al. 2011, A&A, 526, L9, in press [arXiv:1012.4011]
- [Ettori et al. (2004)] Ettori, S., Tozzi, P., Borgani, S., & Rosati, P. 2004, A&A, 417, 13
- [Gladders et al. (2005)] Gladders, M. D., & Yee, H. K. C. 2005, ApJS, 157,1
- [Grazian et al. (2006)] Grazian, A., Fontana, A., de Santis, C., Nonino, M. et al. 2006, A&A, 449, 951
- [Hicks et al. (2008)] Hicks, A.K., Ellingson, E., Bautz, M., Cain, B., et al. 2008, AJ, 680, 1022
- [Kurk et al. (2009)] Kurk, J., Cimatti, A., Zamorani, G., Halliday, C., et al. 2009, A&A, 504, 331
- [Salimbeni et al. (2009)] Salimbeni, S., Castellano, M., Pentericci, L., Trevese, D. et al. 2009, A&A, 501, 865
- [Popesso et al. (2005)] Popesso, P, Biviano, A., B hringer, H., Romaniello, M., & Voges, W. 2005, A&A, 433, 431
- [Trevese et al. (2007)] Trevese, D., Castellano, M., Fontana, A., & Giallongo, E. 2007, A&A, 463, 853
- [Szokoly et al. (2004] Szokoly,G.P., Bergeron, J., Hasinger, G.,Lehmann, I., et al. 2004, ApJS, 155, 271