The Swift Supergiant Fast X-ray Transients Project: recent results
Abstract:
We present an overview of our Supergiant Fast X-ray Transients (SFXT) project, that started in 2007, by highlighting the unique observational contribution Swift is giving to this exciting new field. By means of outburst detection with Swift/BAT and follow-up with Swift/XRT, we demonstrated that while the brightest phase of the outburst only lasts a few hours, further significant activity is observed at lower fluxes for a considerably longer (weeks) time. After intense monitoring with Swift/XRT, we now have a firm estimate of the time SFXTs spend in each phase. The 4 SFXTs we monitored for 1–2 years spend between 3 and 5 % of the time in bright outbursts. The most most probable flux level at which a random observation will find these sources, when detected, is – erg cm-2 s-1 (unabsorbed), corresponding to luminosities of a few to a few erg s-1. Finally, the duty-cycle of inactivity ranges between 19 and 55 %.
1 Introduction
Supergiant fast X–ray transients (SFXTs) are a recently discovered class of transient High-Mass X–ray Binaries (e.g. [1]) probably hosting a neutron star accretor, whose optical counterparts are blue supergiant stars. Their X–ray outbursts, that last a few hours in the hard X–ray band, are about 4 orders of magnitude brighter than their quiescent state (peak luminosities of – erg s-1 [1, 2], versus quiescent erg s-1, e.g. [3, 4]). The physics of the bright outbursts is still being debated, and it is probably related to either the properties of the wind from the supergiant companion [3, 5, 6, 7] or to the presence of a centrifugal or magnetic barrier [8, 9]. In this paper we shall present an overview of our SFXT project111http://www.ifc.inaf.it/sfxt/ , that started about four years ago, and thus highlight the unique observational contribution Swift [10] is giving to this exciting new field.
2 The Swift contribution
Why Swift? Swift has unique characteristics that make it particularly well-suited to study both the SFXT bright outbursts and the fainter out-of-outburst states. Indeed, it combines a fast-slewing capability and a broad-band energy coverage, so that it can easily catch outbursts from these fast transients in their very early stages and study them panchromatically as they evolve in time. These are paired with a unique flexible observing scheduling, which allows monitoring efforts that cover all phases of their lives with a high sensitivity in the soft X-ray regime.
Before 2007 most observations of SFXT outbursts were fortuitous (e.g. [3]). At the time, IGR J112155952 was the only SFXT with periodic outbursts [11], and this gave us an unprecedented opportunity to actually plan to observe the first available outburst, that was predicted to occur on 2007 Feb 9. We performed a target of opportunity (TOO) Swift/X–ray Telescope (XRT, [12]) monitoring campaign [13] and could follow the event for 23 days and for three orders of magnitude in flux, from non-detection up to the peak of the outburst at erg s-1, and back down until it disappeared again below our detection limits (Figure 1).
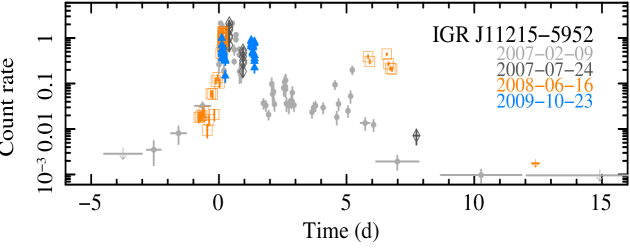
The surprising discovery was that while the bright outburst does last only a few hours, further significant activity (hence accretion onto the compact object) is seen at lower fluxes for a considerably longer (weeks) time. A further Swift contribution is the determination of the orbital period of d [7, 14] (the INTEGRAL period was 330 d, [11]), a rare instance, as orbital periods are generally found from all-sky monitor data.
Since 2007, Swift has devoted considerable observing time to perform a systematic study of SFXTs, with a strategy that combined monitoring programs with outburst follow-up observations. Our sample for long term monitoring consists of 4 targets, chosen among the 8 SFXTs known at the time and it includes, as ordered in Table 1, one object that triggered the Swift/Burst Alert Telescope (BAT; [16]) previously, the two prototypes of the class, and a pulsar. Starting on 2007 Oct we observed them two to three times a week for 1–2 ks each. Table 1 reports observing date ranges (col. 2), number of observations (col. 3), and total on-source times (col. 4). For this project, the BAT on-board catalog was modified to allow the BAT to trigger on all known and candidate SFXTs as if they were GRBs, ensuring rapid followup of outbursts detected by the BAT. This strategy proved to be an efficient way to catch outbursts with BAT and to monitor them with XRT during their evolution [17, 18, 19, 20, 21, 22, 23, 24]. The regular monitoring also allowed us, for the very first time, to study the long term properties of this class of objects with a highly sensitive instrument, in particular, the lowest states towards quiescence [25, 22, 23].
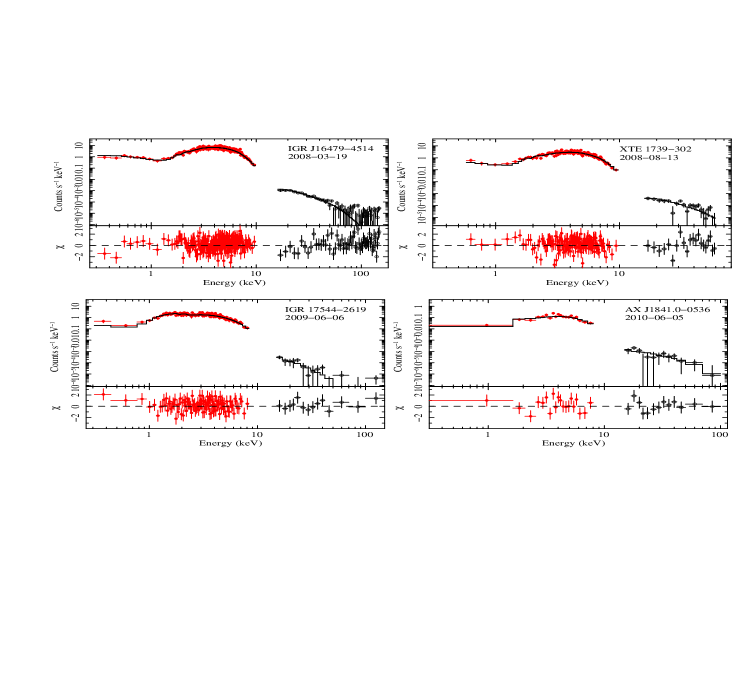
Simultaneous observations with XRT and BAT allowed us to perform broad band spectroscopy of SFXT outbursts for the first time [17], and this, we note, is the true strength of Swift. This is particularly important because of the general shape of the SFXT spectrum in outburst, a hard power law below 10 keV with an exponential cutoff at 15–30 keV. With the large (0.3–150 keV) Swift energy range we can both constrain the hard-X spectral properties (to compare with popular accreting neutron star models) and obtain a handle on the absorption. As an example, Figure 2 shows the spectrum of one outburst of each of the four SFXTs monitored, while Table 2 reports the values of the spectral parameters.
| Name | Campaign Dates | Obs. | Expo. | IDC | Rate | ||
|---|---|---|---|---|---|---|---|
| N. | (ks) | (ks) | (%) | (%) | |||
| IGR J16479–4514 | 2007-10-26–2009-11-01 | 144 | 161 | 29.7 | 3 | 19 | |
| XTE J1739–302 | 2007-10-27–2009-11-01 | 184 | 206 | 71.5 | 10 | 39 | |
| IGR J17544–2619 | 2007-10-28–2009-11-03 | 142 | 143 | 69.3 | 10 | 55 | |
| AX J1841.0–0536 | 2007-10-26–2008-11-15 | 88 | 96 | 26.6 | 3 | 28 | |
| Total | 558 | 606 |
| Name | Date | Reference | ||||
|---|---|---|---|---|---|---|
| ( cm-2) | (keV) | (keV) | ||||
| IGR J164794514 | 2008-03-19 | [17] | ||||
| XTE J1739302 | 2008-08-13 | This work | ||||
| IGR J175442619 | 2009-06-06 | [23] | ||||
| AX J1841.00536 | 2010-06-05 | [24] |
The IGR J112155952 results were initially met with some skepticism, and IGR J112155952 was often considered an ‘odd ball’ in the SFXT court. Now, however, we have collected high-sensitivity soft X–ray light curves for the great majority of the SFXT sample, which we present in Figure 3 (a-g). Furthermore, in Figure 3 (h) we show the light curve of IGR J184830311 [26], one of the three SFXTs for which both orbital and spin (21 s, [27]) periods are known. These observations were obtained as a 28 d monitoring program to study, for the first time, a SFXT along an entire orbital period (18.52 d, [28]). We note that while obvious individual differences in the light curves are present, so are similarities, such as outburst length in excess of hours, a multiple peaked structure, and a very large dynamic range. Furthermore, there is ubiquitous variability on several timescales.
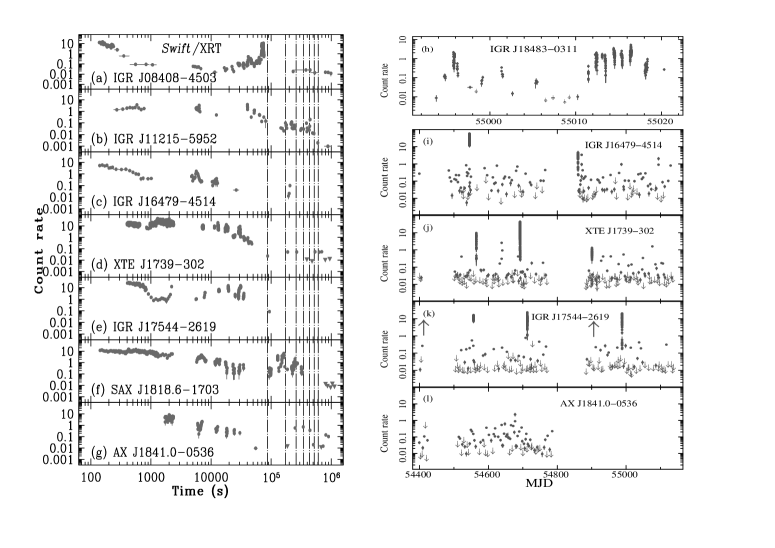
Right: (h) Swift/XRT 0.2–10 keV light curve of IGR J184830311 during our monitoring program along one orbital period (2009 June 11 to 2009 July 9) at a binning of at least 20 counts bin-1. Data from [26].
Right (i–l): Swift/XRT 0.2–10 keV light curves of our sample for a long-term monitoring program (Table 1, 2007 October 26 to 2009 November 3). Each point refers to the average flux observed during each observation performed with XRT, except for outbursts where the data were binned to include at least 20 counts bin-1 to best represent the dynamical range. Downward-pointing arrows are 3- upper limits, upward pointing arrows mark either outbursts that XRT could not observe because the source was Sun-constrained, or BAT Transient Monitor bright flares. AX J1841.00536 was only observed during the first year. Data from [22, 23].
Figure 3 (i–l) shows the XRT light curves of the
two-year campaign [22, 23].
Several characteristic can be noted.
i) The four sources present a dynamical range of –4
orders of magnitude; AX J1841.00536 went into outburst after the end of the campaign,
on 2010 Jun 5 and reached a dynamical range of
(see Fig 1 of [24]).
ii) The long-term behaviour of SFXTs is not quiescence
(which should be characterized by a soft spectrum and an X–ray
luminosity of erg s-1) but an intermediate state
of accretion with an average X-ray luminosity of – erg s-1,
and a power law photon index –2).
iii) We observe variability at all timescales we can probe.
Superimposed on the day-to-day variability (Figure 3 (i–l)),
is intra-day flaring that involves flux variations up to one order of magnitude
(see, e.g. Figure 3 a–g, and h).
We can identify flares down to a count rate in the order of 0.1 counts s-1
(– erg s-1) within a snapshot of about 1 ks.
This short time scale variability cannot be accounted for by accretion from a
homogeneous wind, but it can naturally be explained
by the accretion of single clumps in the donor wind.
Assuming that each of these short flares corresponds to the accretion of a single clump
onto the neutron star, then we can estimate its mass as
g ([5])
where is the average X-ray luminosity in units of erg s-1,
is the duration of the flares in units of 3 ks.
We thus obtain – g, which are about those expected
([5]) to be responsible of short flares, below the INTEGRAL
detection threshold and which, if frequent enough, may significantly contribute to the
mass-loss rate.
Given the structure of the observing plan during our campaign, we can realistically consider our monitoring as a casual sampling of the light curve at a resolution of about 4 d. Therefore, we can calculate the percentage of time each source spent in each relative flux state. To this end, we selected three states, namely, the BAT-detected outbursts, the intermediate states (observations yielding a firm detection excluding outburst ones), and ‘non detections’ (detections with a significance below 3). Only observations with an exposure in excess of 900 s were considered (corresponding to flux limits – erg cm-2 s-1, depending on the source, [22]).
The 4 SFXTs we monitored spend between 3 and 5 % of the time in bright outbursts.
The most most probable flux level at which a random observation will find these sources, when detected, is – erg cm-2 s-1 (unabsorbed 2–10 keV), corresponding to luminosities of a few to a few erg s-1. These values are based ([23]) on the distributions of the observed count rates after removal of the observations where a detection was not achieved and are two orders of magnitude lower than the bright outbursts, and two orders of magnitude higher than the quiescent state.
Finally, the time each source spends undetected down to a –3 erg cm-2 s-1, which we defined as inactivity duty cycle (IDC, [22]) is where is sum of the exposures accumulated in all observations (with exposure s) where only a 3- upper limit was achieved (Table 1, col. 5), is the total exposure accumulated (Table 1, col. 4), and is the percentage of time lost to short observations (exposure s, Table 1, col. 6). The cumulative count rate for each object is also reported Table 1 (col. 8). We find that %, for IGR J164794514, AX J1841.00536, XTE J1739–302, IGR J175442619, respectively (Table 1, col. 7).
3 Conclusions
Thanks to Swift we can now investigate the properties of SFTXs on several timescales (from minutes to days, from weeks to years) and in several intensity states (bright flares, intermediate intensity states, and down to almost quiescence); we can also perform broad-band spectroscopy of outbursts. Despite individual differences, common X–ray characteristics of this class are now well defined, such as outburst lengths well in excess of hours, with a multiple peaked structure, and a high dynamic range of up to orders of magnitude.
Acknowledgments.
PR would like to thank the P4 Session Chairs, I. Grenier and M. Tavani, for this chance to give an impromptu talk on the Swift results on SFXTs. We acknowledge financial contribution from the agreement ASI-INAF I/009/10/0. This work was supported at PSU by NASA contract NAS5-00136.References
- [1] V. Sguera, E. J. Barlow, A. J. Bird, et al., A&A 444, 221–231 (2005).
- [2] I. Negueruela, D. M. Smith, P. Reig, et al., 604, 165 (2006).
- [3] J. J. M. in’t Zand, A&A 441, L1–L4 (2005).
- [4] E. Bozzo, L. Stella, C. Ferrigno, et al., A&A 519, A6 (2010).
- [5] R. Walter, and J. Zurita Heras, A&A 476, 335–340 (2007).
- [6] I. Negueruela, J. M. Torrejón, P. Reig, et al., 1010, 252–256 (2008).
- [7] L. Sidoli, P. Romano, S. Mereghetti, et al., A&A 476, 1307–1315 (2007).
- [8] S. A. Grebenev, and R. A. Sunyaev, Astronomy Letters 33, 149–158 (2007).
- [9] E. Bozzo, M. Falanga, and L. Stella, Astrophys. J. missing (missing) missing 683, 1031–1044 (2008).
- [10] N. Gehrels, G. Chincarini, P. Giommi, et al., Astrophys. J. missing (missing) missing 611, 1005–1020 (2004).
- [11] L. Sidoli, A. Paizis, and S. Mereghetti, A&A 450, L9–L12 (2006).
- [12] D. N. Burrows, J. E. Hill, J. A. Nousek, J. A. Kennea, A. Wells, J. P. Osborne, A. F. Abbey, and A. Beardmore et al., Space Science Reviews 120, 165–195 (2005).
- [13] P. Romano, L. Sidoli, V. Mangano, et al., A&A 469, L5–L8 (2007).
- [14] P. Romano, L. Sidoli, G. Cusumano, et al., Astrophys. J. missing (missing) missing 696, 2068–2074 (2009).
- [15] P. Esposito, P. Romano, L. Sidoli, et al., The Astronomer’s Telegram 2257 (2009).
- [16] S. D. Barthelmy, L. M. Barbier, J. R. Cummings, et al., Space Science Reviews 120, 143–164 (2005).
- [17] P. Romano, L. Sidoli, V. Mangano, et al., ApJ 680, L137–L140 (2008).
- [18] P. Romano, L. Sidoli, G. Cusumano, et al., MNRAS 392, 45–51 (2009).
- [19] L. Sidoli, P. Romano, V. Mangano, et al., Astrophys. J. missing (missing) missing 690, 120–127 (2009).
- [20] L. Sidoli, P. Romano, L. Ducci, et al., MNRAS 397, 1528–1538 (2009).
- [21] L. Sidoli, P. Romano, P. Esposito, et al., MNRAS 400, 258–262 (2009).
- [22] P. Romano, L. Sidoli, G. Cusumano, et al., MNRAS 399, 2021–2032 (2009).
- [23] P. Romano, V. La Parola, S. Vercellone, et al., MNRAS 410, 1825–1836 (2011).
- [24] P. Romano, V. Mangano, G. Cusumano, et al., MNRAS 412, L30–34 (2011).
- [25] L. Sidoli, P. Romano, V. Mangano, et al., Astrophys. J. missing (missing) missing 687, 1230–1235 (2008).
- [26] P. Romano, L. Sidoli, L. Ducci, et al., MNRAS 401, 1564–1569 (2010).
- [27] A. M. Levine, and R. Corbet, The Astronomer’s Telegram 940 (2006).
- [28] V. Sguera, A. B. Hill, A. J. Bird, et al., A&A 467, 249–257 (2007).