Fragile-to-Strong Crossover in Supercooled Liquids Remains Elusive
Transport properties of glass forming liquids change markedly around an onset temperature . For temperatures above , these properties depend little with , while for these properties are super-Arrhenius – varying faster than exponentially in . Upon lowering temperature significantly further, theory DCJPPNAS predicts that reversible transport in a supercooled liquid, if it can be observed, will ultimately cross over from super-Arrhenius to Arrhenius temperature variation. But this so-called “fragile-to-strong” (FS) crossover at a temperature has proved difficult to observe because most bulk fluids fall out of equilibrium at a glass transition temperature that is higher than . Yet Mallamace et al Mallamace2010 report the observation of for a large number of supercooled liquids. In truth, they observe the onset to supercooled behavior, and the reported values of are poor lower-bound estimates to onset temperatures . This fact is consistent with transport decoupling appearing only below temperatures identified with the crossover in Ref. Mallamace2010 .
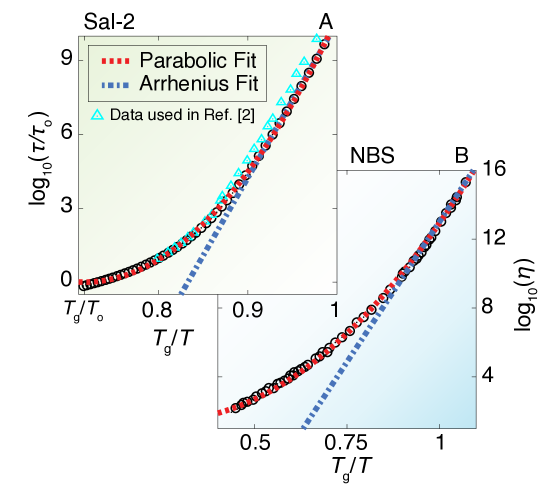
To illustrate this understanding about Ref. Mallamace2010 , I graph data in Fig. 1 for two typical supercooled liquids. The data is compared with the parabolic form for transport property (denoting either relaxation time or viscosity),
| (1) |
and with the straight-line fit that would be associated with the Arrhenius temperature dependence. I consider data for liquid salol in my Fig. 1A. This is the same liquid and the same temperature range considered in Fig. 1A of Ref. Mallamace2010 . The two figures are strikingly different, due in part to Ref. Mallamace2010 showing an outlying data set Laughlin that is discredited by subsequent studies on the same liquid Corr_1 . Unlike Fig. 1A of Ref. Mallamace2010 , my graph shows excellent agreement between reproducible experimental data and the parabolic form.
My Fig. 1B considers a second liquid to illustrate that the behavior for salol is consistent with that of other systems. Indeed, the parabolic form, with its three material properties , and , has been used to collapse data for more than 50 supercooled liquids Corr_1 over the entire supercooled temperature range, , and this form appears to be universal for all fragile glass formers Corr_2 . I have chosen to show two specific examples in this Letter to contrast with the obscuring clutter of data analyzed with six-parameter fits in Figs. 1C and 2 of Ref. Mallamace2010 .
The two graphs presented here and those presented in Refs. Corr_1 and Corr_2 indicate that all reliable reversible transport data for bulk supercooled liquids appear to be smooth, with no compelling feature suggesting a change from parabolic to linear behavior. Rather, it seems that the FS crossover reported in Mallamace2010 results from confusing with , and how, over a limited range, a parabola looks like a straight line. The search for the FS crossover in bulk materials therefore remains elusive.
I Acknowledgements
This work was supported by an NSF GRFP Fellowship for Y.S.E.
References
- (1) Garrahan, J.P., D. Chandler (2003) Coarse-grained microscopic model of glass formers. Proc. Nat. Acad. Sci. USA 100:9710-9714.
- (2) Mallamace, F et al (2010) Transport properties of glass-forming liquids suggest that dynamic crossover temperature is as important as the glass transition temperature. Proc. Natl. Acad. Sci. USA 107:22457-22462.
- (3) Laughlin, W.T., D. R. Uhlmann (1972) Viscous flow in simple organic liquids J. Phys. Chem. 76:2317-2325.
- (4) Elmatad, Y.S., J. P. Garrahan, D. Chandler (2009) Corresponding states of structural glass formers. J. Phys. Chem. B USA 113:5563-5567.
- (5) Elmatad, Y.S., J. P. Garrahan, D. Chandler (2010) Corresponding states of structural glass formers. II. J. Phys. Chem. B USA 114:17113-17119.