TeV dark matter in the disk
Abstract
DAMA annual modulation data and, CoGeNT, CDMS-II, EDELWEISS-II, CRESST excesses of events over the expected background are reanalyzed in terms of a dark matter particle signal considering the case of a rotating halo. It is found that DAMA data favor the configurations of very high mass dark matter particles in a corotating cold flux. A similar high-mass/low-velocity solution would be compatible with the observed events in CoGeNT, CDMS-II, EDELWEISS-II and CRESST experiments and could be of interest in the light of the positron/electron excess measured by Pamela and Fermi in cosmic rays.
keywords:
dark matter experiments , dark matter theory1 Introduction
Since 1996 the sodium iodide experiments of DAMA collaboration (DAMA/NaI and DAMA/LIBRA) have measured an annual modulation of the single-hit counting rate which has the proper features expected for a dark matter induced signal [1].
More recently, other experiments (CoGeNT [2], CDMS-II [3, 4], EDELWEISS-II [5], CRESST [6]) have reported a preliminary observation of some excess of events relative to the expected backgrounds.
The DAMA annual modulation signal and the other experiment excesses, if interpreted as dark matter with dominant spin independent interaction in the isothermal halo model, implies that dark matter particles possess a mass in the range of 5-15 GeV and an elastic scattering cross section with nucleons in the order of pb [7, 8, 9].
In this paper the same data are reanalyzed relaxing the hypothesis of isothermal halo model, however it is assumed that the dark matter local velocity distribution can still be approximated as a single Maxwellian flux:
| (1) |
Here the Earth velocity relative to the dark matter flux is given by: ; where: is the Earth velocity in the solar system frame; km/s is the Sun velocity relative to the Local Standard of Rest (LSR), and km/s [10]. Therefore assuming a rotating dark matter halo () one can write: , where is the LSR velocity with respect to the dark matter flux. Fixing km/s the eq. (1) provides the isothermal halo model, however, in this analysis, the and parameters are kept free and it is important to note that configurations of and that are far from the isothermal halo ones can be physically meaningful111as an example CDM halo simulations with baryons predict a corotating dark disk having km/s and km/s [11, 12].
To avoid parameter proliferation, only the case of dominant spin independent interaction for elastically scattering dark matter will be considered and the effects of uncertainties in the values adopted for other parameters (quenching factor, form factor, possible presence of channeling, etc..) will be neglected. Therefore a four-parameter space will be considered here, where is the particle mass, is the proton cross section and is the dark matter density in units of .
2 Experimental observables
In this section the data used in the analysis are listed for each experiment under consideration:
2.1 DAMA/NaI and DAMA/LIBRA
The total exposure of 1.17 tonyr of NaI(Tl) provides three complementary observables:
a) A modulated time behavior in the 2-6 keV window (see data in fig. (3) taken from fig. (4) of ref. [1])
b) The energy distribution of the observed modulation amplitude, assuming a fixed phase d (see data in fig. (4) taken from fig. (6) of ref. [1]). In the following analysis the data in the 2-8 keV interval will be considered.
c) The energy distribution of the unmodulated counting rate (see data in fig. (5) taken from fig. (27) of ref. [13]). This energy distribution provides a limit for the sum of background and unmodulated dark matter induced signal and therefore the limit of 0.25 cpd/(kg keV) for the possible unmodulated dark matter induced signal, is cautiously assumed in the following analysis; this choice allows large space for the presence of a low energy background component in the measured counting rate.
2.2 CoGeNT
The data of fig. (3) of ref. [2] are considered for the exposure of 330g 56d collected by CoGeNT germanium detector.
Only the data in the 0.4-0.9 keV window have been used for the evaluation of the dark matter allowed configurations in the hypothesis that this excess is induced by dark matter elastic scattering; however the whole energy interval in fig. (3) of ref. [2] is considered for the evaluation of the upper limit.
2.3 CDMS-II and EDELWEISS-II
The exposure of 969 kg d collected by CDMS-II germanium detectors [4] is considered. Eleven events were observed within the recoil acceptance region passing the rejection cuts in the 10-150 keV energy range. The neutron background is not able to explain the CDMS-II measured events; however some of these events could be ascribed to surface background, in particular for the low energy region. In the following the hypothesis that the measured event excess could be due to dark matter elastic scattering is considered. Moreover the data of the very low energy analysis of CDMS-II (see fig. (1) of ref. [14]) are also considered in the evaluation of the upper limit. The recent result of EDELWEISS-II [5] (where five recoil events are measured collecting the exposure of 384 kg d) seems to be compatible with the CDMS-II data; therefore, for simplicity, only the CDMS-II data will be considered in this analysis.
2.4 CRESST
The preliminary exposure of 564 kg d collected by CRESST - detectors is considered [6]. In the energy range keV (the lower threshold is different for different detectors) 38 events are observed in the Tungsten recoil band and 52 events in the Oxygen one. Despite the fact that recoils from decay of can contribute to the background in the higher energy part of the Tungsten recoil band and that the Oxygen recoil band is partially overlapped by the recoil band, only a fraction of the observed events can be ascribed to the evaluated background. In this analysis, to account for the possible impact of a confirmed excess in CRESST data, the case where 30 events of Tungsten recoil and 30 of Oxygen recoil are induced by dark matter elastic scattering will be considered; this example will be generically addressed as CaWO4.
3 Parameter estimation
The joint estimation of the four parameters confidence interval has been obtained by solving:
| (2) |
for the appropriate values of ( and 13.28 for 90% and 99% C.L. respectively). In the eq.(2) is the global likelihood function and is the likelihood maximum value over the four parameter space. In the estimation of confidence intervals, the Gaussian approximation has been adopted for the likelihood of DAMA/NaI + DAMA/LIBRA data; moreover, the possible presence of unknown background explaining part or all of the measured events for the other experiments has been considered.
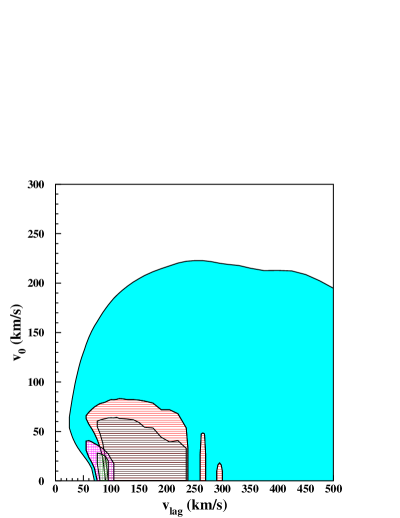
In fig. (1) the projection of the confidence interval surface (90% and 99% C.L.) in the plane ( vs ) is shown for two cases:
-
1.
unconstrained DAMA/NaI + DAMA/LIBRA data (horizontally hatched area)
-
2.
DAMA/NaI + DAMA/LIBRA data combined with CoGeNT, CDMS-II and CRESST data (cross-hatched area)
It can be noted that DAMA/NaI+DAMA/LIBRA data favor configurations having low velocity dispersion (low ) and relatively low which would imply a relatively cold and corotating dark matter flux in the Galaxy.
Combining the DAMA data with the constraints from other experiments further strengthens this indication.
As a comparison, in fig. (1), the projection of the configurations having a C.L. better than the one of isothermal halo model ( km/s and km/s) for unconstrained DAMA/NaI + DAMA/LIBRA data, is reported.
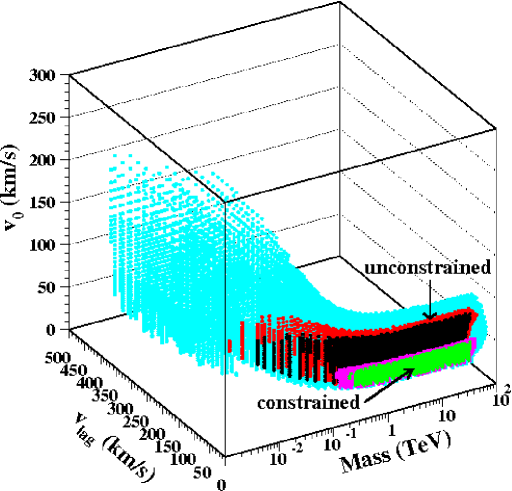
In fig. (2) the allowed configurations in the volume () are shown. The confidence levels and the cases of unconstrained/constrained DAMA data adopt the same palette code used for fig. (1). It may be noted that configurations having low and low require a very high ; only a similar configuration would provide a flux of dark matter particles with enough kinetic energy to allow nuclear recoils events beyond the experimental thresholds.
4 Comparison of the annual modulation signal with respect to the case of isothermal halo model
Here, the expected dark matter annual modulation signal features in NaI(Tl) are compared assuming the four different models listed in table (1).
| Model | (km/s) | (km/s) | (pb) | |
|---|---|---|---|---|
| a) | 220 | 220 | 60 GeV | |
| b) | 220 | 220 | 10 GeV | |
| c) | 10 | 95 | 90 TeV | |
| d) | 20 | 75 | 90 TeV |
In fig. (3) the expected modulation behavior in the 2-6 keV energy region of DAMA for the four considered models is shown.
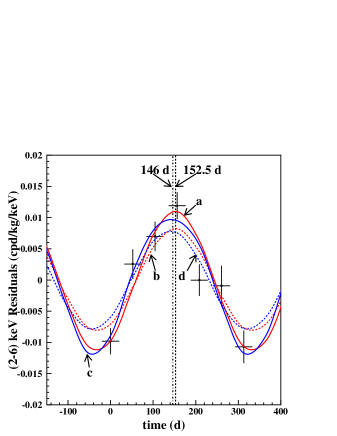
The vertical lines mark the time of of June (where the maximum of the modulation amplitude is expected for a non-rotating halo model) and d where a maximum can be easily achieved, for example, assuming a corotating flux. The data points are taken from fig. (4) of ref. [1] and represent the annual modulation signal measured by DAMA/NaI + DAMA/LIBRA. The measured time of maximum of the modulation in DAMA is d, which is compatible both with non-rotating as well as with many of the rotating halo models. It is important to note that the modulation behavior is roughly sinusoidal but for some extremal models also large departures from a pure sinusoid can be found.
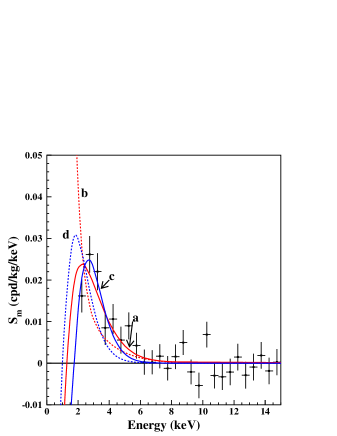
In fig. (4) the expected energy distribution of modulation amplitudes () for the four considered models is shown. The data points are taken from fig. (6) of ref. [1] and represent the annual modulation amplitude energy distribution measured by DAMA/NaI + DAMA/LIBRA.
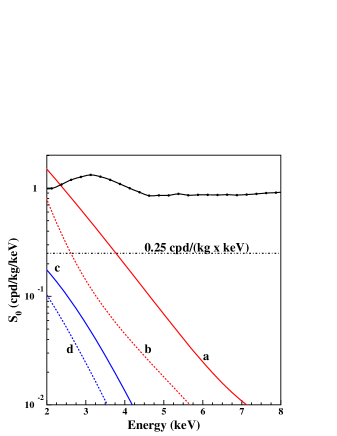
In fig. (5) the expected energy distribution of the unmodulated part of the counting rate () for the four considered models is shown. The data points are taken from fig. (27) of ref. [13] and represent the measured counting rate of DAMA/LIBRA; they are the sum of the background and of the possible dark matter signal. The dot-dashed line marks the limit of 0.25 cpd/(kg keV) cautiously assumed for the maximum allowed value in this analysis. It is important to note that corotating halo models offer a large ratio allowing the presence of a reasonable background component also in the low energy part of DAMA data.
5 Allowed regions fixing the halo: an example.
In this section, as an example, the halo model will be specified to fixed and values. In this fixed halo model, the 2 confidence intervals in the ( vs ) plane are evaluated considering configurations having with respect to the maximum likelihood of the considered halo model.
In fig. (6) the allowed regions, assuming the isothermal halo model ( km/s) are shown.
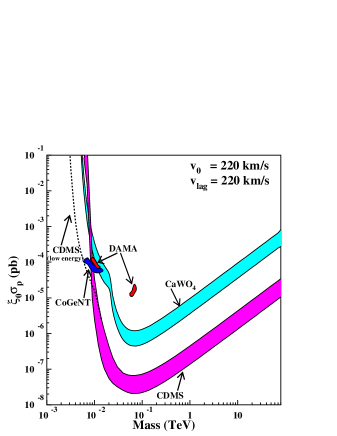
As a comparison, the allowed regions for the case of a cold corotating halo ( = 20 km/s and = 75 km/s) are given in fig. (7). In both figures the dashed curve is the limit that can be evaluated with CDMS-II when the low energy threshold data are also considered [14] . It may be noted that compatibility among possible positive hints for dark matter could be achieved in models of very heavy particles ( few TeV) forming a cold corotating halo.
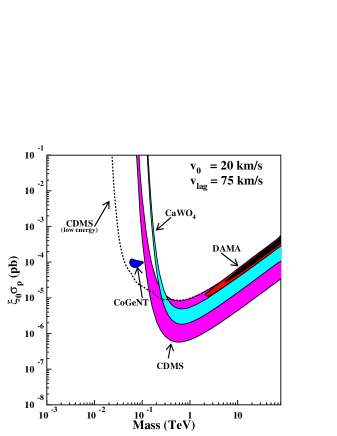
As an example, for =20 km/s, = 75 km/s, TeV and pb, one would expect:
-
1.
only a fraction of 0.5% of the total CoGeNT rate in the 0.4-0.9 keV window due to dark matter elastic scattering
-
2.
recoils measured in CDMS-II
-
3.
recoils measured in CaWO4 (CRESST-like) mainly expected to lie in Tungsten band.
6 Conclusions
DAMA annual modulation data and, CoGeNT, CDMS-II, EDELWEISS-II, CRESST excesses of events over the expected background have been reanalyzed in terms of a dark matter particle signal considering the case of a rotating halo. It has been found that the data favor the configurations of very high mass dark matter particles in a corotating cold flux. This solution is intriguing since CDM halo simulations with baryons predict a corotating dark disk having km/s and km/s [11, 12]
A similar high-mass/low-velocity solution could be of interest in the light of the positron/electron excess measured by Pamela and Fermi in cosmic rays (see e.g. [15]).
Finally, the possibility of multi-component dark matter should also be taken into account: one could consider, for example, sterile neutrinos which form a dominant and warmer component of dark matter in galaxies together with a sub-dominant population of heavy WIMPs mainly gathered in the core of dwarf galaxies and, therefore, in the accreted dark disk.
References
- [1] R. Bernabei et al., Eur. Phys. J. C 67, 39 (2010).
- [2] C.E. Aalseth et al., arXiv:1002.4703.
- [3] Z. Ahmed et al., Science 327, 1619 (2010).
- [4] Z. Ahmed et al., arXiv:1012.5078.
- [5] E. Armengaud et al., arXiv:1103.4070.
- [6] see e.g. Franz Pröbst slides at the workshop ”Dark Matter: Direct Detection and Theoretical Developments”, Princeton, November 15-16, 2010.
- [7] S. Chang et al., JCAP 1008:018 (2010), arXiv:1004:0697.
- [8] A. Bottino et al., Phys. Rev. D 81, 107302 (2010).
- [9] N. Fornengo et al., arXiv:1011.4743.
- [10] C. McCabe, Phys. Rev. D 82, 023530 (2010).
- [11] J. Read et al., arXiv:0803.2714.
- [12] C.W. Purcell et al., Astrophys J. 703 2275 (2009).
- [13] R. Bernabei et al., Nucl. Instr. and Meth. A 592, 297 (2008).
- [14] Z. Ahmed et al., arXiv:1011.2482.
- [15] I. Cholis and L. Googenhough, JCAP1009:010 (2010), arXiv:1006.2089.