A ground-based -band detection of the thermal emission from the transiting exoplanet WASP-4b††thanks: Based on observations collected at the European Southern Observatory, Chile. Programme 083.C-0528.
Abstract
Context. Secondary eclipses are a powerful tool to measure directly the thermal emission from extrasolar planets, and to constrain their type and physical parameters.
Aims. We started a project to obtain reliable broad-band measurements of the thermal emission of transiting exoplanets.
Methods. Ground-based high-cadence near-infrared relative photometry was used to obtain sub-millimagnitude precision light curve of a secondary eclipse of WASP-4b – a 1.12 MJ hot Jupiter on a 1.34 day orbit around G7V star.
Results. The data show a clear 10 detection of the planet’s thermal emission at 2.2 m. The calculated thermal emission corresponds to a fractional eclipse depth of %, with a related brightness temperature in of K, centered at HJD. We could set a limit on the eccentricity of , compatible with a near-circular orbit.
Conclusions. The calculated brightness temperature, as well as the specific models suggest a highly inefficient redistribution of heat from the day-side to the night-side of the planet, and a consequent emission mainly from the day-side. The high-cadence ground-based technique is capable of detecting the faint signal of the secondary eclipse of extrasolar planets, making it a valuable complement to space-based mid-IR observations.
Key Words.:
Planetary systems - Eclipses - Stars: individual: WASP-4 - Techniques: photometric1 Introduction
Photometry of extrasolar planetary transits allows to measure the planetary radii and density, and to infer the nature of the planet - gaseous or rocky. The detection of the thermal emission during the secondary eclipses when the planet passes behind the star gives access to additional physical parameters like the brightness temperature, an important quantity for the comparison with more sophisticated planetary atmospheric models with chemistry, and dynamics (i.e. Burrows et al. 2008). While a few secondary eclipses have been secured from space (e.g. Charbonneau et al. 2005; Deming et al. 2005), the detection of secondary eclipses has been very challenging from the ground, with only a few recent secure detections (see Sing & López-Morales 2009; Rogers et al. 2009; Croll et al. 2010a, b; and references therein). We obtained sub-millimagnitude precision ground-based relative photometry, based on ultra-fast high-cadence near-infrared (NIR) observations, which can detect transits down to a few millimagnitudes (Cáceres et al. 2009; hereafter Paper I). In this paper we report the detection of a secondary eclipse of WASP-4b.
WASP-4b was discovered by Wilson et al. (2008). It is a 1.12 MJ hot Jupiter on a 1.34 day orbit around a G7V star, with a heavily irradiated atmosphere and large radius. Additional orbital and physical parameters were measured also by Gillon et al. (2009), Winn et al. (2009), and Southworth et al. (2009). Recently, Beerer et al. (2011) performed photometry, using the IRAC instrument on the Warm Spitzer, of the planet WASP-4b in the and m bands. Their data suggests the WASP-4b atmosphere lacks a strong thermal inversion on the day-side of the planet, an unexpected result for an highly irradiated atmosphere.
WASP-4b was one of the pilot targets for our program because of its short period and large size with respect to most transiting exoplanets, with a relatively large predicted secondary eclipse amplitude of about a millimagnitude, placing it well within our expected range of detection. In Section 2 we discuss the observations and their analysis. Section 3 presents the detection of the secondary eclipse, and gives the measured brightness temperature for WASP4-b, comparing it with theoretical models. Finally, Section 4 summarizes the results and lists some conclusions.
2 Observations and data reduction
The band WASP-4b observations were obtained with the Infrared Spectrometer And Array Camera (ISAAC Moorwood et al. 1998) at the ESO VLT, on September 27, 2009. The observations were carried out in the FastPhot mode, as in Paper I. The InSb 10241024 px Aladdin detector was windowed down to 304608 px, yielding a field of view of 4590 arcsec. The field of view includes WASP-4 and one reference star – R.A. 23 34 18.4, Dec. -42 04 51.0 (J2000). 2MASS (Skrutskie et al. 2006) lists for them respectively: =11.2, =10.8, and =10.7 mag and =11.7, =11.3, and =11.2 mag.
This observation mode generates a series of data-cubes with a fixed number of frames. Each frame is an individual detector integration, and there is nearly zero “dead” time between the integrations. The cubes are separated by an interval of 6 sec for fits header merging, file transfer, and saving on a hard disk. For these observations the cubes had 250 frames, corresponding to integrations of 0.6 sec each. In total, we collected 30,003 frames during a continuous 310 min long run.
Standard procedures for NIR data reduction as dark subtraction and flat fielding were performed on the data set. We applied aperture photometry, using the IRAF111IRAF is distributed by the National Optical Astronomy Observatories, which are operated by the Association of Universities for Research in Astronomy, Inc., under cooperative agreement with the National Science Foundation. package Daophot, to measure the apparent fluxes of the two stars in the field. An aperture radius of 1.92 arcsec was selected empirically to have the best compromise between the r.m.s. on the transit light curve, determined as ratio of the target-vs-reference fluxes, and the systematic noise introduced by a varying sky. The sky background was estimated in a circular annulus with an inner radius of 3.10 arcsec and outer radius of 7.5 arcsec, from the centroid of the point-spread function.
Occasionally, during the observations the central peak of the stars exceeded the linearity limit of the detector of 6500 ADU. To avoid the non-linearity effects that may distort the occultation depth measurement we discarded those frames. Moreover, at the end of the run the detector was moved yielding in jumps in the position of the stars. All the points after the first jump in position were also discarded. The starting points showed also a jump that could not be corrected, and these points were also removed to avoid including a systematic error to the determined parameters. After cleaning the light curve, we leave a total of 24,070 measurements, that were used during the subsequent analysis.
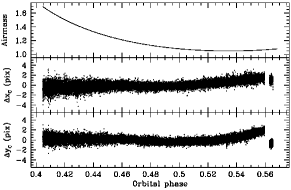
The light curve shows a smooth trend during the period of observation, most likely due to airmass variation, important during the first half of the night, and due to target drift across the detector, which dominated the end of the run, as shown in Fig. 1. To remove these effects we modeled the base-line of the light curve with a polynomial that includes a linear dependency on time (), airmass (sec ), and positions of the centroid of the star on the detector ( and ) as follows:
| (1) |
The coefficients in Eq. 1 were determined using the entire light curve, with the fitting procedure described below. The form of the polynomial was selected to flatten the out-of-eclipse lightcurve after multiple experiments. We also attempted to include other parameters, i.e. the full-width-half-maximum of stars on each frame, but the correlation of the signal with this parameter was negligible.
3 Analysis and discussion
Various parameters can be measured from the secondary eclipse light curve. The thermal planetary emission is proportional to the eclipse depth , the orbital eccentricity and argument of periastron could be inferred through the analysis of both the eclipse central time , and the secondary eclipse length . We create an occultation model following the algorithm for uniform illuminated transit light curve (i.e. neglecting the limb-darkening contribution) from Mandel & Agol (2002), and we scaled the model transit depth to fit the observed eclipse depth. The stellar and planetary parameters for WASP-4 and WASP-4b were adopted from Winn et al. (2009): period =1.33823214 d, planet-to-star radius ratio =0.15375, semi-major axis =5.473 R⋆, orbital inclination =88.56 deg, and stellar radius ⋆=0.912 ⊙.
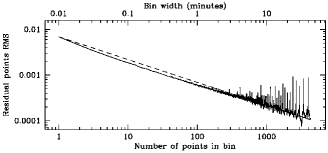
Past experience with NIR data showed that correlated noise could degrade photometric accuracy in these wavelengths. To evaluate the contribution of this kind of noise on our photometry, we analyzed the behavior of the light curve r.m.s. for different binning factors, after removing the best-fitting model. It shows a small deviation from the expected curve for pure Poisson noise (Fig. 2) over range of binning corresponding to times of the order of tens of minutes – similar to the duration of the ingress-egress for the secondary eclipse.
The best fitting model parameters were found with the multidimensional minimization algorithm AMOEBA (Press et al. 1992), where the free parameters were the eclipse depth, central time, length, and the coefficients of the base-line in Eq. 1, on the 2-min binned light curve, yielding 131 data points. The function to minimize was the statistic, for a model that is:
| (2) |
where corresponds to the occultation model described above. To determine the errors in the fitted parameters, we performed the bootstrapping procedure described in Paper I: we first subtracted the best fitting model from the data set, then we took the set of residuals and shifted the residual to become the th residual, and the last to become the first. Next, we added the re-ordered residuals to the best fitting model and run it through the minimization procedure instead of the data to obtain a new set of fitting results. This procedure was repeated until a full circle over the “good” points was completed, and the reported uncertainties were defined by the 68.3% level around the median values of the distributions. Therefore, our errors properly account for the correlated noise in the data set.
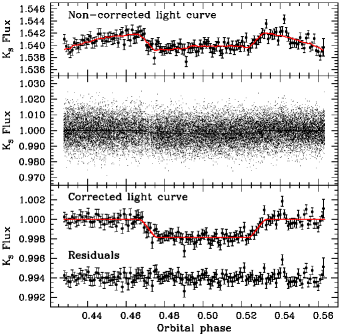
The final corrected light curve is shown in Fig. 3. Table 1 lists the individual flux measurements, with their time-stamps and Poisson uncertainties. The resulting parameters and their uncertainties for WASP-4b are listed in Table 2.
| HJD | Relative flux | Uncertainty |
|---|---|---|
| 2455102.5150000 | 0.99951 | 0.00427 |
| 2455102.5150069 | 0.99732 | 0.00427 |
| 2455102.5150138 | 1.00339 | 0.00421 |
| 2455102.5150277 | 0.99452 | 0.00424 |
| 2455102.5150347 | 1.00043 | 0.00426 |
Only a small portion of the data set is presented in this table, to exemplify its presentation format. The complete set can be found in the electronic version of the Journal.
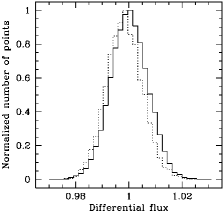
The significance of our detection can be assessed from Fig. 4, where the distribution of the relative flux (with respect to the reference star) during the eclipse and outside of the eclipse are compared. The bin width is equal to the calculated eclipse depth %, and each distribution curve was normalized for comparison purposes. A K-S test applied on these distributions shows they are identical with a of probability, but displaced exactly one bin.
| Parameter | Value | 68.3% Confidence Limits | Unit |
|---|---|---|---|
| 2455102.61162 | -0.00071, +0.00077 | HJD | |
| 0.185 | -0.014, +0.013 | % | |
| 0.0881 | -0.0017, +0.0022 | d | |
| 0.0027 | 0.0018 | - | |
| 1995 | 40 | K | |
| Base-line parameters | |||
| 1.6933 | -0.0169, +0.0214 | ||
| -0.0364 | -0.0027, +0.0042 | ||
| -0.0112 | -0.0014, +0.0013 | ||
| -0.00025 | -0.00074, +0.00062 | ||
| -0.00175 | -0.00060, +0.00078 | ||
The center of the secondary eclipse occurs at , assuming the ephemeris of Southworth et al. (2009). For zero eccentricity (Wilson et al. 2008; Gillon et al. 2009; Winn et al. 2009; Southworth et al. 2009), and a light travel time of sec for this system (Loeb 2005), the secondary eclipse is expected to occur at phase . The phase difference implies a non-zero eccentricity, that could be determined knowing the primary transit length , from the equations (Charbonneau et al. 2005):
| (3) |
| (4) |
The accuracy of our eclipse length measurement prevents us from using Eq. 4, so we only use the former equation, to put a upper limit on the eccentricity . Within the 3- level, this results argues in favor of a nearly circular orbit.
Previous planet-to-star contrast measurements for WASP-4b have been obtained by Beerer et al. (2011) in the and m broad band filters with the Spitzer Space Telescope. As a zero-order approximation, we represent the planet with a black body with temperature , and the host star with a Hauschildt et al. (1999) stellar atmosphere model, with parameters , , and [Fe/H] = 0.0 (Gillon et al. 2009). They are divided to obtain the planet-to-star flux contrast as a function of wavelength. The expected depth was calculated as weighted average of the contrast curve, weighted by the filter transmission curve, the atmospheric transparency, and the detector efficiency curve. The best-fitting black body curve yielded a planetary brightness temperature of K at 2.2 micron.
The observational data of highly irradiated planets indicate very low Bond albedo values (e.g. Charbonneau et al. 1999; Rowe et al. 2008; Rogers et al. 2009), implying that the atmospheres of those planets are highly heated by the stellar radiation, and probably bloated. The temperature at which the planet re-emits the energy absorbed from the stellar flux, at a given distance from the star, in units of the stellar radius, is given by . Here, the factor refers to the fraction of energy that is re-radiated from the planet to the observer. If the stellar radiation absorbed by the planet is re-radiated isotropically then , and we could determine for a zero Bond albedo an equilibrium temperature for the planet of K. The difference between the equilibrium and the brightness temperatures suggests a poor energy redistribution in the atmosphere of WASP-4b. In fact, to obtain the calculated brightness temperature the re-radiation factor should be , indicating a planet with re-radiation only from the day-side (Burrows et al. 2008), when assuming a zero Bond-albedo. This result is in agreement with the results in Beerer et al. (2011), who found that the Fortney et al. (2008) models with a small redistribution of heat, and an absence of TiO in the WASP-4b stratosphere, are best fits for their measurements.
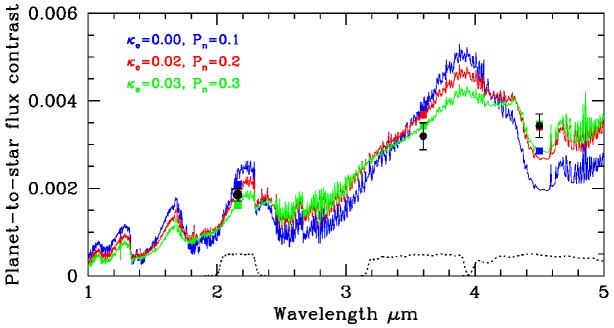
Planetary atmosphere models tuned for WASP-4b are shown in Fig. 5. The modeled atmospheres assume radiative and chemical equilibrium, and employ the chemical compositions and thermo-chemistry found in Burrows & Sharp (1999), and Sharp & Burrows (2007), and the opacities described in Sharp & Burrows (2007), and references therein. These models were calculated for different redistribution factors , where implies no redistribution, and means maximum redistribution (Burrows et al. 2008). This parameter represents the fraction of energy that is transferred from the day-side to the night-side of the planet. Moreover, some highly irradiated atmospheres require the inclusion of an extra absorber to fit calculated eclipse depths, this accounting for the presence of inversion layers in the upper atmosphere (Burrows et al. 2007; Knutson et al. 2009). This scenario was tested by introducing an opacity parameter for this extra absorber as a second parameter to explore.
Our observations favor lower parameter values, arguing in favor of an inefficient redistribution of the received radiation from the day-side to the night-side of the planet, as shown in Fig. 5. The models best suited with our measurement correspond to atmospheres with null or low amounts of a stratospheric absorber, this leading to non inverted, or scarcely inverted atmospheres. A similar result was found in Beerer et al. (2011), for observations in the mid-IR. When considering the three measurements, i.e. the ISAAC one at 2.2 m, and the Spitzer ones at and m, the best fitting models is the one with an inefficient redistribution of heat, and an small quantity of absorber in the planet stratosphere. Thus, the lack of a strong thermal inversion in the atmosphere of WASP-4b could be inferred from this IR detection.
4 Conclusions
The ultrafast photometry technique developed in Paper I is able to detect very low amplitude secondary eclipses of extrasolar planets. We have measured the secondary eclipse depth of WASP-4b which has an amplitude of % at 10 level. This secure detection strengthen our confidence in the new method, and indicates that it could be fruitful to attempt the observation of secondary eclipses at shorter wavelengths, where the eclipses are shallower, but the NIR signal is still within our observational capabilities.
For the stellar and planetary parameters, this yields a brightness temperature of K in the , which agrees with the specific models for WASP-4b, and argues in favor of inefficient heat redistribution from the day-side to the night-side of the planet. The absence of an strong thermal inversion in the stratosphere of WASP-4b is inferred from our near-IR measurement, and mid-IR measurements in the literature.
Acknowledgements.
This work is supported by ESO, by BASAL Center for Astrophysics and Associated Technologies PFB-06, by FONDAP Center for Astrophysics 15010003, and by Ministry for the Economy, Development, and Tourism’s Programa Inicativa Científica Milenio through grant P07-021-F, awarded to The Milky Way Millennium Nucleus. A.B would like to acknowledge support in part by NASA grant NNX07AG80G and through JPL/Spitzer Agreements 1328092, 1348668, and 1312647. The authors would like to acknowledge David Anderson by his useful comments and suggestions.References
- Beerer et al. (2011) Beerer, I. M., Knutson, H. A., Burrows, A., et al. 2011, ApJ, 727, 23
- Burrows et al. (2008) Burrows, A., Budaj, J., & Hubeny, I. 2008, ApJ, 678, 1436
- Burrows et al. (2007) Burrows, A., Hubeny, I., Budaj, J., Knutson, H. A., & Charbonneau, D. 2007, ApJ, 668, L171
- Burrows & Sharp (1999) Burrows, A. & Sharp, C. M. 1999, ApJ, 512, 843
- Cáceres et al. (2009) Cáceres, C., Ivanov, V. D., Minniti, D., et al. 2009, A&A, 507, 481
- Charbonneau et al. (2005) Charbonneau, D., Allen, L. E., Megeath, S. T., et al. 2005, ApJ, 626, 523
- Charbonneau et al. (1999) Charbonneau, D., Noyes, R. W., Korzennik, S. G., et al. 1999, ApJ, 522, L145
- Croll et al. (2010a) Croll, B., Albert, L., Lafreniere, D., Jayawardhana, R., & Fortney, J. J. 2010a, ApJ, 717, 1084
- Croll et al. (2010b) Croll, B., Jayawardhana, R., Fortney, J. J., Lafrenière, D., & Albert, L. 2010b, ApJ, 718, 920
- Deming et al. (2005) Deming, D., Seager, S., Richardson, L. J., & Harrington, J. 2005, Nature, 434, 740
- Fortney et al. (2008) Fortney, J. J., Lodders, K., Marley, M. S., & Freedman, R. S. 2008, ApJ, 678, 1419
- Gillon et al. (2009) Gillon, M., Smalley, B., Hebb, L., et al. 2009, A&A, 496, 259
- Hauschildt et al. (1999) Hauschildt, P. H., Allard, F., Ferguson, J., Baron, E., & Alexander, D. R. 1999, ApJ, 525, 871
- Knutson et al. (2009) Knutson, H. A., Charbonneau, D., Burrows, A., O’Donovan, F. T., & Mandushev, G. 2009, ApJ, 691, 866
- Loeb (2005) Loeb, A. 2005, ApJ, 623, L45
- Mandel & Agol (2002) Mandel, K. & Agol, E. 2002, ApJ, 580, L171
- Moorwood et al. (1998) Moorwood, A., Cuby, J., Biereichel, P., et al. 1998, The Messenger, 94, 7
- Press et al. (1992) Press, W. H., Teukolsky, S. A., Vetterling, W. T., & Flannery, B. P. 1992, Numerical recipes in C. The art of scientific computing, ed. Press, W. H., Teukolsky, S. A., Vetterling, W. T., & Flannery, B. P.
- Rogers et al. (2009) Rogers, J. C., Apai, D., López-Morales, M., Sing, D. K., & Burrows, A. 2009, ApJ, 707, 1707
- Rowe et al. (2008) Rowe, J. F., Matthews, J. M., Seager, S., et al. 2008, ApJ, 689, 1345
- Sharp & Burrows (2007) Sharp, C. M. & Burrows, A. 2007, ApJS, 168, 140
- Sing & López-Morales (2009) Sing, D. K. & López-Morales, M. 2009, A&A, 493, L31
- Skrutskie et al. (2006) Skrutskie, M. F., Cutri, R. M., Stiening, R., et al. 2006, AJ, 131, 1163
- Southworth et al. (2009) Southworth, J., Hinse, T. C., Burgdorf, M. J., et al. 2009, MNRAS, 399, 287
- Wilson et al. (2008) Wilson, D. M., Gillon, M., Hellier, C., et al. 2008, ApJ, 675, L113
- Winn et al. (2009) Winn, J. N., Holman, M. J., Carter, J. A., et al. 2009, AJ, 137, 3826