The intermediate pressure phases of cerium studied by LDA+Gutzwiller method
Abstract
The thermodynamic stable phase of cerium metal in the intermediate pressure regime (5.0–13.0 GPa) is studied in detail by the newly developed local-density approximation (LDA)+ Gutzwiller method, which can include the strong correlation effect among the 4f electrons in cerium metal properly. Our numerical results show that the phase, which has the distorted body-centered-tetragonal structure, is the thermodynamic stable phase in the intermediate pressure regime and all the other phases including the phase (-U structure), phase (fcc structure), and bct phases are either metastable or unstable. Our results are quite consistent with the most recent experimental data.
pacs:
71.27.+a, 71.10.Fd, 71.20.BeI Introduction
Due to the strong correlation effect, the 4f electrons in Lanthanide metal usually participate very weakly into the chemical bonding, which makes these materials approximately s-band metal with close-packed crystal structure. A very important exception of this qualitative understanding is the cerium metal, where the 4f electrons participate in chemical bonding in the fcc phase under ambient pressure. While the fcc phase is quite close to the instability, an isostructure phase transition happens by raising the temperature above 116 K, after which the crystal structure remains unchanged while the volume expands by 16% and the 4f electrons become localized.Gshneidner_1962 Further numerical studies by implementing the first-principles methods with dynamical mean-field theoryDMFT ; DMFT2 show that the phase may be stabilized by the entropy.antoine
Another mysterious phenomena in cerium is the intermediate pressure phase. At zero temperature, the cerium metal forms the face-centered-cubic (fcc) structure for pressure below 5.0 GPa and body-centered-tetragonal (bct) structure for pressure above 13.0 GPa. But the experimental results of the thermodynamic stable phase in the intermediate pressure region between 5.0 and 13.0 GPa are still quite controversial,Ellinger_1974 ; Guoliang_1995 ; Zhao_1997 ; Olsen_1985 ; McMahon_1997 ; Dmitriev_2004 as will be discussed below in detail.
Ellinger and Zachariasen applied x-ray-diffraction studies on high-pressure cerium with a diamond-anvil cell,Ellinger_1974 and they reported that for pressure between 5.0 and 13.0 GPa, the orthorhombic -Ce phase with an -uranium type of structure is the thermodynamic stable phase. They also found that the phase, which is monoclinic body centered with a deformed cubic face-centered structure, is the thermodynamic metastable phase. The conclusion that -Ce is the thermodynamic stable phase between 5.0 and 13.0 GPa while the phase is metastable has been supported by some of the follow-up experiments, i.e., Refs. Guoliang_1995 and Zhao_1997 , while another group of experiments led to the opposite conclusion, which indicated that the rather than the phase is the thermodynamic stable phase in the intermediate pressure regime. Using diamond-anvil cell and synchrotron radiation Olsen et al. studied the high-pressure phase diagram of cerium up to 46.0 GPa.Olsen_1985 They reported that the phase is the thermodynamic stable intermediate pressure phase of Ce, and no evidence for the phase with -uranium structure was found. This was the first experiment reporting the phase to be the thermodynamic stable intermediate pressure phase for cerium. After that several other groups also reported similar experimental results supporting the phase to be the thermodynamic stable phase of cerium for pressure between 5.0 and 13.0 GPa.McMahon_1997 ; Dmitriev_2004
The first-principles calculation is a powerful theoretical tool to predict the ground-state phases of solid. During the past two decades, many efforts have been made to reveal the thermodynamic stable phase for cerium under intermediate pressure by first-principles calculations. The early results of the linear muffin-tin orbital (LMTO) method found the phase to be the thermodynamic stable phase in the intermediate pressure regime between the low-pressure fcc phase and high-pressure bct phase,Skriver_1985 ; Eriksson_1991 which was consistent with the early experiments. After that, Söderlind and Eriksson et al. applied the generalized-gradient approximation (GGA) based on the full-potential linear muffin-tin orbital (FPLMTO) method to the same problemSoderlind_1995b and found that phase was the thermodynamic stable phase only in a small pressure interval. Ravindran et al. have made systematic electronic structure and total-energy studies on Ce and did not find any thermodynamic stable phase in the intermediate pressure regime between the low-pressure fcc phase to the high-pressure bct phase.Ravindran_1998 According to their results, both the and phases are metastable phases with the phase being lower in energy. After that, local-density approximation (LDA)- or GGA-type calculations by other groups using the plane-wave methodRichard_2001 or the exact muffin-tin orbitals (EMTO) methodLanda_2004 also got similar results, that both and phases are metastable phases and the thermodynamic stable phases of cerium are phase (low pressure) and bct phase (high pressure).
Although the 4f electrons in the phase are delocalized, the strong repulsive interaction among them still modifies its electronic structure significantly. Due to the insufficient treatment of the correlation effects, the bonding strength of the cerium has been over estimated by the LDA-type calculations, which leads to smaller volume and larger bulk modules compared with the experimental data. In the present paper, we apply the newly developed LDA+Gutzwiller method, which can satisfactorily treat the strong correlation effects in the 4f shell, to determine the thermodynamic stable phase of cerium under pressure. We first apply the above method to study the ground-state properties of cerium under the ambient pressure. Our results show that both the volume and bulk modules are improved dramatically, which manifests the importance of the strong correlation effect for the 4f electrons in cerium. Further we apply the same method to study the intermediate pressure phases of cerium, and the results show that in the intermediate-pressure region the phase is the thermodynamic stable phase and all other structures are either metastable or unstable, which is quite consistent with the recent experiments.McMahon_1997 ; Dmitriev_2004
The rest of the paper is organized as follows: A brief introduction of the LDA+Gutzwiller method are given in Sec. II. In Sec. III we discuss the main results of our LDA+Gutzwiller calculations with the comparison to the recent experimental results and LDA/GGA results. The summary and conclusions are given in the last section.
II LDA+Gutzwiller method
Gutzwiller first introduced the Gutzwiller variational approach to study the itinerant ferromagnetism in systems with partially filled d bands described by the Hubbard model.Gutzwiller_1960s Since then, the Gutzwiller variational approach has been widely applied to various strongly correlated systems.Bunemann ; Brinkman ; Vollhardt ; FCZhang ; Metzner Recently, we developed a computational method to incorporate LDA with the Gutzwiller variational approach, named the LDA+Gutzwiller method (simply called LDA+G hereafter),GTWang ; xydeng_2008 ; xydeng_2009 by successfully applying to a number of typical correlated materials, the reliability and feasibility of this method have been demonstrated. In the following we present the method briefly; please refer to our previous paperxydeng_2009 for more details.
Similar to LDA+U and LDA+DMFT methods, in LDA+G the LDA Hamiltonian, which can be extracted from the first-principles calculation, is implemented by a Hubbard-like local Coulomb interaction, which is not adequately treated within LDA. The effect of this local Coulomb interaction can thus be considered within the Gutzwiller variational approach. The Hamiltonian can be usually expressed as
| (1) |
with
| (2) |
where is the LDA part of the Hamiltonian extracted from the standard LDA calculation, is the on-site interaction term, where and are combined spin-orbit indices of localized basis on site , among which the local Hubbard interaction is implemented, ( is the orbital number, e.g., for electrons). is the double counting term representing the average orbital independent interaction energy already included by LDA. Without the term, the ground state can be exactly given by the Kohn-Sham uncorrelated wave function (KSWF) , which is a single Slater determinant made from the single-particle wave functions. However, with the increment of the interaction strength, the KSWF is no longer a good approximation because it gives too much weighting factor for those energetically unfavorable configurations. In order to give a better description of the ground state, the weighting factor of those unfavorable configurations should be suppressed, which is the main idea of Gutzwiller wave functions (GWFs) . A GWF is constructed by a many-particle projection operator acting on the uncorrelated KSWF, which reads
| (3) |
with
| (4) |
| (5) |
where is the projector to the specified configuration on site i. In Eq. (3), the role of projection operator is to adjust the weight of each atomic configuration through variational parameters . The GWF falls back to KSWF if all . On the other hand, if , the configuration on site i will be totally removed. In this way, both the itinerant behavior of uncorrelated wave functions and the localized behavior of atomic configurations can be described consistently, and the GWF can give a more accurate description of the correlated metallic systems than KSWF.
The total energy of the above system can be expressed as the expectation value of the Hamiltonian equation (1) using GWF, which takes the form
| (6) |
| (9) |
is called the effective Hamiltonian under Gutzwiller approximation.
The DFT calculations for realistic materials are always done in reciprocal space, so the formulas above should transform to the reciprocal space. We define the Bloch states of localized orbitals
| (10) |
Then in k space can be written as
| (11) |
where is the renormalization factor for local orbital , which depends on those Gutzwiller variational parameters ; for those noninteracting orbitals, the corresponding factor equals 1.
| (12) |
where and .
The total energy expressed in Eq. (12) depends on both the uncorrelated “starting” wave function and those Gutzwiller variational parameters , which can both be determined by minimizing the total energy. After we obtain the ground-state wave function, we can calculate most of the ground-state properties based on it; please refer to our paperxydeng_2009 for more details.
III results and discussions
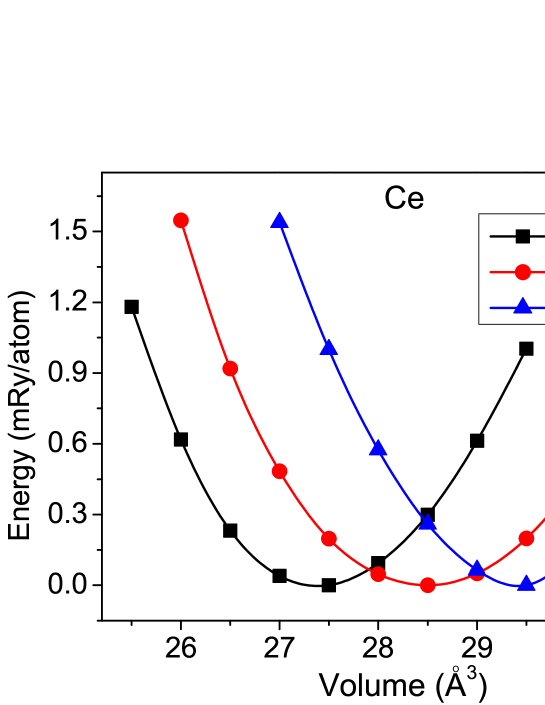
Like LDA+U and LDA+DMFT methods, in LDA+G the Hubbard-like local Coulomb interaction U will be chosen as the only empirical parameter. First we calculate the equilibrium volume for -Ce (fcc) to check the validity of the different U value as shown in Fig. 1. The volume of Ce under ambient pressure is between 28.0 and 29.0 Å3 reported experimentally,Ellinger_1974 ; Olsen_1985 so the equilibrium volume for eV (28.49 Å3) is in good agreement with experiments, while the equilibrium volume for eV (around 27.5 Å3) and eV (around 29.5 Å3) are smaller and larger than experiments, respectively. We also calculate the bulk modulus for -Ce under ambient pressure as shown in Table 1 together with the results from the all-electron FPLMTO calculations,Soderlind_1995a pseudopotential plane-wave calculations,Richard_2001 and experiments.Ellinger_1974 ; Olsen_1985 We can see from the table that the LDA calculation usually over-estimates the bonding strength among cerium atoms, which makes the equilibrium volume obtained by LDA to be about 20% smaller and bulk modules to be much larger than experiments. After treating the correlation effect more carefully by the Gutzwiller variational method, our results are in good agreement with experiments. Thus we set eV for all the calculations for cerium with different volume, which is consistent with other LDA+U and DMFT calculations, and spin-orbital coupling effect is always fully included.
| V (Å3) | B (GPa) | |
| LDA | 23.3Richard_2001 , 22.74Soderlind_1995a | 58.7Richard_2001 , 60.5Soderlind_1995a |
| GGA | 26.3Richard_2001 , 26.05Soderlind_1995a | 43.0Richard_2001 , 48.7Soderlind_1995a |
| ExperimentEllinger_1974 ; Olsen_1985 | 28-29 | 20-35 |
| Present (LDA+G) | 28.49 | 27.6 |
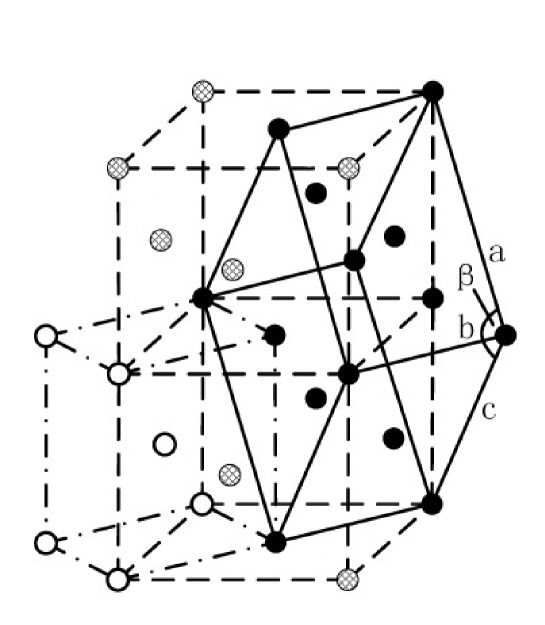
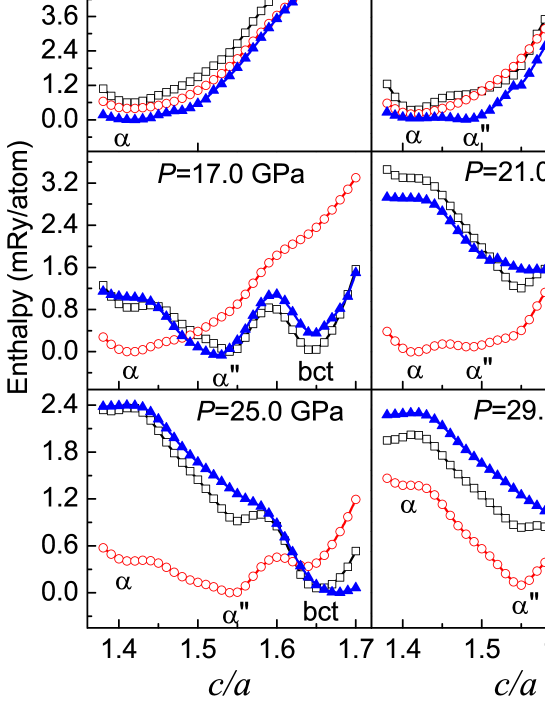
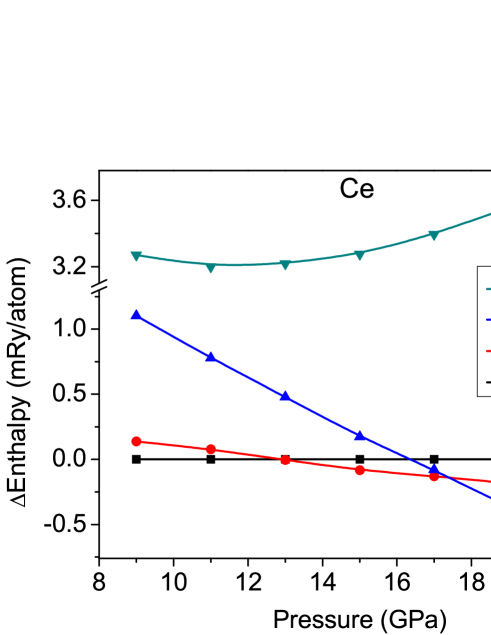
Early experiments have reported two intermediate-pressure phases of cerium, phase and phase, together with the low-pressure phase and high-pressure bct phase. The thermodynamic stability of these four phases under pressure is the main interest of the present work. Neglecting the tiny distortion in the phase, all these three phases including , , and the high-pressure bct phase can be treated within the same bct structure but with the different ratio of the lattice constants ,Olsen_1985 ; McMahon_1997 ; Soderlind_1995b which is illustrated in Fig. 2. The ratio is exactly for phase with the fcc structure and is found to be around 1.65 for the high-pressure bct phase. The ratio of the phase is reported experimentally to be around .Ellinger_1974 ; Olsen_1985 Therefore in the present paper, we first apply the LDA+G method to minimize the enthalpy of the cerium with bct structure with respect to the ratio as the function of pressure, which mimics the competition among the , , and high-pressure bct phases under pressure, and after that we will compare the enthalpy of these phases and the phase. Our main results have been plotted in Fig. 3 with the comparison to LDA and GGA. The results obtained by all three methods agree quite well for pressure less than 9.0 GPa indicating that the phase (fcc) with is the thermodynamic stable structure. For pressure between 9.0 and 25.0 GPa, the results obtained by LDA, GGA, and LDA+G are quite different. First of all, all three methods predict that all phases appear as the locally stable phases in this intermediate pressure region, while LDA results indicate that the phase is the thermodynamic stable phase in a very small region around 17.0 GPa. Although GGA gives a reasonably wide region from 23.0 to 27.0 GPa, within which the phase is globally stable, this pressure region is much higher than the experimental results, which is from 6.9 to 12.0 GPa.Olsen_1985 LDA+G predicts that the phase is the thermodynamic stable phase in the pressure region of 13.0–17.0 GPa, which is much closer to the experimental data.Olsen_1985 For pressure larger than 25.0 GPa, all three methods again reach the same conclusion that the high-pressure bct phase is thermodynamic stable, whereas the other two are either metastable or unstable.
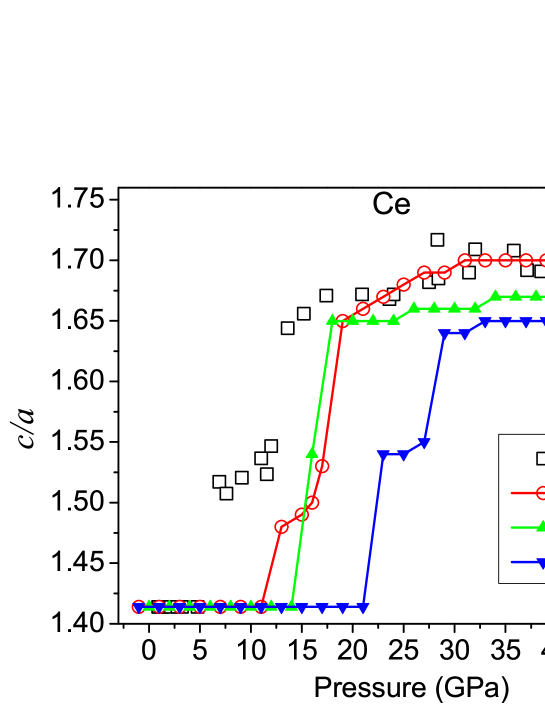
The optimized ratio as the function of pressure for Ce obtained from our LDA, GGA, and LDA+G calculations are plotted in Fig. 4 together with the experimental results.Olsen_1985 We can find clearly that the LDA+G calculation obtains the globally stable region of -Ce to be from 13.0 to 17.0 GPa, which is much closer to the experimental data,Olsen_1985 while LDA only gets a very narrow region for -Ce stable, and GGA gets the phase stable in a pressure region that is much higher than experimental data, as shown in Fig. 4.
The next issue to be addressed is the relative enthalpy of the phase compared with the other three phases discussed in the previous paragraph. The phase has a orthorhombic -U structure, which can be viewed as distorted fcc with some of the face-centered atoms being shifted from their original positions, as described by the parameter .Skriver_1985 The value obtained experimentally by McMahon and NelmesMcMahon_1997 is 0.2028 Å. If Åand , the standard fcc structure can be restored. Therefore we can calculate the energy of -Ce (fcc) and -Ce within the same -U structure. We use as obtained from the experiment,McMahon_1997 and optimize the value for any given volume. We find that gives the minimum energy for volume being 22.5 Å3, which is in good agreement with experiment.McMahon_1997 We calculated the enthalpy of -Ce (fcc) and -Ce within the same -U structure frame for a pressure region: 9.0 GPa 21.0 GPa. The enthalpy difference between them () is plotted in Fig. 5 together with the enthalpy difference of and obtained previously. Our results confirm that the phase is always higher in enthalpy in the entire pressure region considered in the present paper. We thus rule out the structure as a thermodynamic stable intermediate pressure phase of cerium. This conclusion is in good agreement with the FPLMTO calculations.Ravindran_1998 From Fig. 5 we can also see that the structure is the thermodynamic stable phase among the above-mentioned four possible phases within the pressure region 13.0–17.0 GPa. Therefore, based on the LDA+G calculation, we conclude that the phase is the thermodynamic stable phase for cerium in the intermediate pressure region. This conclusion is quite consistent with the most recent experiments.McMahon_1997 ; Dmitriev_2004
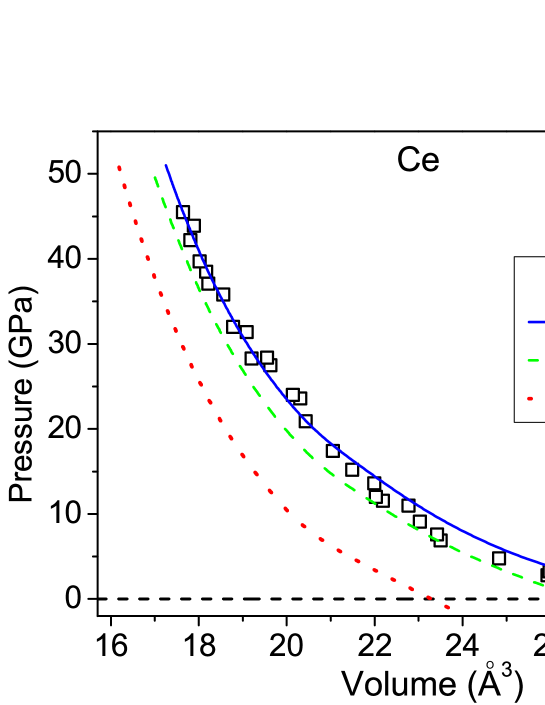
Based on the calculations in the previous paragraph, we obtain the multiphase equations of state (EOSs) for cerium metal, as shown in Fig. 6 together with the experimental data. The agreement between LDA+G results and the experimental dataOlsen_1985 is very good, while the GGA curve is slightly away especially in the low-pressure region and the LDA result is further away from the experimental data.
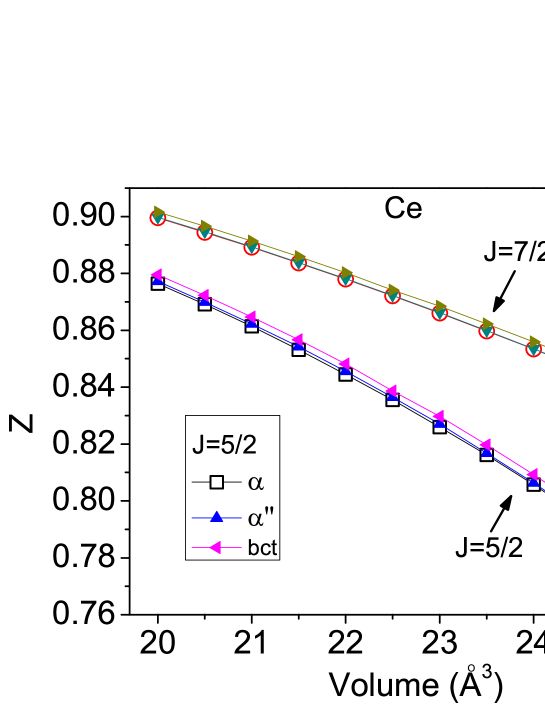
In Fig. 7, we plot the renormalization factor of the 4f bands in the , , and high-pressure bct phases as the function of volume. We can find that the renormalization factor of the 4f bands decreases monotonically with the increment of the volume for all the three phases, which can be easily explained by the fact that increasing volume reduces the hopping integral between the neighboring f orbitals, which enhances the correlation effect among 4f electrons and thus reduces the corresponding renormalization factor. From the present LDA+G calculation, we find that the main consequence of the correlation effect in the total energy is to reduce the kinetic energy. Since the fcc structure is close packed, compared with the phase, the phase has relatively higher kinetic energy gain, which is overcounted by LDA. Because of that, the reduction of kinetic energy gain captured by LDA+G is also more pronounced in the phase, which raises the total energy of the phase relative to the phase and makes it thermal dynamically unstable in the intermediate pressure region. We would like to emphasize that the renormalization factor obtained in Gutzwiller approximation is defined by the reduction of the kinetic energy, which is in general higher than that obtained by dynamical mean-field theory through the quasiparticle spectral weight of the Green’s function. Please refer to our previous paper for the detailed discussion on this point.xydeng_2008
IV conclusions
In summary, using the newly developed LDA+G technique, we have carried out systematical numerical study on the phase diagram of cerium metal under pressure. We found that the correlation effect among f electrons in cerium plays a crucial role to determine the thermodynamic stable phase of cerium in the intermediate pressure region. The LDA calculation overestimates the chemical bonding contributed by the 4f electrons, which leads to smaller equilibrium volume and larger bulk modulus compared to the experimental data. With the increment of pressure, the overlap between 4f orbitals becomes more and more pronounced, which reduces the correction to the total energy caused by the correlation effect. Therefore the correct description of the correlation effect, which evolutes with the pressure, becomes one of the key issues to obtain the correct phase diagram in the intermediate pressure region. Our numerical results obtained by the LDA+G method conclude that the phase is the thermodynamic stable phase in the intermediate-pressure region, which is quite consistent with the recent experiments.
ACKNOWLEDGMENTS: The authors thank L. Wang, J. N. Zhuang, G. Xu, and Q. M. Liu for their helpful discussions. We acknowledge the support from the 973 Program of China (Grant No. 2007CB925000), from the NSF of China (Grants No. NSFC 10876042 and No. NSFC 10874158), and that from the Development Foundation of CAEP (Grant No. 2008A0101001).
References
- (1) K. A. Gshneidner, Jr., R. O. Elliott, and R. R. McDonald, J. Phys. Chem. Solids 23, 555 (1962).
- (2) K. Haule, V. Oudovenko, S. Y. Savrasov, G. Kotliar, Phys. Rev. Lett. 94,036401 (2005).
- (3) K. Held, A. K. McMahan, and R. T. Scalettar, Phys. Rev. Lett. 87, 276404 (2001).
- (4) B. Amadon, S. Biermann, A. Georges, F. Aryasetiawan, Phys. Rev. Lett. 96, 066402 (2006).
- (5) F. H. Ellinger and W. H. Zachariasen, Phys. Rev. Lett. 32, 773 (1974). W. H. Zachariasen and F. H. Ellinger, Acta Crystallogr. Sec. A 33, 155 (1977).
- (6) Guoliang Gu, Yogesh K. Vohra, and Keith E. Brister, Phys. Rev. B 52, 9107 (1995).
- (7) Y. C. Zhao and W. B. Holzapfel, J. Alloys Compd. 246, 216 (1997).
- (8) J. Staun Olsen, L. Gerward, U. Benedict, and J. P. Itié, Physica B 133, 129 (1985)
- (9) M. I. McMahon and R. J. Nelmes, Phys. Rev. Lett. 78, 3884 (1997).
- (10) V. P. Dmitriev, A. Yu. Kuznetsov, O. Bandilet, P. Bouvier, L. Dubrovinsky, D. Machon, and H.-P. Weber, Phys. Rev. B 70, 014104 (2004).
- (11) Hans L. Skriver, Phys. Rev. B 31, 1909 (1985)
- (12) J. M. Wills, O. Eriksson and A. M. Boring, Phys. Rev. Lett. 67, 2215 (1991). O. Eriksson, J. M. Wills, and A. M. Boring, Phys. Rev. B 46, 12981 (1992).
- (13) P. Söderlind, O. Eriksson, B. Johansson, and J. M. Wills, Phys. Rev. B 52, 13169 (1995). P. Söderlind, Adv. Phys. 47, 959 (1998).
- (14) P. Ravindran, L. Nordström, R. Ahuja, J. M. Wills, B. Johansson, O. Eriksson, Phys. Rev. B 57, 2091 (1998).
- (15) Nicolas Richard and Stéphane Bernard, J. Alloys Compd. 323, 628 (2001).
- (16) A. Landa, P. Söderlind, A.Ruban, L.Vitos and L. Pourovskii, Phys. Rev. B 70, 224210 (2004).
- (17) M. C. Gutzwiller, Phys. Rev. Lett. 10, 159 (1963); Phys. Rev. 134, 923 (1964); 137, 1726 (1965).
- (18) W. F. Brinkman and T. M. Rice, Phys. Rev. B 2, 4302 (1970).
- (19) D. Vollhardt, Rev. Mod. Phys. 56, 99 (1984). F. Gebhard and D. Vollhardt, Phys. Rev. Lett. 59, 1472 (1987); Phys. Rev. B 38, 6911 (1988). D. Vollhardt, P. G. J. Van Dongen, F. Gebhard, and W. Metzner, Mod. Phys. Lett. B 4, 499 (1990).
- (20) F. C. Zhang, C. Gros, T. M. Rice, and H. Shiba, Supercond. Sci. Technol. 1, 36 (1988).
- (21) W. Metzner and D. Vollhardt, Phys. Rev. Lett. 59, 121 (1987); Rev. B 37, 7382 (1988); Phys. Rev. Lett. 62, 324 (1989); W. Metzner, Z. Phys. B: Condens. Matter 77, 253 (1989).
- (22) J. Bünemann, F. Gebhard, and W. Weber, J. Phys.: Condens. Matter 9, 7343 (1997); J. Bünemann and W. Weber, Phys. Rev. B 55, 4011 (1997); J. Bünemann, W. Weber, and F. Gebhard, ibid. 57, 6896 (1998); J. Bünemann, F. Gebhard, and W. Weber, Found. Phys. 30, 2011 (2000); C. Attaccalite and M. Fabrizio, Phys. Rev. B 68, 155117 (2003).
- (23) G. T. Wang, X. Dai, and Z. Fang, Phys. Rev. Lett. 101, 066403 (2008).
- (24) XiaoYu Deng, Xi Dai and Zhong Fang, Eur. Phys. Lett. 83, 37008 (2008).
- (25) XiaoYu Deng, Lei Wang, Xi Dai, and Zhong Fang, Phys. Rev. B 79, 075114 (2009).
- (26) P. Söderlind, O. Eriksson, J. Trygg, B. Johansson, J.M. Wills, Phys. Rev. B 51, 4618 (1995).