How AGN feedback and metal cooling shape cluster entropy profiles
Abstract
Observed clusters of galaxies essentially come in two flavors: non cool core clusters characterized by an isothermal temperature profile and a central entropy floor, and cool-core clusters where temperature and entropy in the central region are increasing with radius. Using cosmological resimulations of a galaxy cluster, we study the evolution of its intracluster medium (ICM) gas properties, and through them we assess the effect of different (sub-grid) modelling of the physical processes at play, namely gas cooling, star formation, feedback from supernovae and active galactic nuclei (AGN). More specifically we show that AGN feedback plays a major role in the pre-heating of the proto-cluster as it prevents a high concentration of mass from collecting in the center of the future galaxy cluster at early times. However, AGN activity during the cluster’s later evolution is also required to regulate the mass flow into its core and prevent runaway star formation in the central galaxy. Whereas the energy deposited by supernovae alone is insufficient to prevent an overcooling catastrophe, supernovae are responsible for spreading a large amount of metals at high redshift, enhancing the cooling efficiency of the ICM gas. As the AGN energy release depends on the accretion rate of gas onto its central black hole engine, the AGN responds to this supernova enhanced gas accretion by injecting more energy into the surrounding gas, and as a result increases the amount of early pre-heating. We demonstrate that the interaction between an AGN jet and the ICM gas that regulates the growth of the AGN’s BH, can naturally produce cool core clusters if we neglect metals. However, as soon as metals are allowed to contribute to the radiative cooling, only the non cool core solution is produced.
keywords:
galaxies: clusters: general – galaxies: active – galaxies: jets – methods: numerical1 Introduction
Galaxy clusters are the largest virialised structures in the Universe directly observed using radio relics, the Sunyaev Zel’dovich effect, gravitational lensing, and X-ray measurements. These observations provide support to a cold dark matter like bottom-up formation scenario, by showing that a large variety of clusters, spanning an increasingly wider mass range, are present at different epochs, from smooth relaxed objects to disturbed and merging ones. However, such support comes at a cost: as one goes back further in time, the build-up of clusters becomes a progressively more complex process that involves accretion of cold material from the diffuse inter-galactic medium (IGM) and filaments, shock heating in the proto-cluster potential well along with multiple mergers potentially stripping a significant amount of gas and stars from galaxies.
Although the assembly histories of different clusters are generally extremely different, X-ray measurements of unperturbed galaxy clusters feature gas with similar properties, especially entropy111We take the usual definition of the entropy in astrophysics , where is the gas temperature and is the electron number density assuming a mean molecular weight for electrons of in the hot cluster gas. The logarithm of this entropy is the standard definition of entropy in thermodynamics . profiles, which are strikingly self-similar down to the central 100 (or even 10 in some cases) kiloparsecs (Lloyd-Davies et al., 2000; Piffaretti et al., 2005; Donahue et al., 2006; Morandi & Ettori, 2007; Cavagnolo et al., 2009; Sanderson et al., 2009; Pratt et al., 2010). This is interpreted as the consequence of the formation of a large-scale gravitational-shock which heats the cold infalling gas from the IGM ( K) into an extremely hot and turbulent intra-cluster medium (ICM) with temperatures around - K (Tozzi & Norman, 2001).
However in the cores ( kpc) of these clusters there seem to exist a dichotomy in gas properties which has led observers to split cluster samples into ’cool core’ and ’non-cool core’ clusters. Arguably the most relevant of these gas properties is the entropy, as non-cool core clusters exhibit a well defined entropy floor in their centre, whereas in cool-core clusters the entropy profile decreases with decreasing radius on all scales (Morandi & Ettori, 2007; Sanderson et al., 2009). This lack of entropy floor in the central regions of some clusters is believed to be the signature of a cooling core because of the decreasing central temperature profile associated to it (Sanderson et al., 2006; Vikhlinin et al., 2006; Pratt et al., 2007).
On the other hand, one of the long-standing problems of cosmological hydrodynamics simulations of cluster formation is the so-called ‘cooling catastrophe’ which takes place when gas is allowed to radiatively cool and ‘standard’ sub-grid physics, such as star formation and feedback from supernovae (SN), is implemented (Suginohara & Ostriker, 1998; Lewis et al., 2000; Pearce et al., 2000; Borgani et al., 2002; Ettori et al., 2004; Kravtsov et al., 2005; Borgani et al., 2005; Nagai et al., 2007). Runaway cooling occurs, with severe consequences on both ICM and galaxy properties: the formation of an enormous cooling flow of gas ( M⊙/yr) into the core triggers an anomalously high emission of X-rays, the presence of a persistent galactic disc of gas, and tremendous episodes of star formation. Central galaxies rapidly become too massive and blue. Thus, getting realistic thermodynamical properties of the ICM by numerical means constitutes a major challenge.
Several processes have been invoked to solve this theoretical puzzle: pre-heating from early feedback processes in high-redshift galaxies (Babul et al., 2002), Active Galactic Nuclei (AGN) feedback from quasars or radio jets (Binney & Tabor, 1995; Rephaeli & Silk, 1995), conduction of thermal energy from the outer shock-heated regions carried by electrons (Voigt & Fabian, 2004; Rasera & Chandran, 2008), and gas sloshing from minor and major mergers (Fabian & Daines, 1991). Whilst the verdict is still out for early pre-heating and thermal conduction, the ability of AGN feedback to stem cooling flows has already been demonstrated in several hydrodynamics simulations (Sijacki & Springel, 2006; Sijacki et al., 2007; Khalatyan et al., 2008; Puchwein et al., 2008; Fabjan et al., 2010; Dubois et al., 2010; McCarthy et al., 2010; McCarthy et al., 2011; Teyssier et al., 2011). It seems therefore natural to consider such a feedback mechanism as key to account for the self-regulation of the cold baryonic content of massive galaxies. However it remains to be demonstrated whether or not it can also explain the wide variety of observed ICM properties. Especially, it is not obvious how such a physical process can reproduce the cool/non-cool core dichotomy observed in the population of galaxy clusters.
In a recent work (Dubois et al., 2010), we demonstrated that jet-mechanical feedback from a central AGN is able to suppress the cooling catastrophe in a re-simulated cosmological galaxy cluster. Using a different numerical approach for gas dynamics and AGN feedback, McCarthy et al. (2011) recently showed that the excess of entropy in the cores of a few galaxy groups is generated by the selective ejection of low-entropy material at high redshift -4 caused by both SN and AGN feedback. However much work is still needed to assess (i) whether the same mechanism works for more massive structures such as galaxy clusters, where mass loss from large outflows can be more easily prevented and (ii) to which extent such a mechanism depends on the numerical method and the specific subgrid model implemention of the AGN feedback.
Therefore the aim of the present paper is to explore how various implementations of AGN feedback, which differ either by the nature of the energy injected (kinetic or thermal) or by the epoch at which this energy injection occurs, impact the ICM gas properties. More specifically, we focus on the time evolution of thermodynamical quantities and mass distributions in our simulations, comparing and contrasting our results with observations whenever possible. The paper is organised as follows. In section 2, we describe the basic numerical ingredients of the simulations which are analysed. In section 3, we present our results and compare the evolution of entropy, density and temperature profiles of the simulated galaxy clusters. Finally in section 4, we discuss the consequences of these numerical experiments.
2 Numerics
The simulations presented in this paper use variations around the sub-grid physics and the exact same initial conditions as in Dubois et al. (2010). For completeness’ sake we briefly recall in this section the basics of the numerical models that we employ.
2.1 Physics of galaxy formation
Gas radiates energy through atomic collisions assuming a H/He primordial composition (Sutherland & Dopita, 1993). As a result it can collapse into dark matter (DM) potential wells to form galaxies (Silk, 1977). To model reionization, a homogeneous UV background heating is imposed from using the prescription of Haardt & Madau (1996). Star formation occurs in high gas density regions (). When the density threshold is surpassed, a random Poisson process spawns star cluster particles according to a Schmidt law , where is the gas free-fall time and is the star formation efficiency, taken to be (Krumholz & Tan, 2007) in order to reproduce the observational surface density laws (Kennicutt, 1998). The reader can consult Rasera & Teyssier (2006) and Dubois & Teyssier (2008) for more information on the star formation method.
Feedback from SN type II is included in a similar fashion as Dubois & Teyssier (2008): we model SN explosions by modifying the gas mass, momentum, and energy of surrounding cells following a Sedov blast wave solution. We adopt this approach because since we do not resolve SN remnants, thermal energy input in local cells would be quickly radiated away by the efficient gas cooling in the inter-stellar medium (ISM, Navarro & White, 1993). Our sub-grid model yields a physically motivated description of SN bubble expansion, and produces large-scale galactic winds in low-mass halos (Dubois & Teyssier, 2008). As we adopt a Salpeter IMF for star formation, we release an average of ergs per 150 of stars formed in SN explosions. We return all the gas expelled by the SN explosion after 10 Myr, 10 % of which is assumed to be metals which we advect as a passive scalar. These metals also contribute to the cooling function of the gas assuming a Solar abundance ratio for the different elements.
We use a modified equation of state (EoS) at high gas density to prevent numerical instabilities from artificially growing on the smallest grid scales (Truelove et al., 1997). More specifically, the minimum temperature in dense regions is set to , with , and which leads to a constant Jeans mass . Such a value of the polytropic index is a rough approximation of the complex functional form of the EoS obtained by analytical modeling of the multiphase structure of the ISM in Springel & Hernquist (2003).
We introduced a novel numerical scheme for AGN feedback in Dubois et al. (2010) based on bipolar kinetic outflows (or jets). We assume that a unique black hole (BH) engine located at the center of each galaxy pumps a fraction of the energy it gains by accreting gas into such a jet. BHs, are modeled as sink particles (Bate et al., 1995; Krumholz et al., 2004), and can grow both by mergers with other BHs, and by accreting some of the surrounding gas according to the Bondi accretion rate
| (1) |
where is a dimensionless boost factor that accounts for the unresolved small scale structure of the ISM (Booth & Schaye, 2009), is the gravitational constant, is the black hole mass, is the average gas density, is the average sound speed, and is the average velocity of the black hole with respective to the surrounding gas. The accretion rate onto a BH is Eddington-limited
| (2) |
where is the Thompson cross-section, is the speed of light, is the proton mass, and is the radiative efficiency, assumed to be equal to for the Shakura & Sunyaev (1973) accretion onto a Schwarzschild BH.
The total AGN luminosity is simply proportional to the rest-mass accreted energy
| (3) |
where is set to 1 to recover –, – relations consistent with observational findings (Tremaine et al., 2002; Häring & Rix, 2004) using AGN jets (Dubois et al., in prep.). The gas properties are locally modified around the BH to account for the presence of a jet with km/s velocity (as in the original prescription of Omma et al. (2004), see Dubois et al., 2010 for more details on the scheme) within a cylinder of radius and height .
We have also introduced a thermal implementation of AGN feedback (Teyssier et al., 2011) based on earlier works performed with smoothed-particle hydrodynamics (SPH) simulations (Sijacki et al., 2007; Booth & Schaye, 2009). In this alternative subgrid modelling, we release the AGN energy in a thermal form as soon as it reaches a level high enough to reheat the surrounding gas to temperatures above K. The radius of the injection bubble centred on the BH is chosen to be . As the energy is more efficiently coupled to the gas, we have to assume a different efficiency . As in the jet case, its value of to reproduce the –, – relations. All other parameters of the model are kept identical to the AGN jet feedback.
2.2 Initial conditions and simulation runs


The simulations are run with the Adaptive Mesh Refinement (AMR) code ramses (Teyssier, 2002). The Euler equations are solved using a second-order unsplit Godunov scheme. More specifically, fluxes at cell interfaces are computed using an approximate Riemann solver where variables interpolated from cell-centered values are reconstructed with a first-order MinMod Total Variation Diminishing scheme. The Poisson equation is solved using a particle-mesh method where collisonless particles (DM, stars and sink particles) are added to the AMR grid with a Cloud-in-Cell algorithm.
We assume a flat CDM cosmology with total matter density , baryon density , dark energy density , rms mass fluctuation amplitude in spheres of and Hubble constant that corresponds to the Wilkinson Microwave Anisotropies Probe (WMAP) 1 year best-fit cosmological model (Spergel et al., 2003). The simulations are performed using a resimulation (zoom) technique: the coarse region is a grid with DM resolution in a simulation box. This region contains a smaller equivalent grid in a sphere of radius with DM resolution, which in turn encloses the final high resolution sphere with radius , a equivalent grid and DM resolution.
Cells in the highest resolution region may be adaptively refined up to levels of refinement, maintaining a constant physical resolution of at all times. Refinement follows a quasi-Lagrangian criterion: if more than 8 DM particles lie in a cell, or if the baryon mass exceeds 8 times the initial DM mass resolution, the cell is refined. A Jeans length criterion is also added to ensure the numerical stability of the scheme on all levels (Truelove et al., 1997) where : we force the cells fulfilling these conditions to sample the local Jeans length with more than 4 cells.
With this particular set of initial conditions we follow the formation of a galaxy cluster with mass , and radius kpc at , where the subscript stands for the mass and radius at 500 times the average density of the Universe (see AGNJETrun simulation data in table 1). This cluster undergoes a 1:1 major merger from down to (see fig. 2 of Dubois et al., 2010), naturally separating early time evolution where the pre-heating in the proto-cluster structures takes place, from late-time evolution during which the gas of the cluster relaxes.
| Name | Cooling | SF | SN | AGN | |||||
|---|---|---|---|---|---|---|---|---|---|
| (kpc) | () | (kpc) | () | () | |||||
| ADIArun | No | No | No | No | 944 | 486 | – | ||
| NOAGNrun | Primordial | Yes | No | No | 956 | 514 | – | ||
| AGNJETrun | Primordial | Yes | No | Jet (Dubois et al., 2010) | 944 | 486 | |||
| AGNHEATrun | Primordial | Yes | No | Heat (Teyssier et al., 2011) | 949 | 496 | |||
| AGNOFFrun | Primordial | Yes | No | Jet () & No () | 946 | 496 | |||
| ZNOAGNrun | Metal | Yes | Yes | No | 961 | 536 | – | ||
| ZAGNJETrun | Metal | Yes | Yes | Jet (Dubois et al., 2010) | 939 | 474 | |||
| ZAGNHEATrun | Metal | Yes | Yes | Heat (Teyssier et al., 2011) | 936 | 479 | |||
| ZAGNOFFrun | Metal | Yes | Yes | Jet () & No () | 946 | 486 |
In Dubois et al. (2010), we performed two simulations to explore the role of AGN feedback on the regulation of the cooling catastrophe: one simulation with AGN feedback, cooling and star formation (AGNJETrun), and another identical to the first where AGN feedback was switched off (NOAGNrun). In this paper, we add several new simulations to this set to understand the impact of the AGN sub-grid modelling and the influence of early pre-heating on our results. Namely, we run an adiabatic simulation that ignores cooling and star formation (ADIArun), a simulation with thermal AGN feedback as in Teyssier et al. (2011) (AGNHEATrun), and a simulation that involves restarting the AGNJETrun simulation at (after the major merger has taken place) and thereafter deactivating the gas accretion onto the BHs and the related AGN feedback (AGNOFFrun). The first new simulation (ADIArun) allow us to study the thermal properties of this cluster under the simplest physical conditions (gravity and gas dynamics only). The second new simulation (AGNHEATrun) allows us to compare the impact of the type of AGN feedback on the evolution of the cluster. Finally with the third new simulation (AGNOFFrun) we assess whether it is the AGN feedback at early or late times that shapes the thermodynamics of the cluster at and prevents a cooling catastrophe.
On top of that, we also add a new set of simulations including metal cooling where the metals are produced self-consistently in SN explosions and advected with the flow (ZNOAGNrun, ZAGNJETrun, and ZAGNHEATrun). These enable us to quantify the importance of metal cooling on the ICM gas dynamics.
The properties of the whole set of simulations are summarized in table 1.
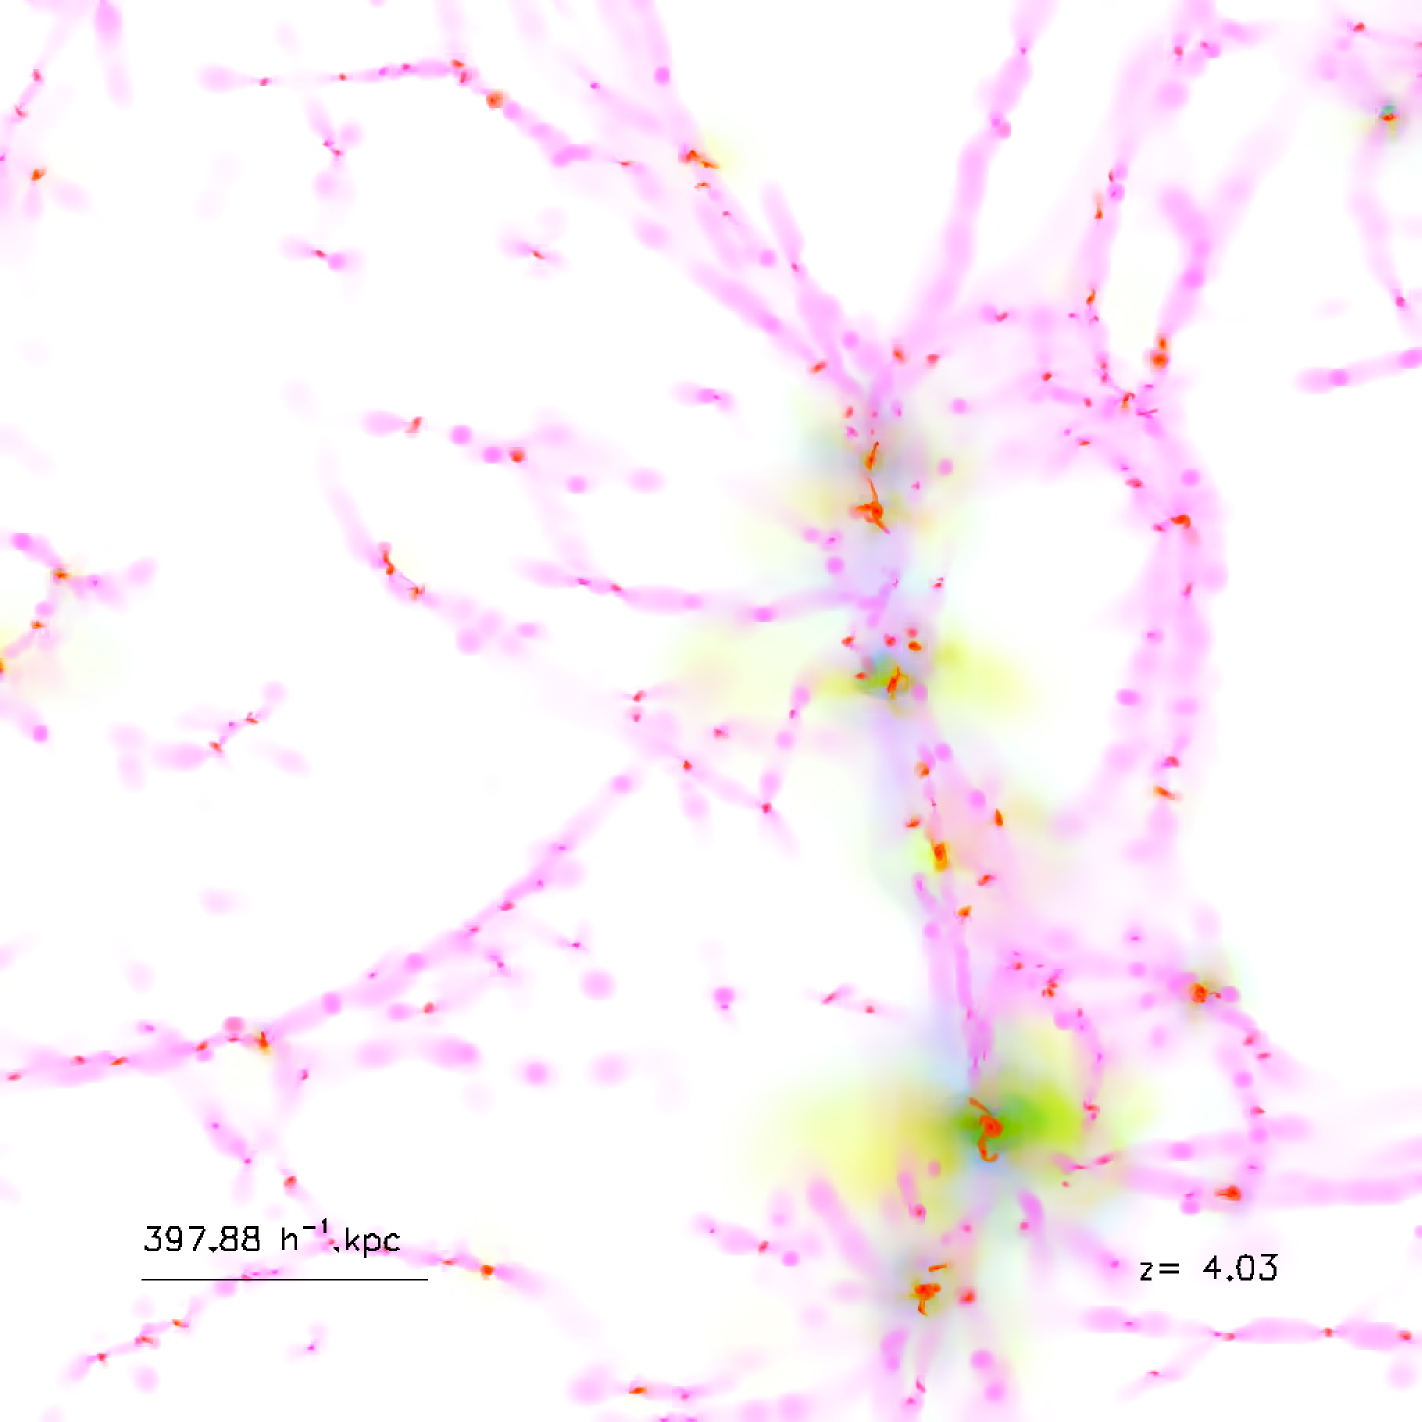
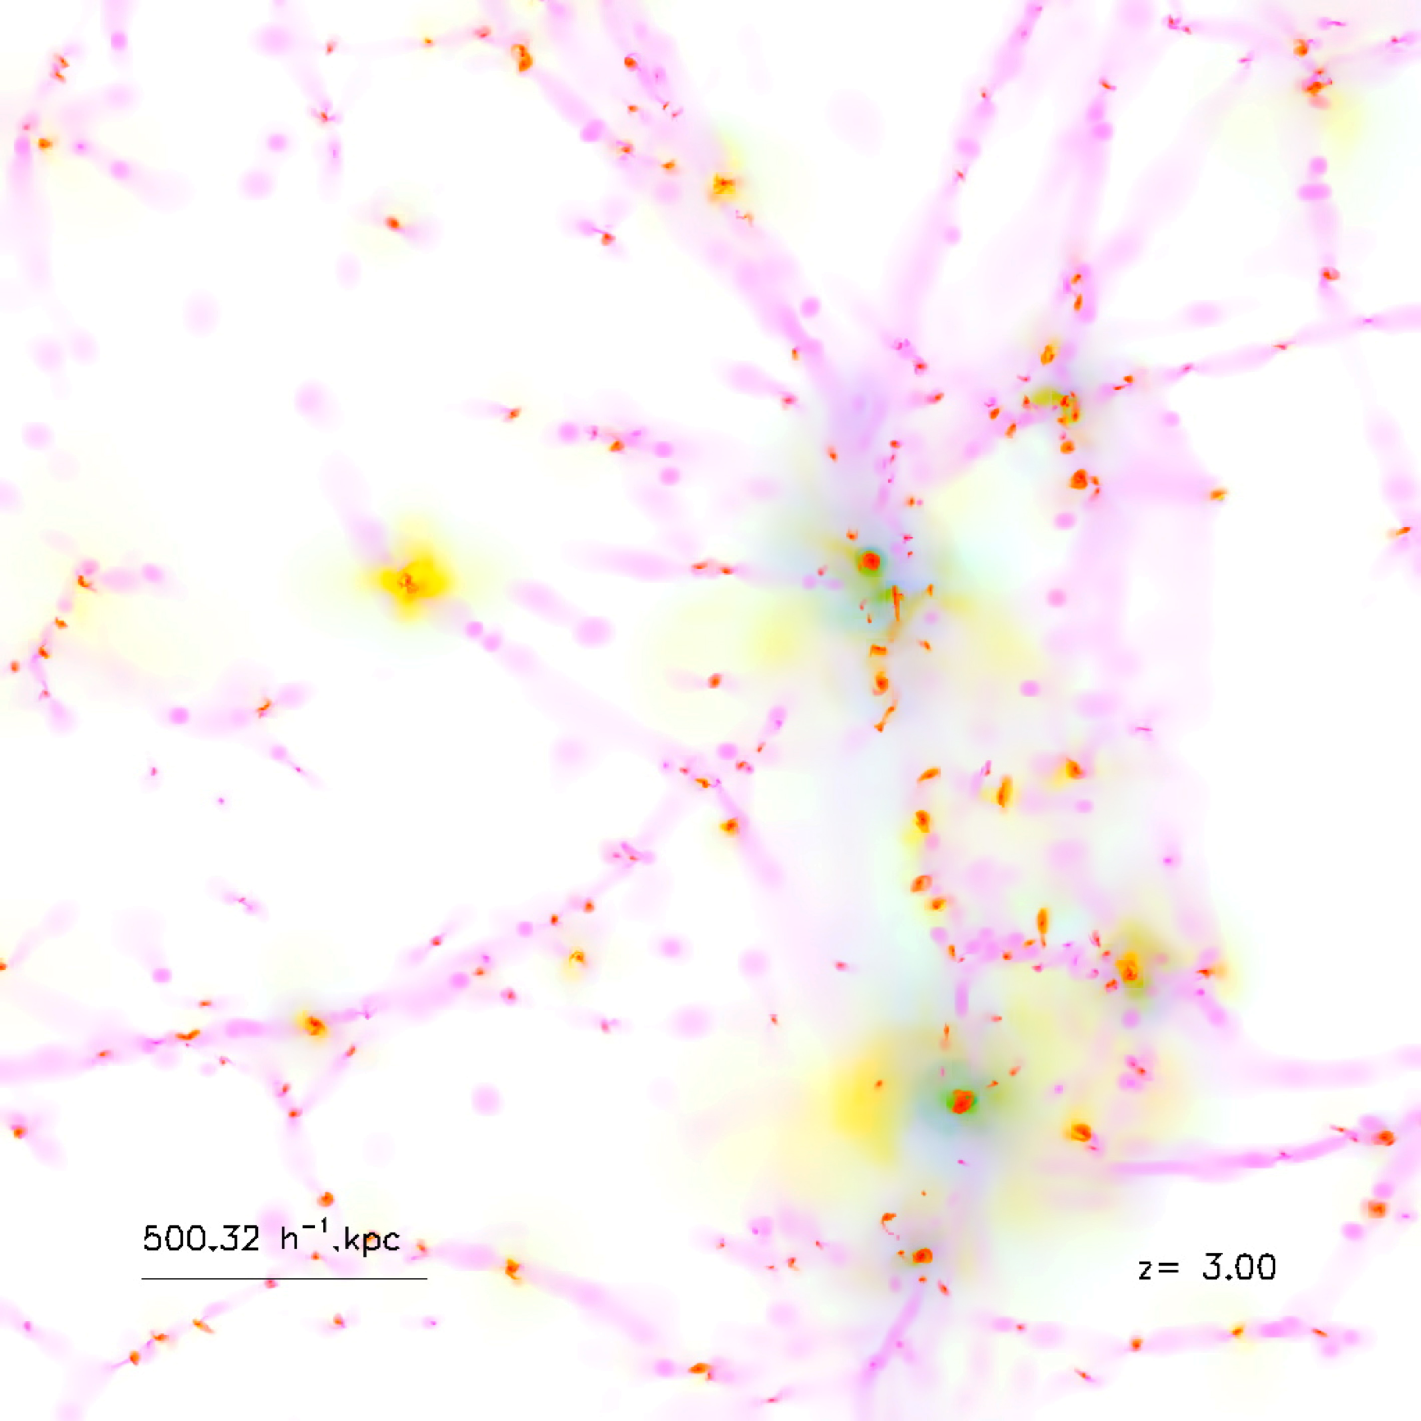
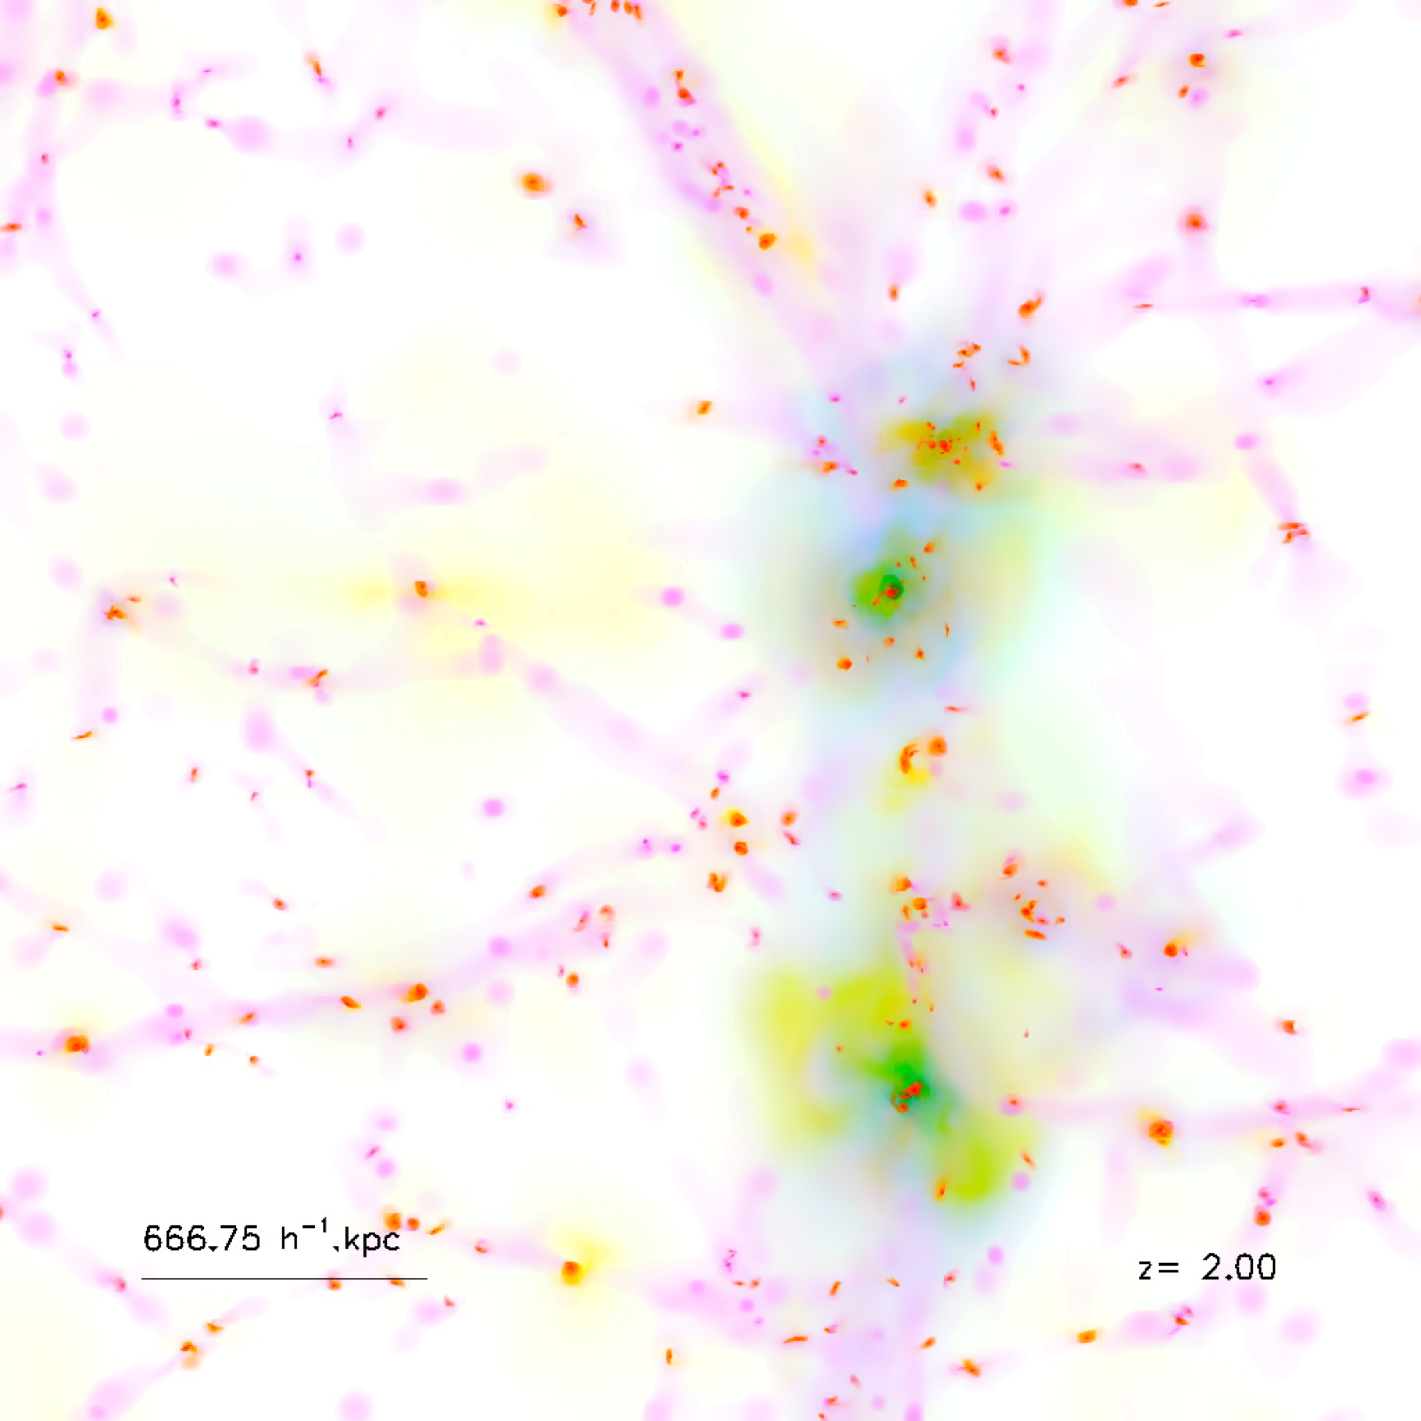
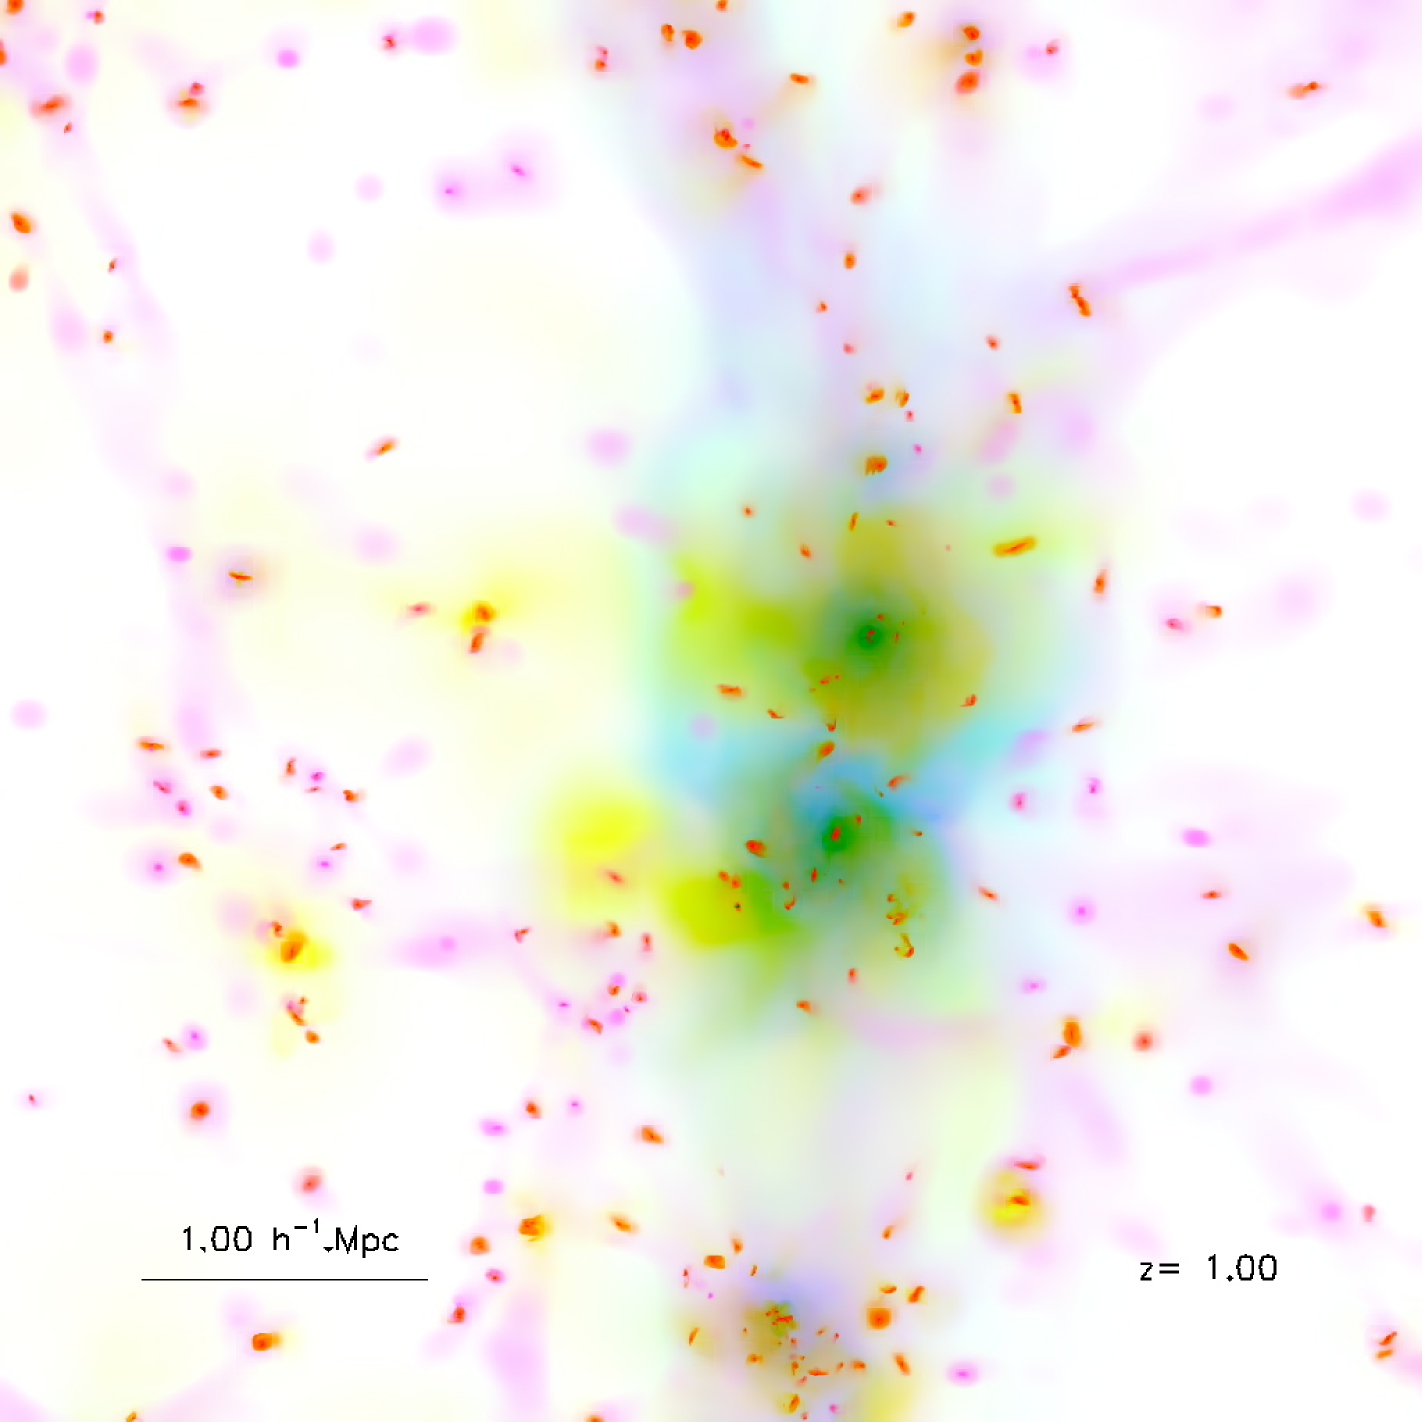
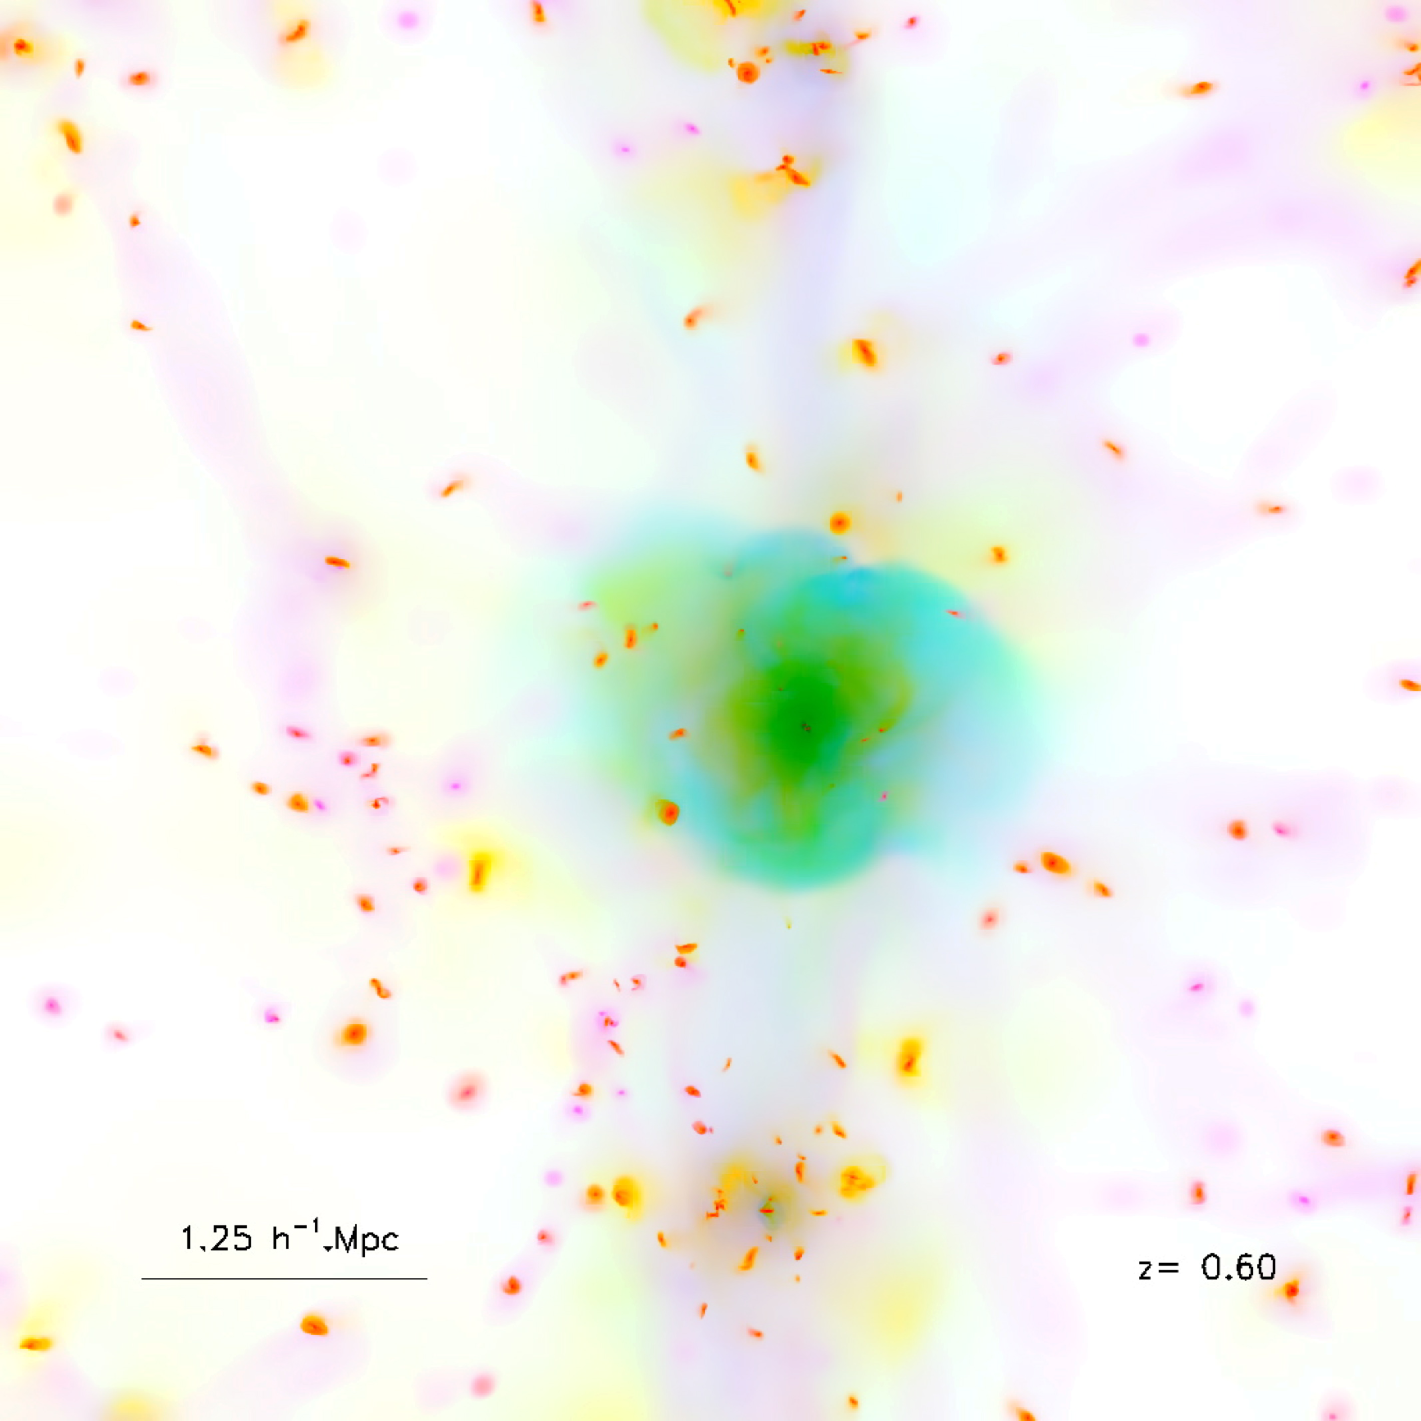
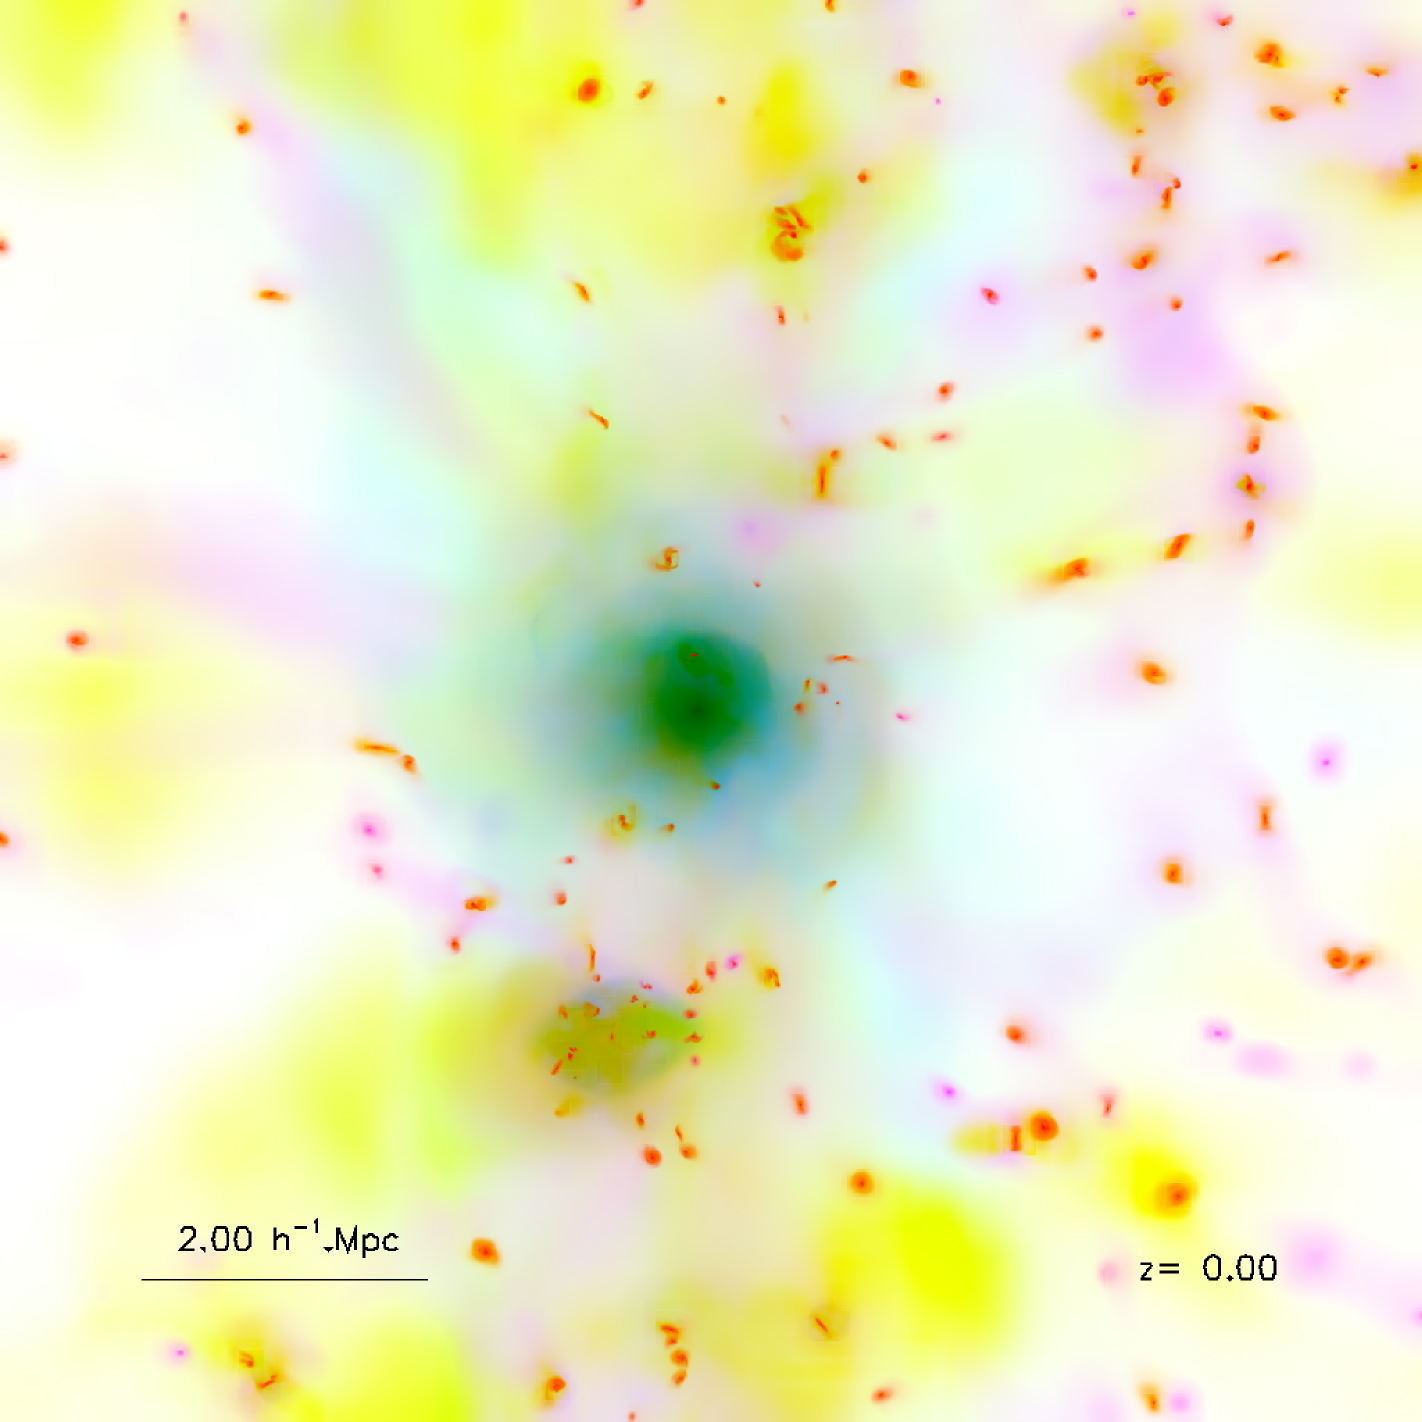
Fig. 1 shows a time sequence of the ZAGNJETrun simulation inside the zoom region (10 comoving on a side). The early evolution of the progenitors of the cluster at high redshift (upper panels) shows the filamentary structure of the early Universe (gas density in magenta), and the deposit of metals (yellow color) in the IGM through SN feedback and AGN feedback, which correspond to a strong pre-heating phase. The merger of the two clusters between (pre-merger phase, bottom left panel) and (post-merger phase, bottom middle panels) produces a strong shock (temperature coded in cyan) during the encounter and shock waves develop at larger distance during the post-merger. The final output of the simulation shows the relaxed cluster (bottom right panel).
3 Results
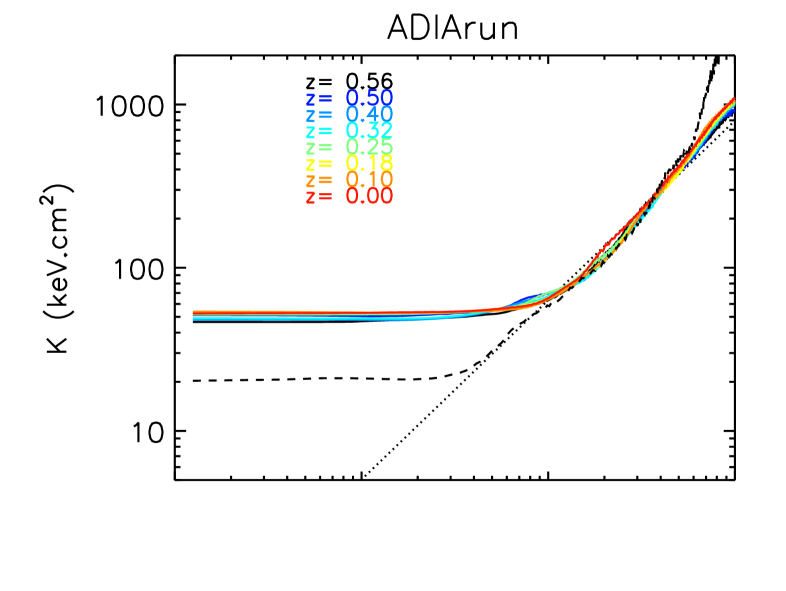
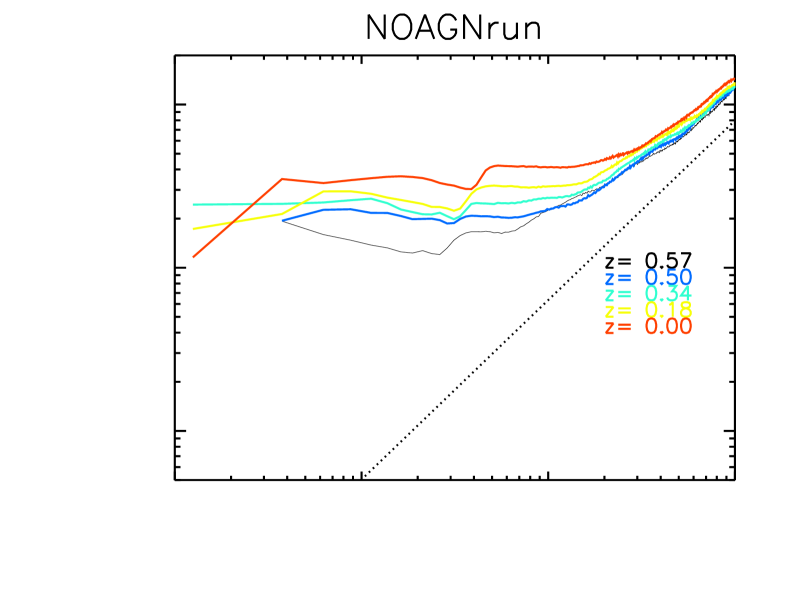
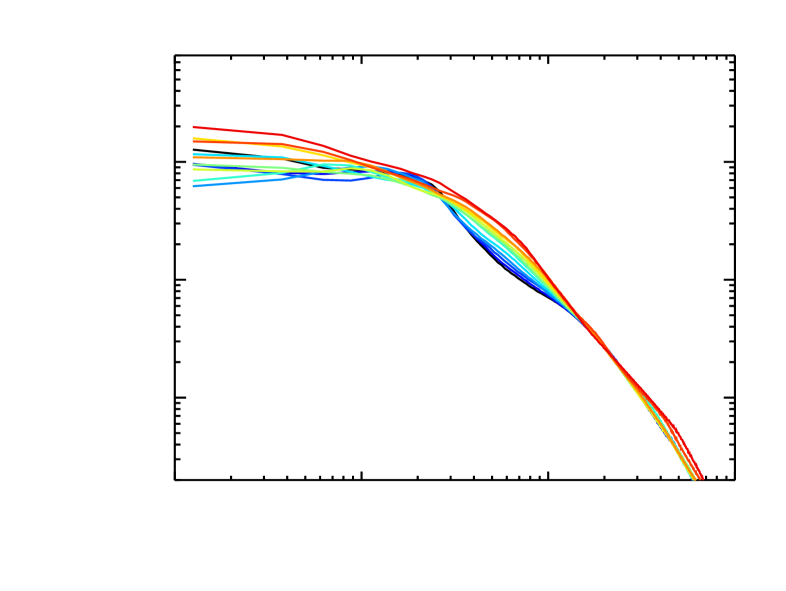
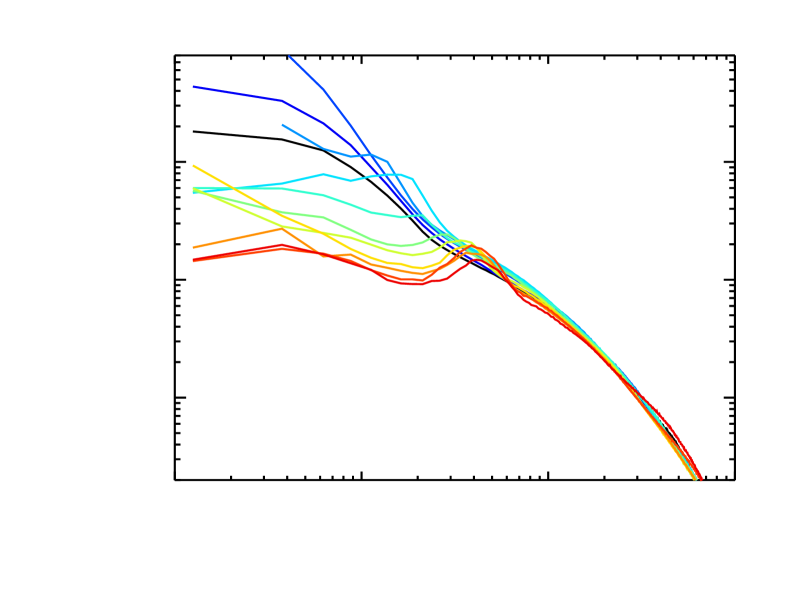
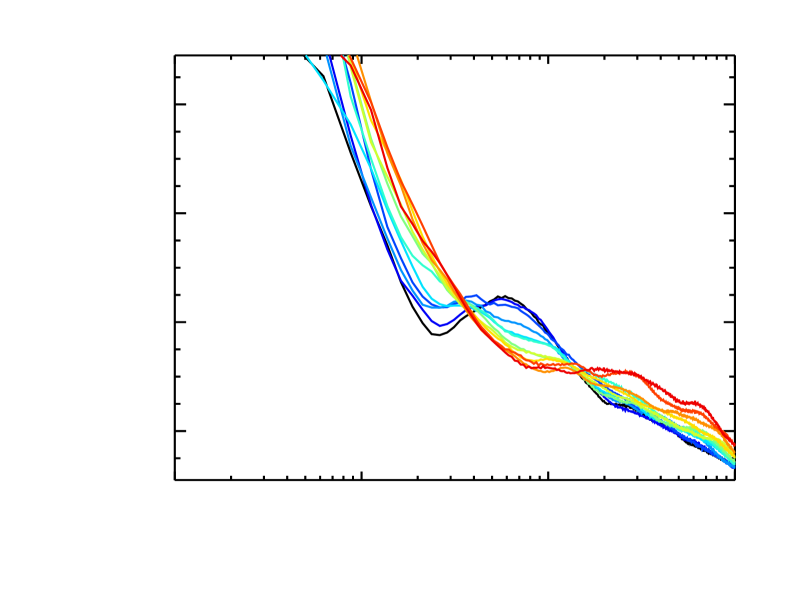
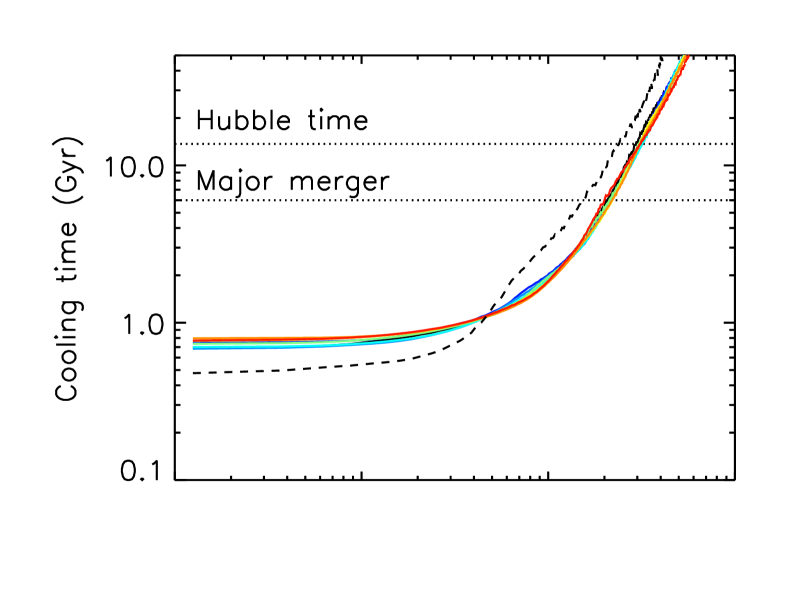
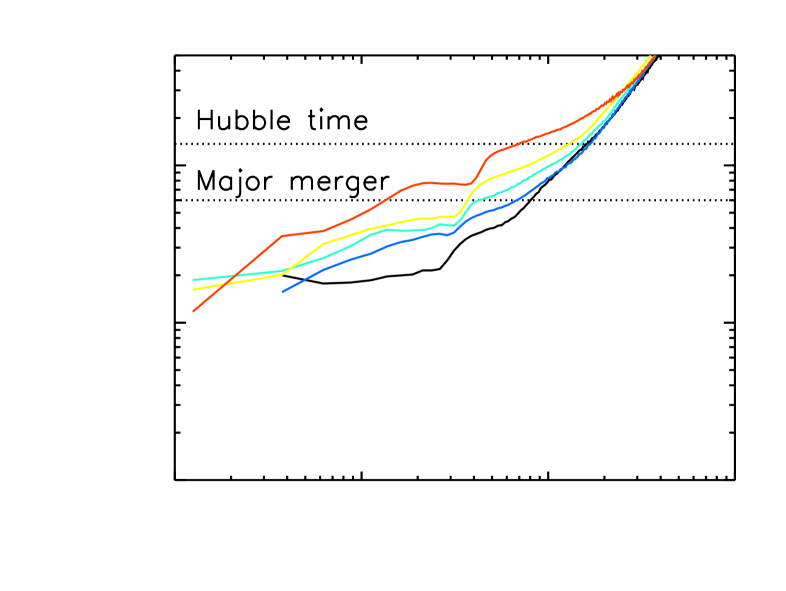
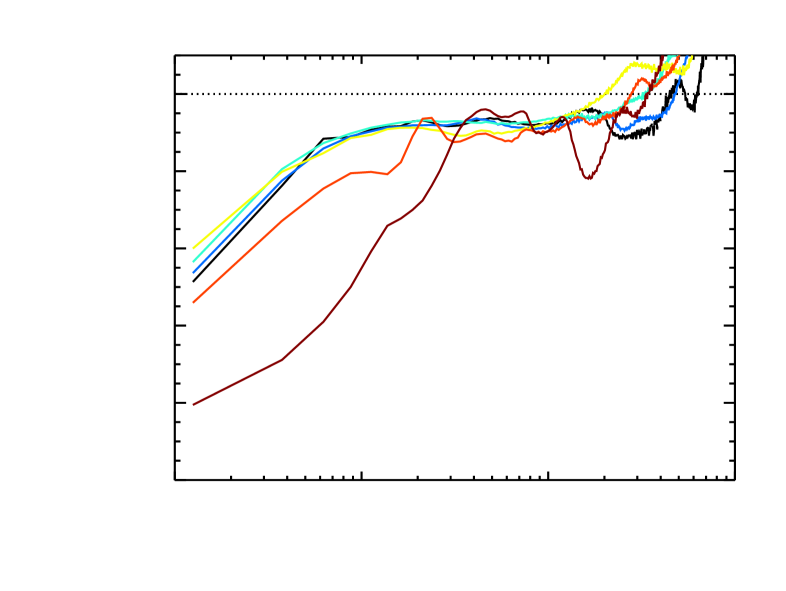
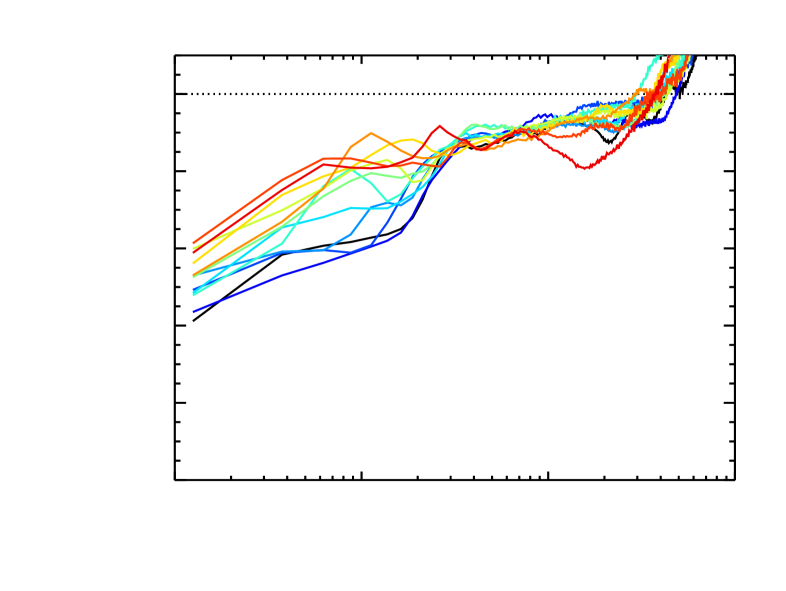
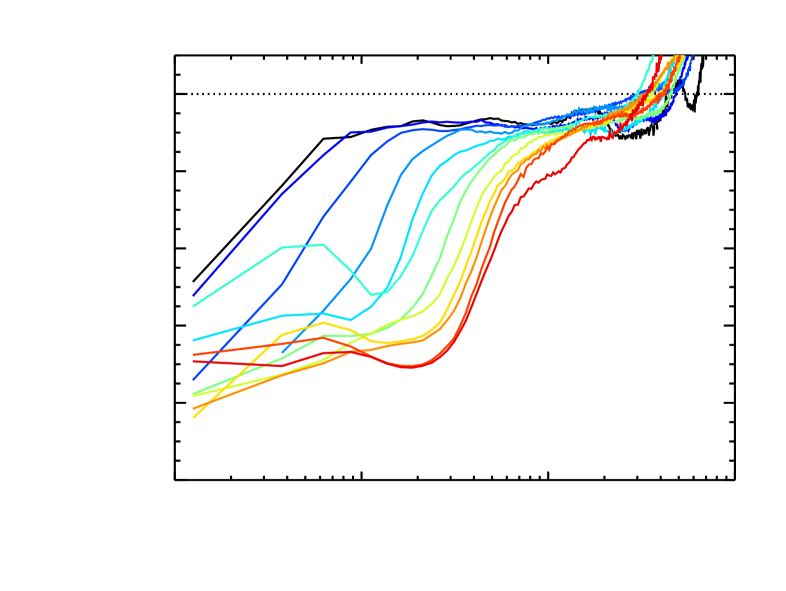
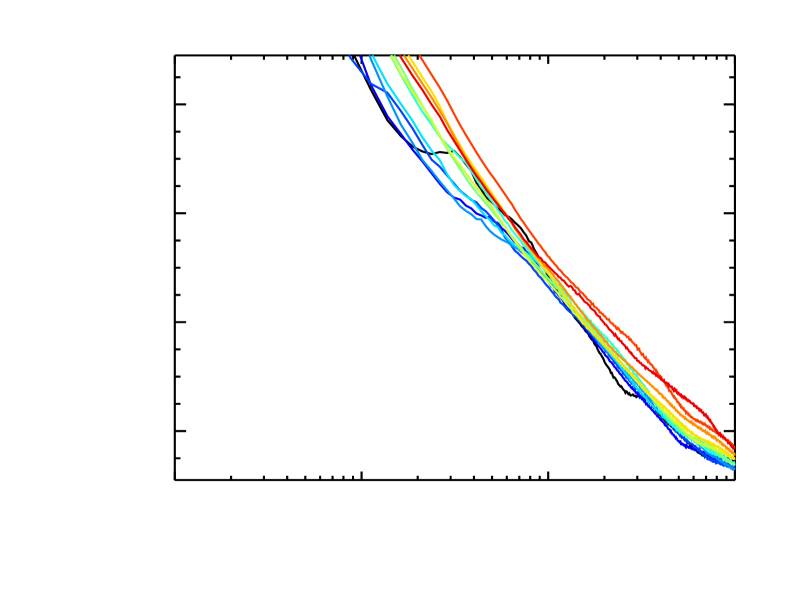
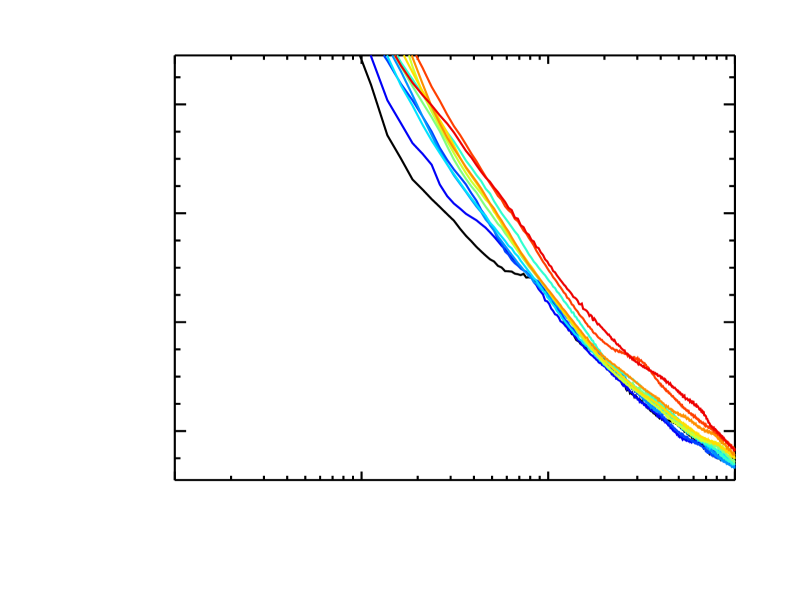
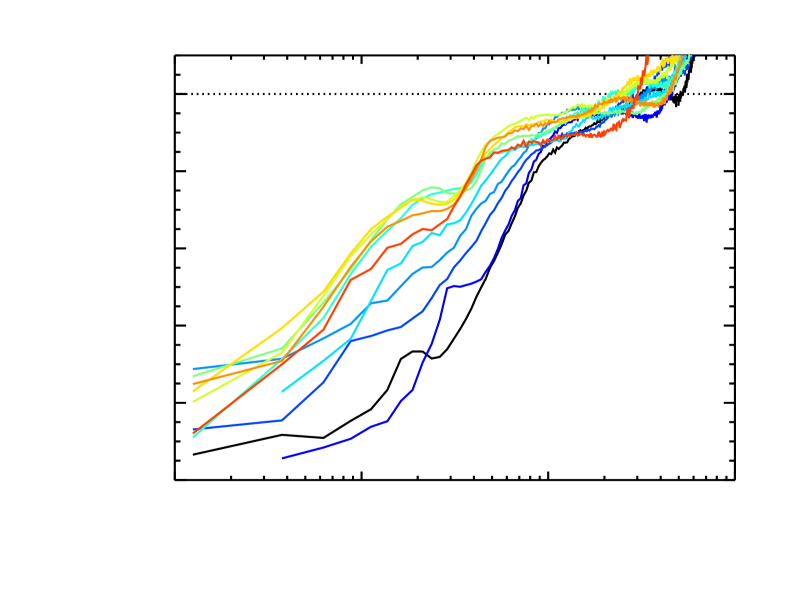
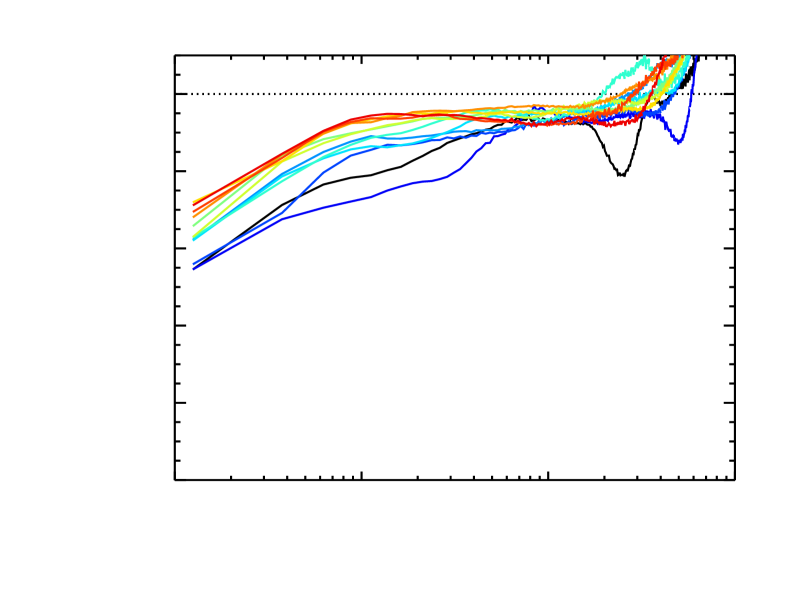
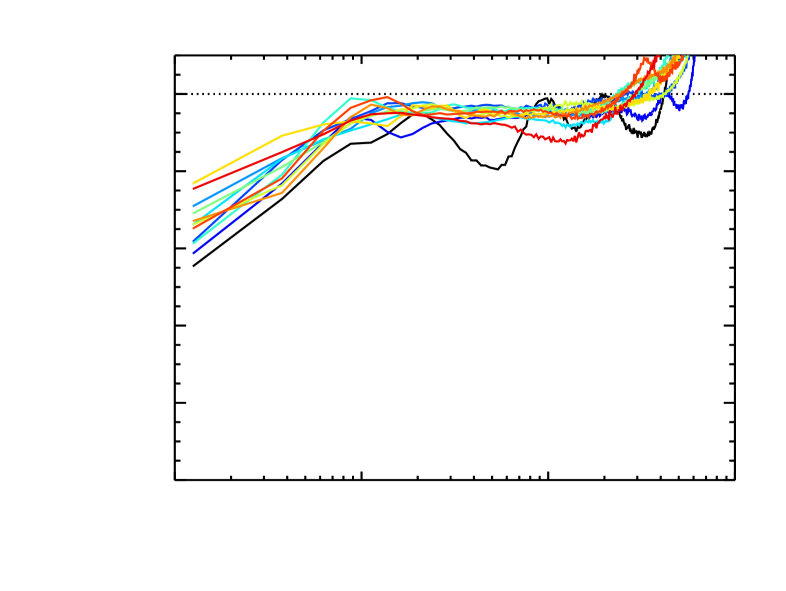
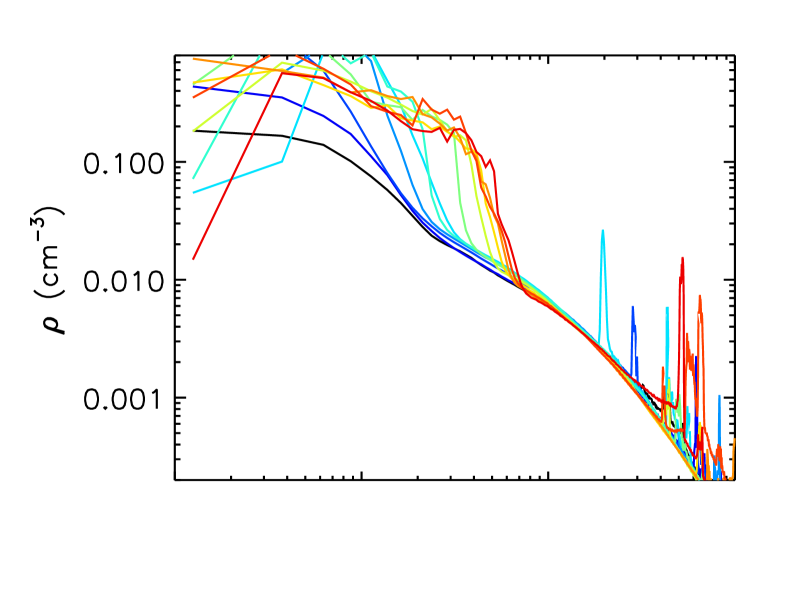
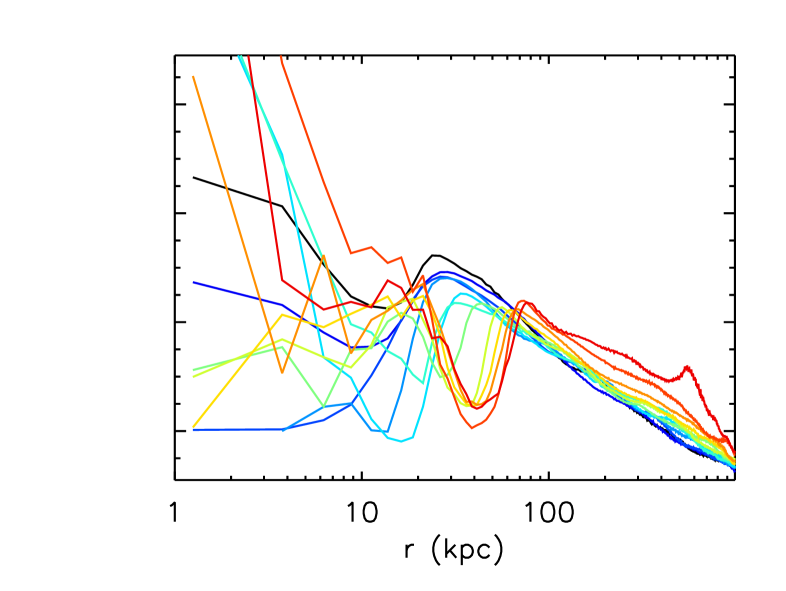
We follow the time evolution of the entropy profiles, as well as other thermodynamical properties of the ICM, for our simulations without metal cooling (figure 4) and with metal cooling (figure 9) in order to understand what drives the entropy profiles displayed in fig. 7. Each of the following sections systematically evaluates the consequences of including increasingly more physics into the simulations. First, in section 3.1, we map out the gas structure of the galaxy cluster at , and discuss how we separate the ISM of the central galaxy from the ICM gas. Section 3.2 presents results from the simplest case of cluster evolution under the influence of pure gravity and hydrodynamics (ADIArun). Section 3.3 considers the addition of atomic cooling, star formation, and UV reionization (NOAGNrun). Section 3.4 studies the cluster evolution with the additional complexity of AGN feedback, comparing effects of two different subgrid models: AGN jet feedback (AGNJETrun) and AGN feedback modeled as a thermal intput (AGNHEATrun). Section 3.5 assesses the role of pre-heating (AGNOFFrun), and finally section 3.6 examines how our results change with the inclusion of metal enrichment from supernovae (ZNOAGNrun, ZAGNJETrun, ZAGNHEATrun, ZAGNOFFrun).
3.1 Azimuthal structure and radial profiles
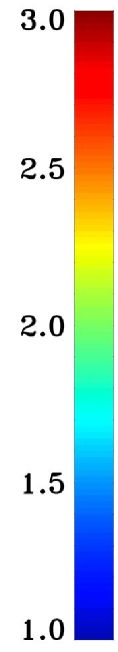
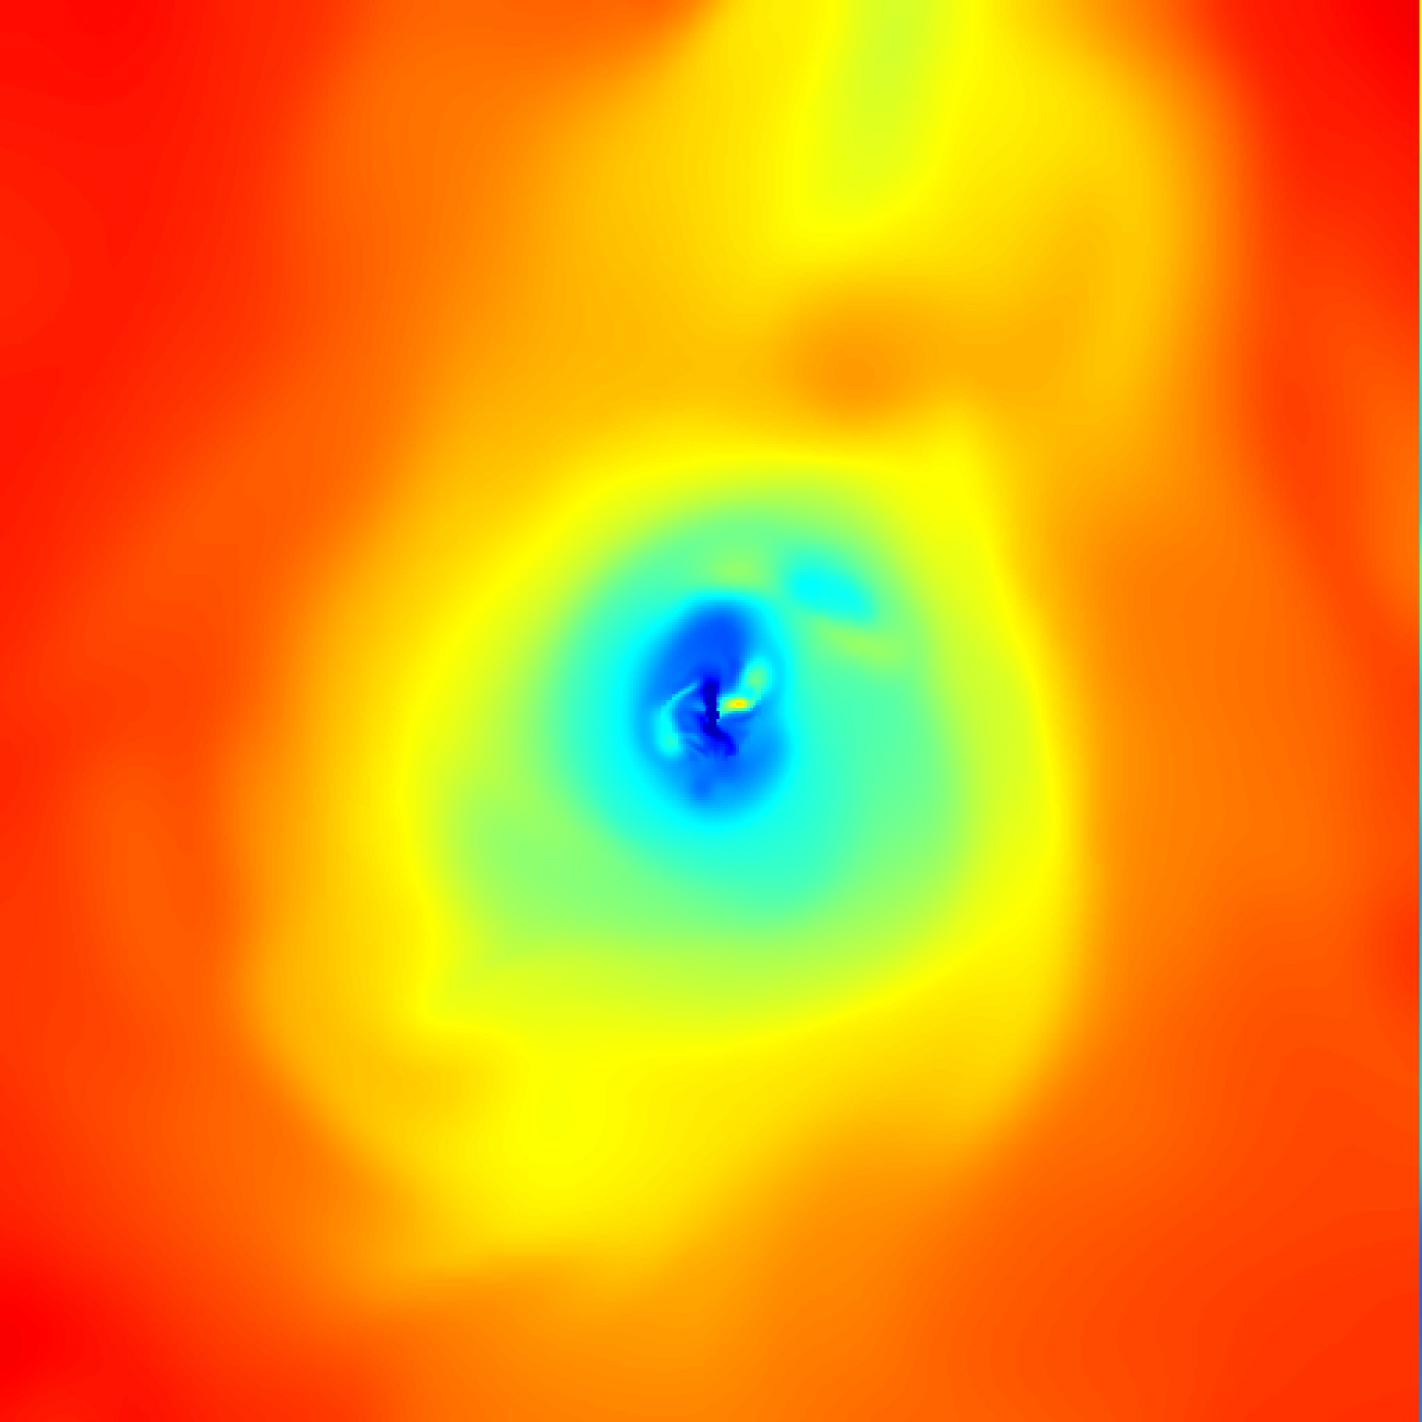
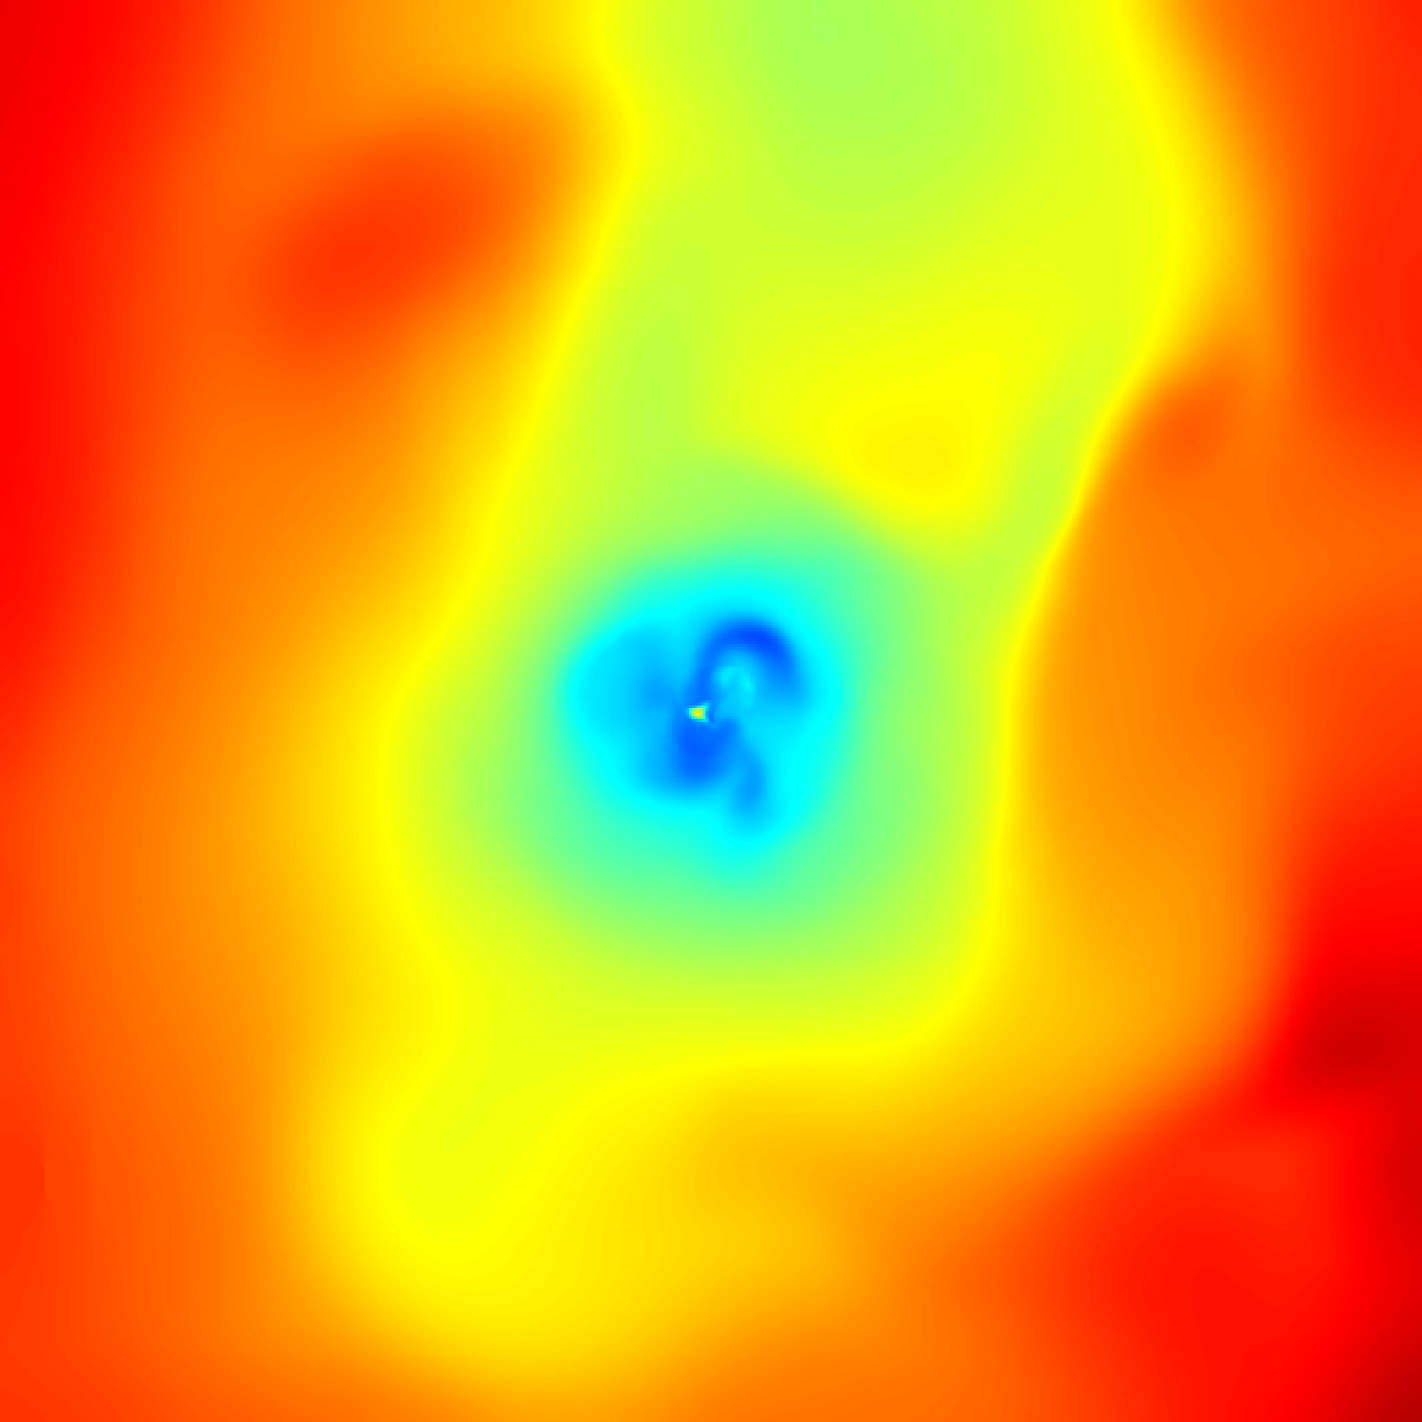
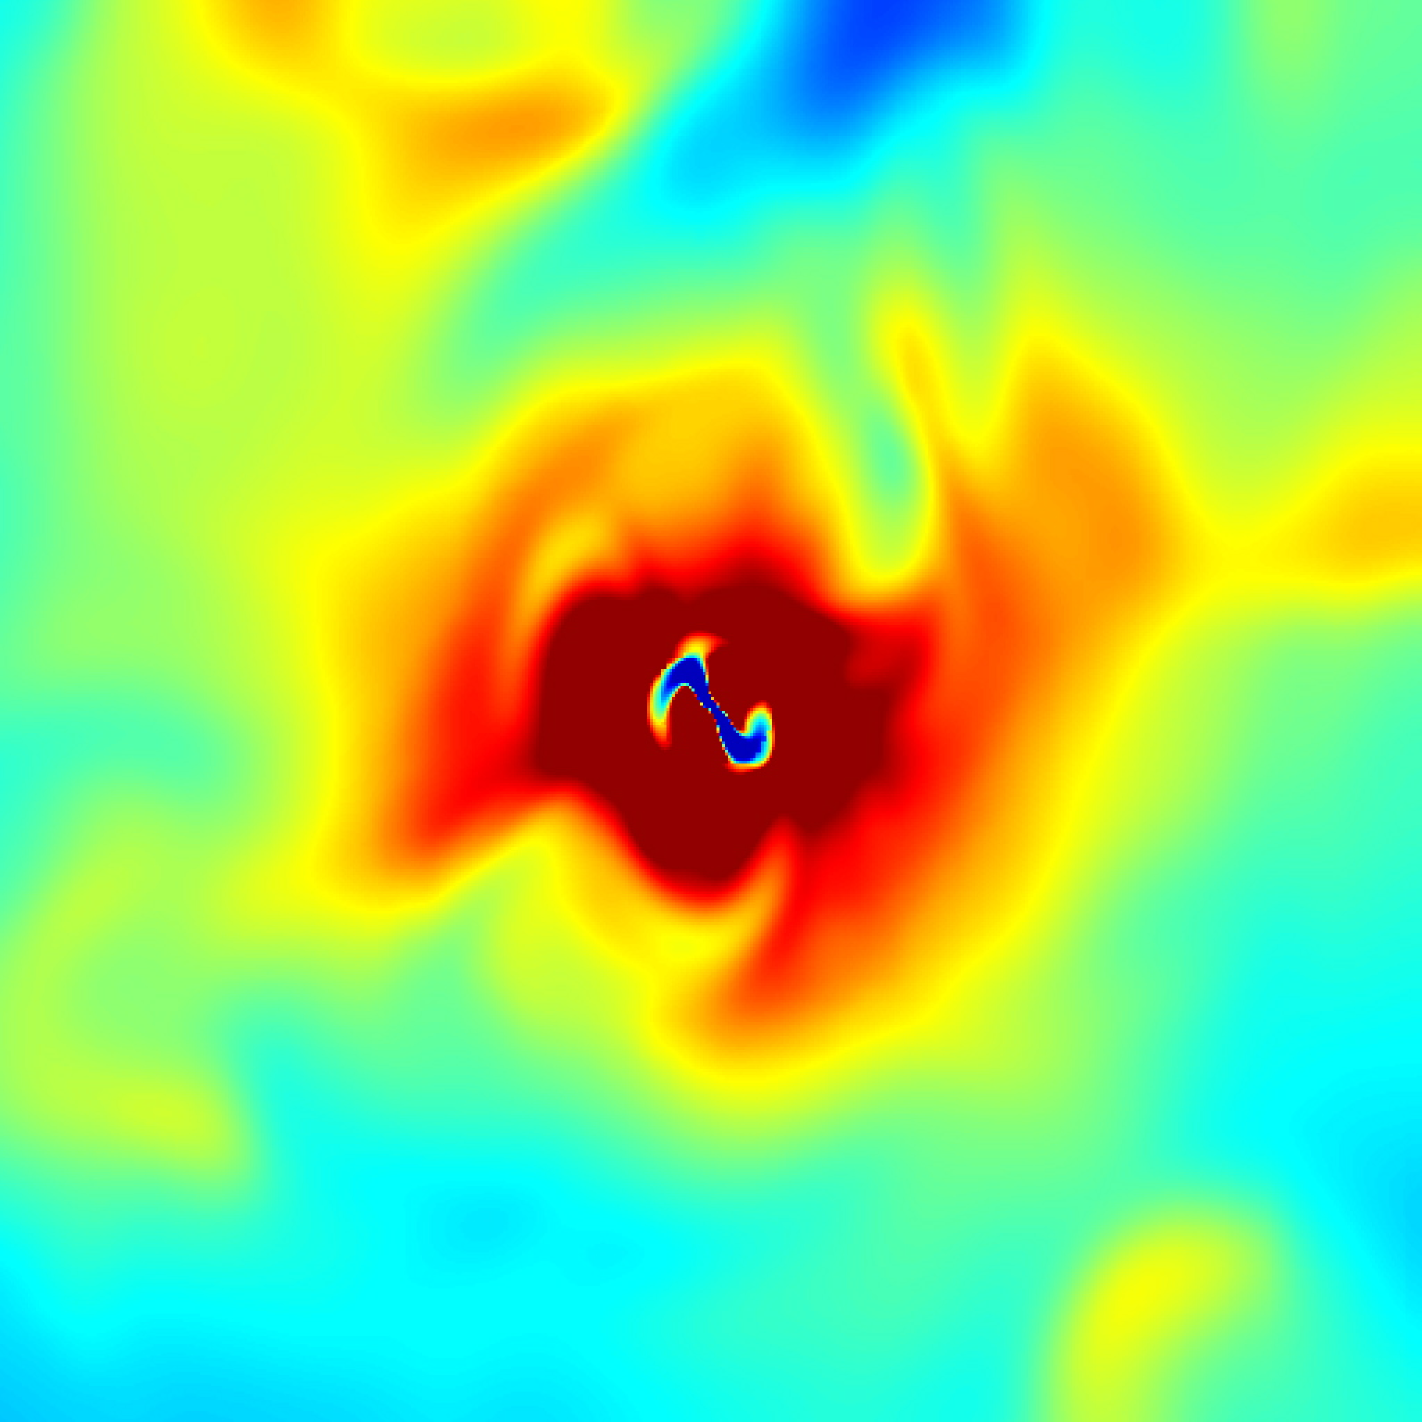
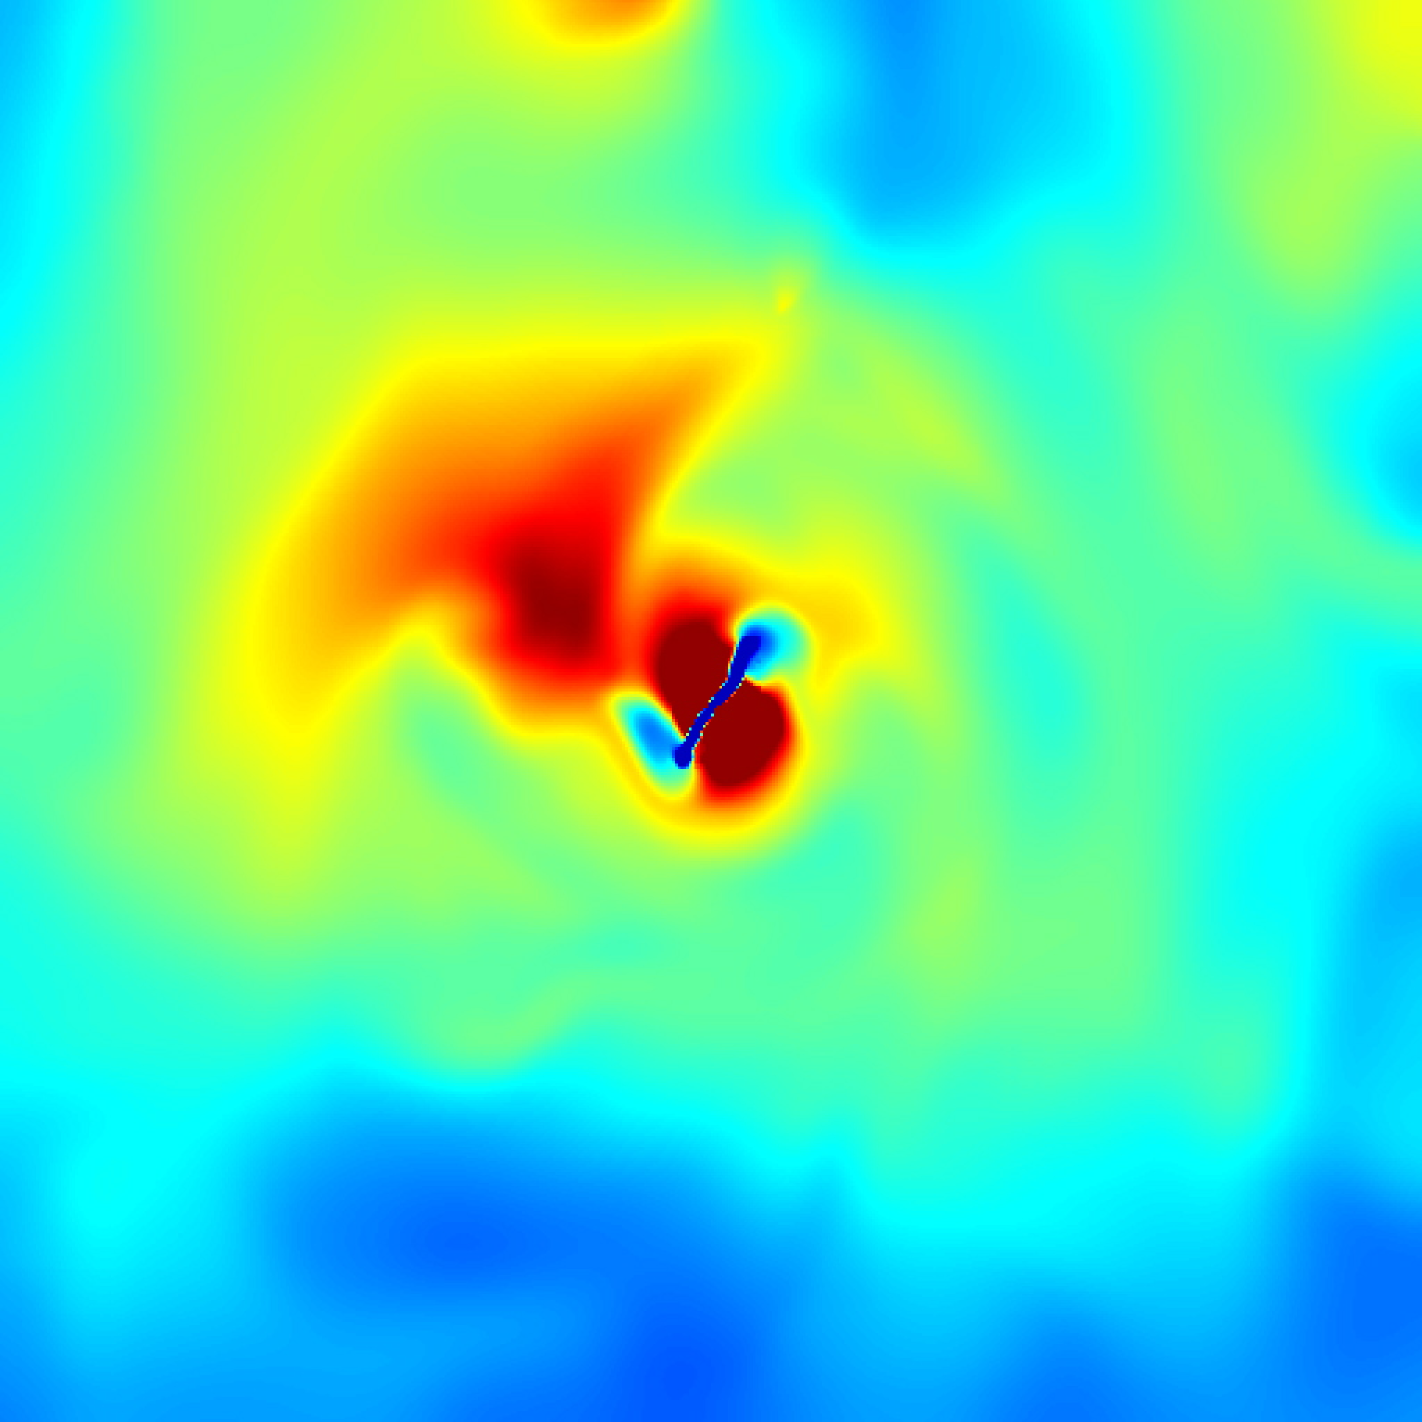
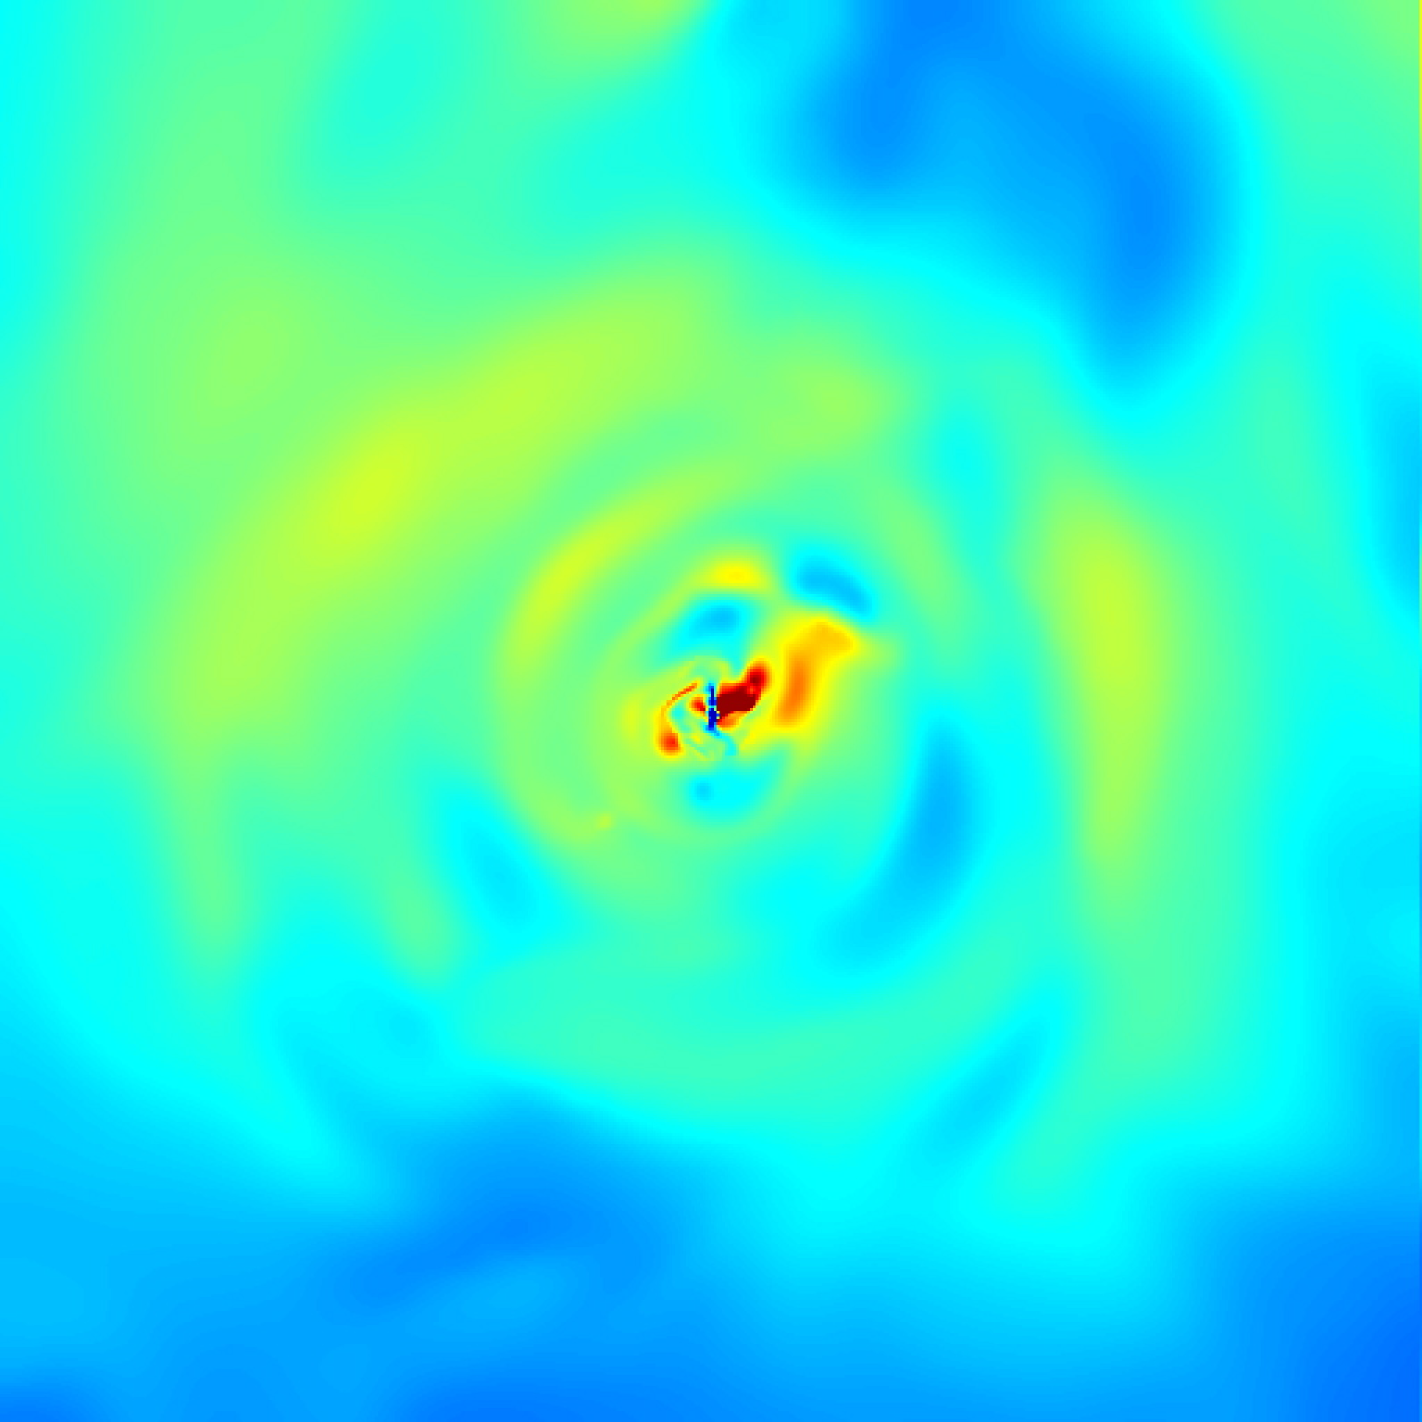
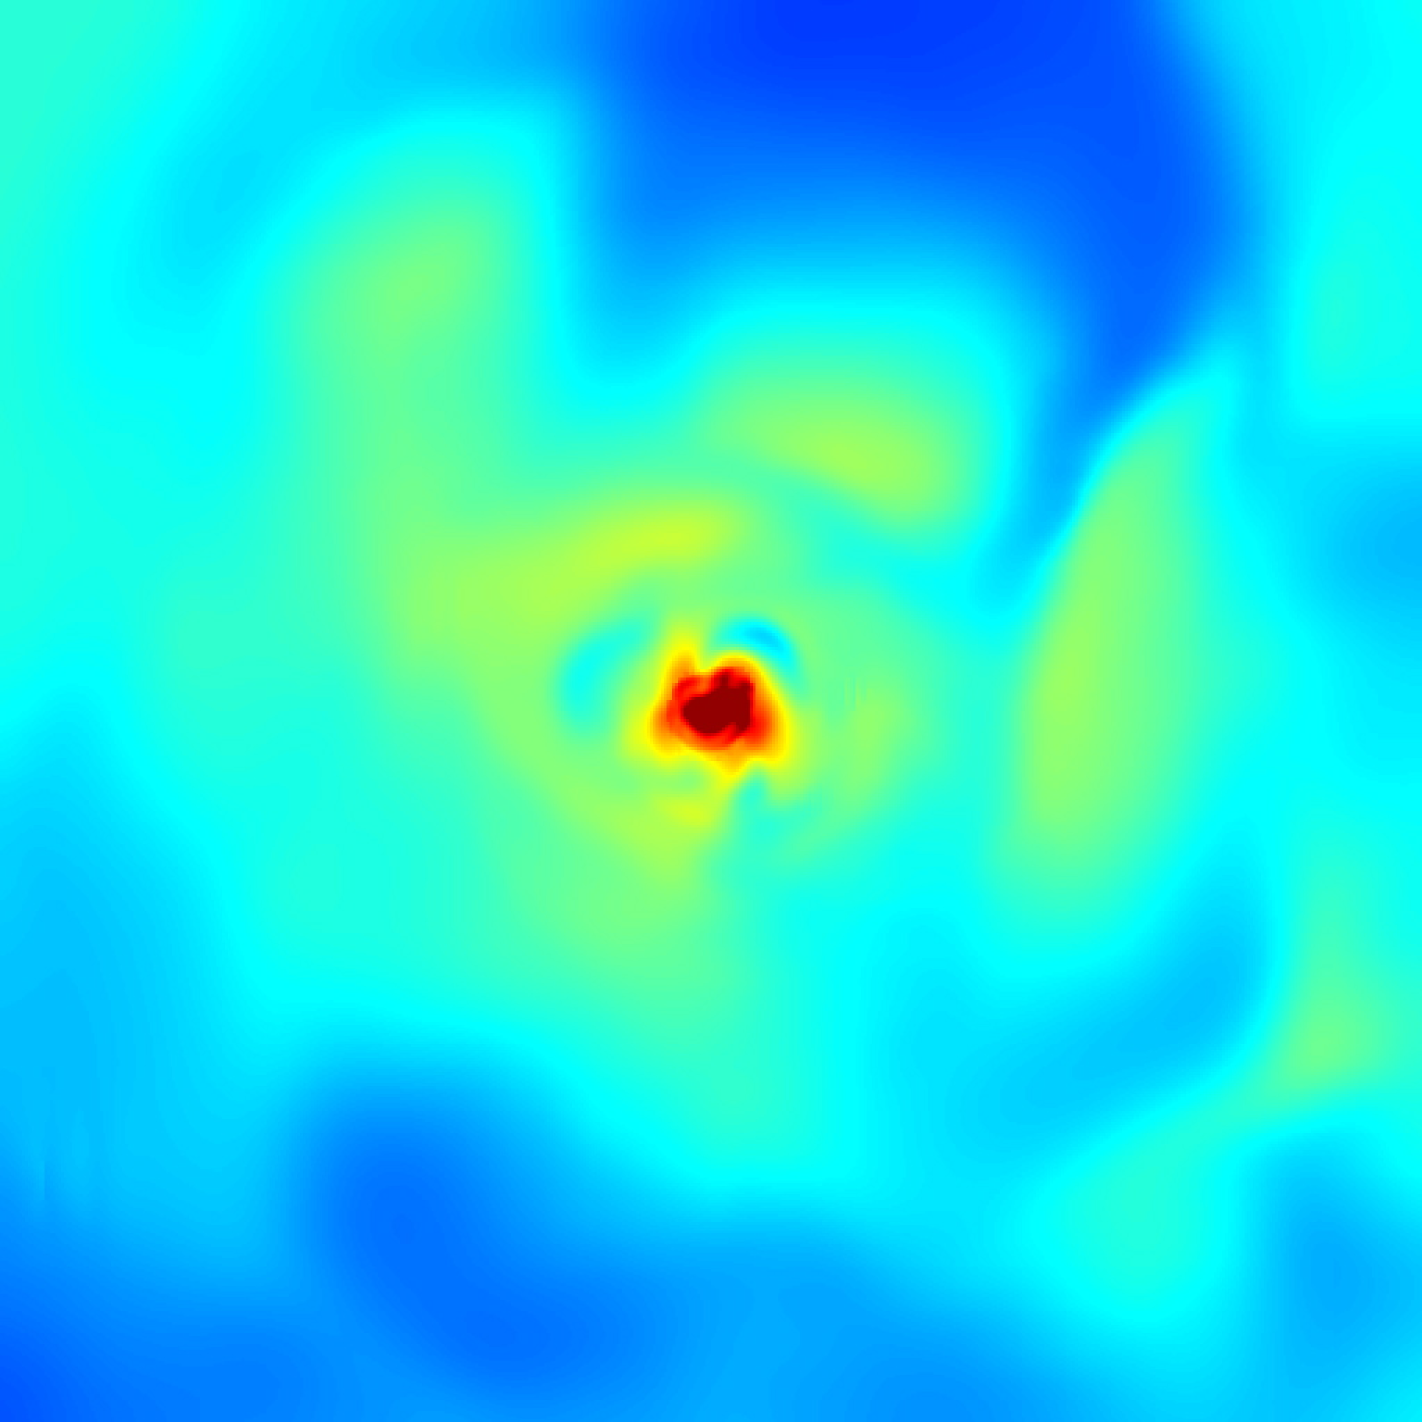
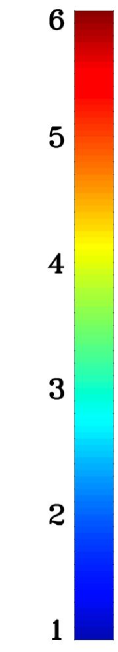
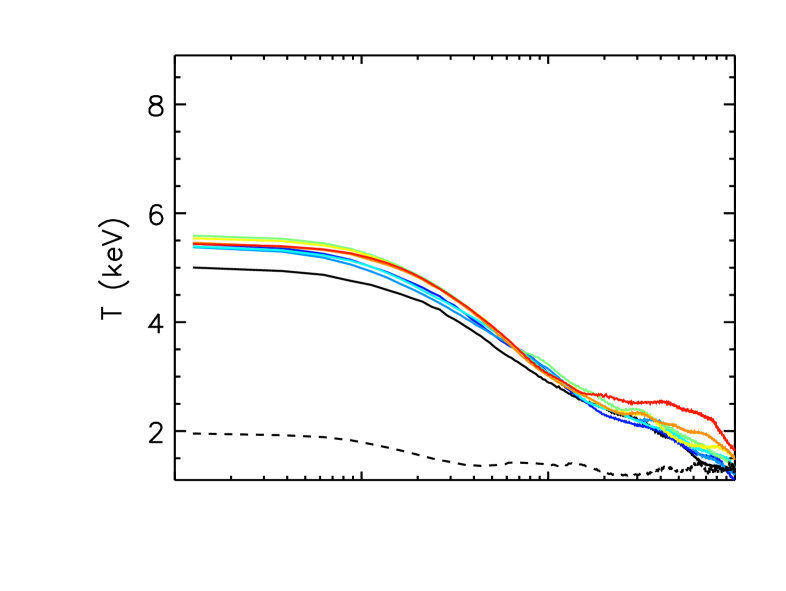
Fig. 2 shows a two-dimensional entropy cut through the centre of the cluster at for the four simulations which include primordial gas cooling (NOAGNrun, AGNOFFrun, AGNJETrun, AGNHEATrun). It appears that away from the galaxy disk interface, the entropy distribution is smooth but non-uniform. Lower entropy gas is preferentially located in the central regions. Due to radiative losses from atomic cooling, a large disc component appears in two cases (NOAGNrun and AGNOFFrun), signaling a cooling catastrophe (massive disc and high star-formation). This cold ISM component is also visible in fig. 3 with gas temperatures below 1 keV. In the simulations where AGN feedback proceeds down to (AGNJETrun and AGNHEATrun), the galactic disc is much smaller and the spatial extent of low entropy material is greater than in the cases where catastrophic cooling proceeds unimpeded (NOAGNrun and AGNOFFrun). The AGN jet in the AGNJETrun simulation manifests itself close to the disc by launching a bipolar outflow of high entropy and high temperature gas which sends sound waves out to large radii in the ICM (see Dubois et al., 2010).
Interestingly, the ICM in the NOAGNrun simulation has the highest level of entropy within the core, even though this is the simulation that does not include any feedback process at anytime. Compared to the other simulations, the central ICM also has a much larger temperature (fig. 3). The AGNOFFrun simulation shows similar characteristics: the ICM develops a high-entropy, high-temperature phase on both sides of the disc.
Fig. 4, and subsequent figures including 1-D radial gas profiles are obtained using volume-weighted angular-averaged profiles centered on the most massive galaxy at each time step of the simulation. The galaxies are identified using a halo finder (HaloMaker from Tweed et al., 2009 using the Most-Massive Sub-halo Method) on star particles or on DM particles when no stars are present.
To fairly compare gas properties from simulations to observations (mostly from X-ray emission), one should use X-ray-weighted profiles instead of volume-weighted profiles. But the dense disc component in some simulations (AGNJETrun and AGNOFFrun) pollutes the profiles even when cold cells ( keV) are removed. For this reason, we choose to only use volume-weighted profiles and remove gas cells with temperature smaller than 1 keV. We discuss the consequences of this choice in more detail in Appendix A.


3.2 The effect of gas dynamics
The ADIArun simulation does not include any type of radiative cooling, star formation, or external heating process (i.e. no stellar or AGN feedback, and no UV background to model reionization), and thus serves as a reference for the more complex simulations. It tests the hydrodynamical evolution of the cluster under gravity.
Entropy profiles in fig. 4 (first column, first row) show the well-known features of any adiabatic simulation performed with Godunov-type solvers: a self-similar power-law profile at large radii with a flat core component. The dotted line on the entropy plot corresponds to the power-law inferred at large radii from both SPH and AMR simulations of galaxy clusters by Voit et al. (2005). The high entropy material following a power-law distribution is believed to originate from a large-scale expanding shock at a few ( 2-3) virial radii while the flat core component develops from the lower entropy material, produced by small-scale turbulence and weak shocks in the depths of the gravitational potential well (Tozzi & Norman, 2001). Our results for the entropy profile in ADIArun are in very good agreement with the numerical study performed by Mitchell et al. (2009). As pointed out by these authors, rather than producing a flat entropy core, adiabatic cluster simulations with standard SPH codes produce near power-law profiles down to the resolution limit (smoothing-length) due to their inability to capture Kelvin-Helmoltz instabilities (Agertz et al., 2007).
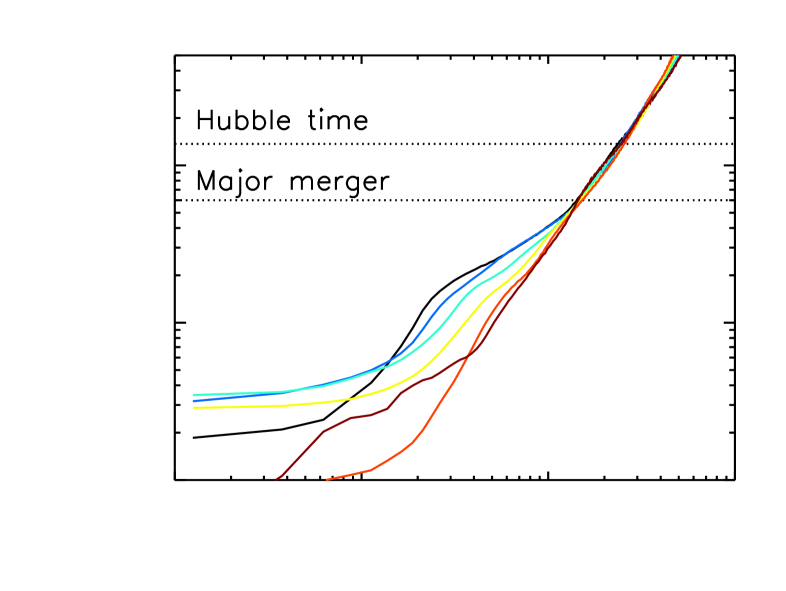
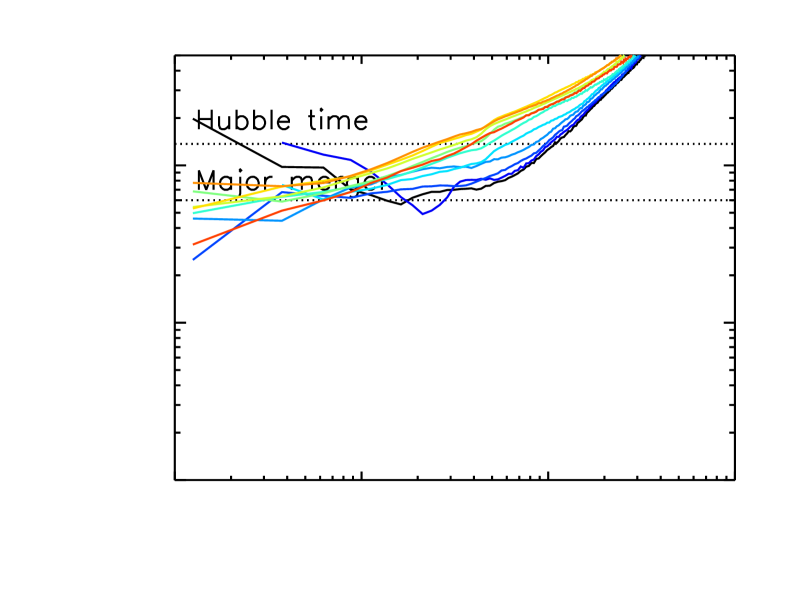
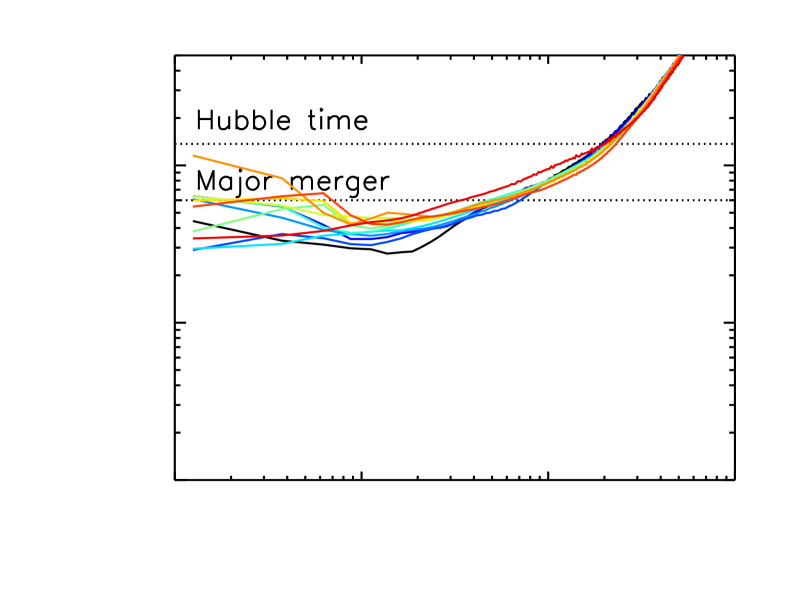
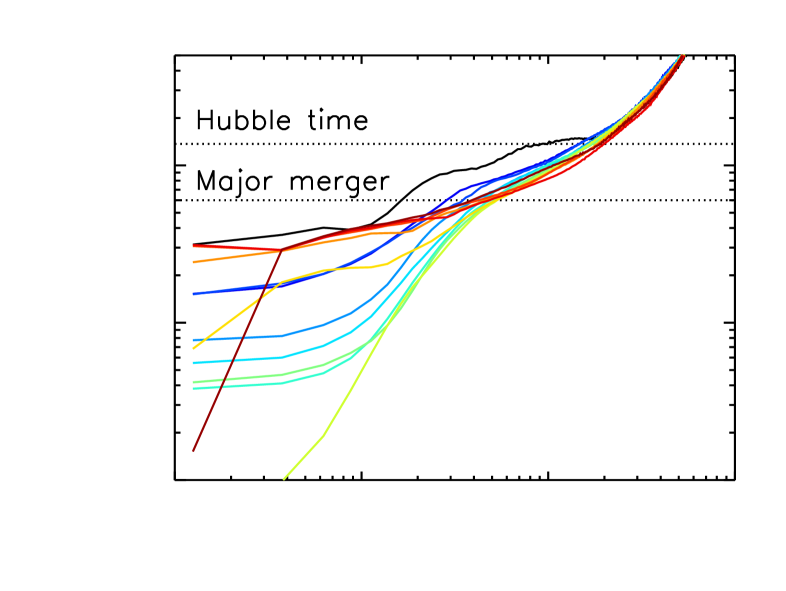
The entropy profiles in the late time evolution spanning 6 Gyrs from to for ADIArun vary only by due to minor mergers and gas turbulence. Indeed, the amount of entropy in the adiabatic simulation of this cluster is mainly determined by the major merger event lasting from to which doubles the entropy level of the pre-merger phase. Meanwhile, the gas temperature increases as kinetic energy from the merger encounter is thermalised by shocks. The heating from this major merger could potentially prevent the formation of a massive cooling flow (ZuHone et al., 2010). However, even though radiative losses are not considered in the ADIArun, we can compute the theoretical cooling time based on primordial atomic rates (fig. 4, first column, fourth row). This cooling time increases from 400 Myr in the pre-merger phase at to 700 Myr at the end of the merger . Thus the major merger would only slightly delay the occurrence of a cooling catastrophe. The fact that the cooling time is still very small ( Gyr) after the major merger in comparison to the Gyr or so which remain to reach , means that several major mergers of this type would be required to balance the gas radiative losses. In the following sub-sections, we will see that this “sloshing” mechanism is not enough to prevent the cooling catastrophe.
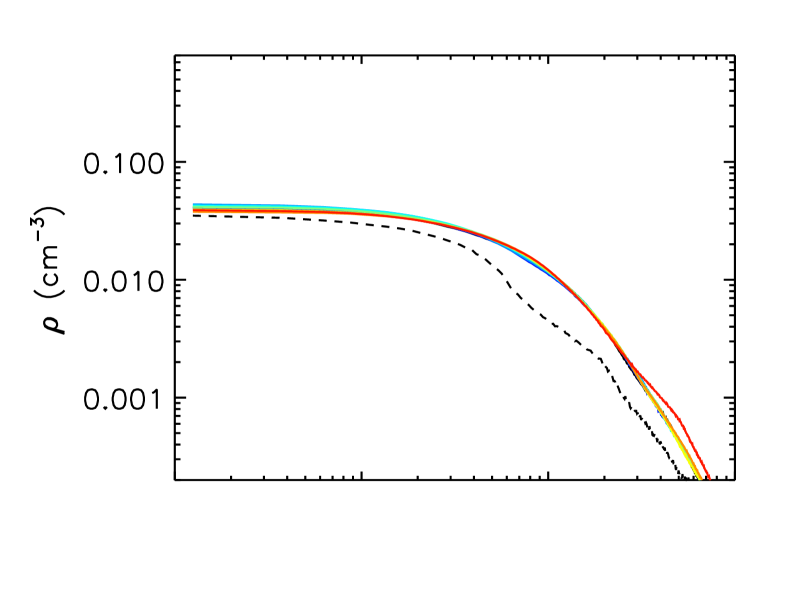
Like the entropy profiles, density profiles in the ADIArun (fig. 4, first column, second row) vary very little with time. Gas concentrates in a flat core with low density (). In fact, the maximum density reached in the cluster core is lower than the gas density threshold for star formation (). Thus to trigger and maintain star formation, the simulation needs to include a mechanism, like radiative cooling, which allows gas to efficiently concentrate in the gravitational potential well (see section 3.3).
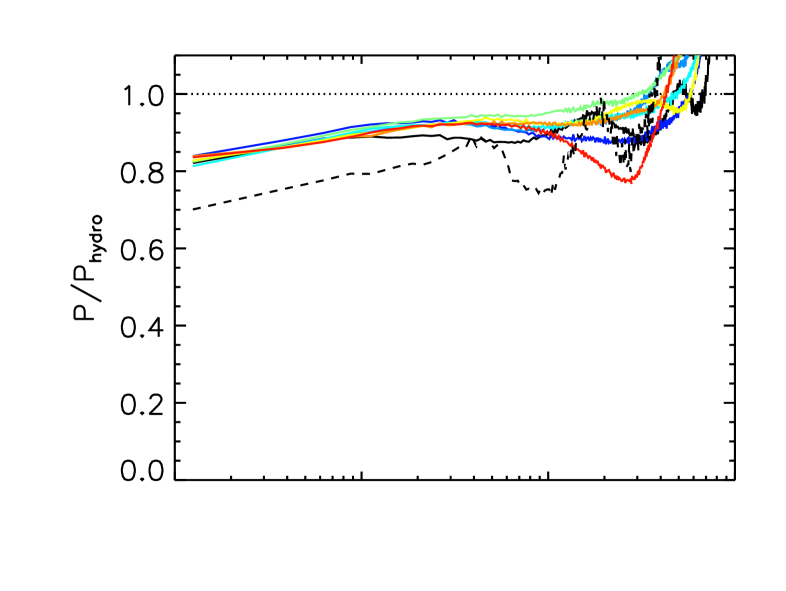
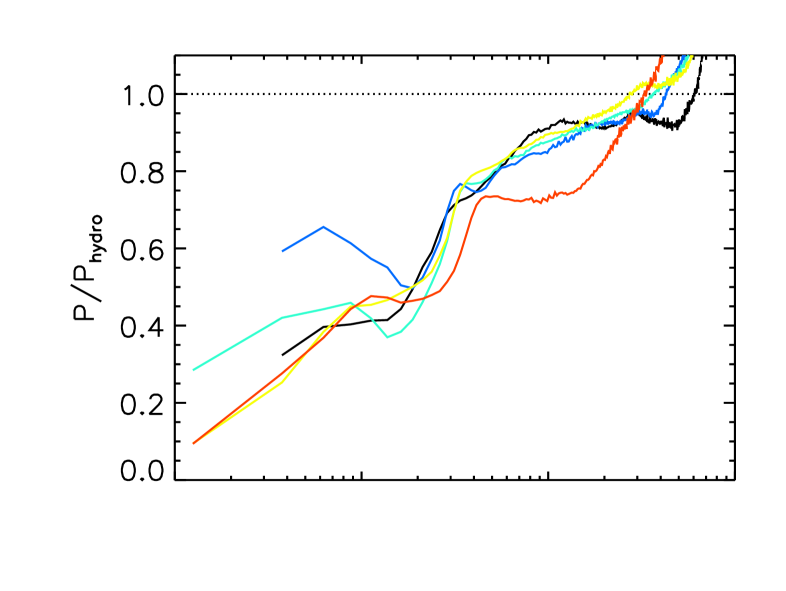
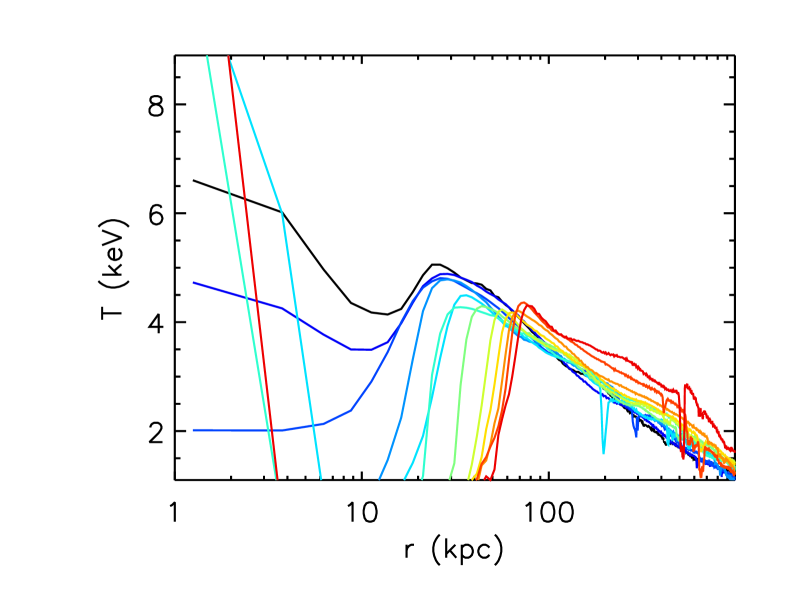
The temperature profiles observed in fig. 4 (first column, third row) are consistent with gas in hydrostatic equilibrium and are therefore the direct consequence of the gas and total mass distribution in the cluster (see Hansen et al., 2011). For gas in pure hydrostatic equilibrium, the pressure obeys:
| (4) |
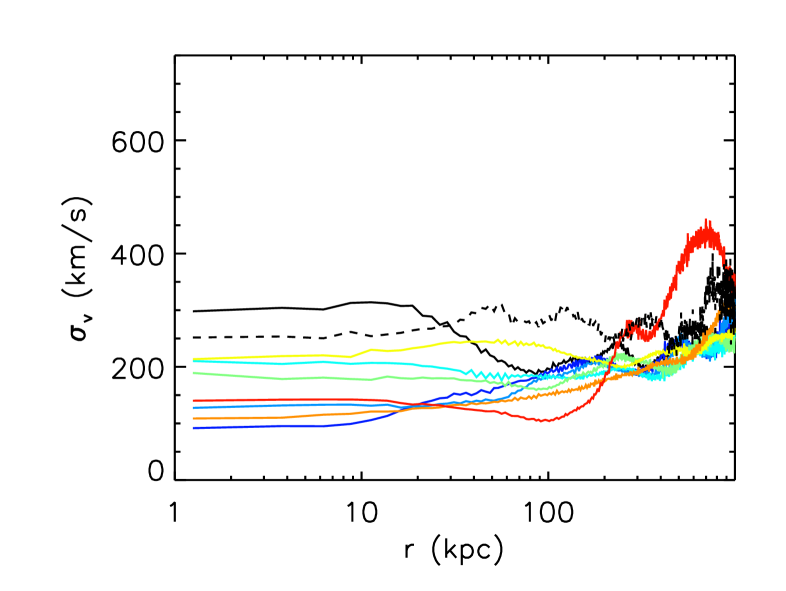
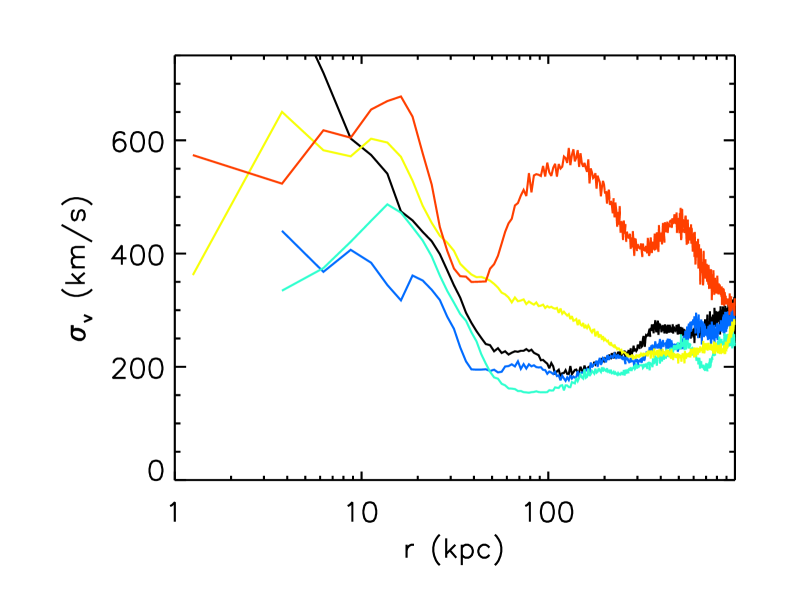
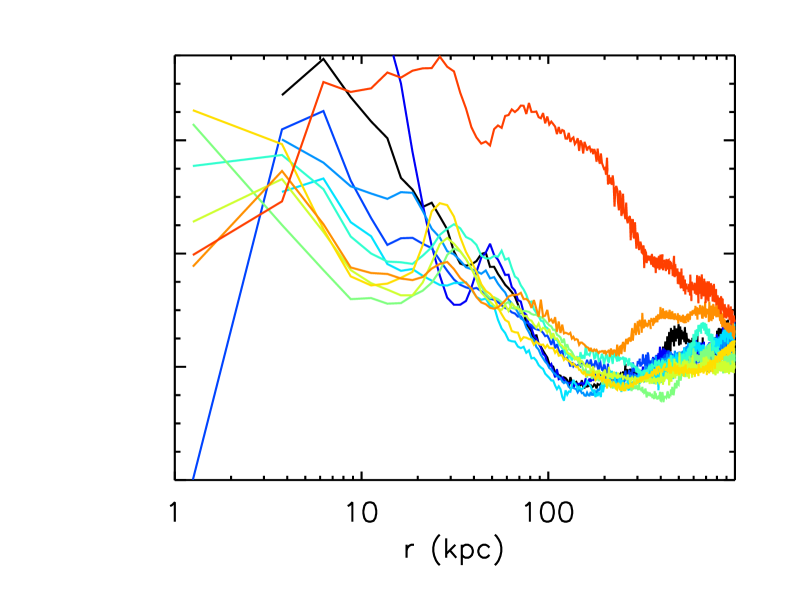
where is the gas density, the gravitational constant, the spherical radius, and the total mass (gas, stars, DM and BHs) within . Fig. 4 (first column, fifth row) shows that the gas pressure is 90 of the hydrostatic pressure. Some additional support for the cluster gas may be provided by the global rotation of the cluster and its internal turbulence (Dolag et al., 2005; Nagai et al., 2007). To assess contributions from the latter, we measure the gas velocity dispersion (fig. 4, first column, sixth row) in the inner parts of the cluster. It is 100200 km/s, which is 510 of the sound speed in the relaxed (post major merger) phase and reaches 15% of the sound speed after the merger (at ), in good agreement with recent simulations from Vazza et al. (2010). These values are extremely close to what is needed to make up for the lack of internal energy support inferred from the pressure profiles.
We do not plot the radial velocity profiles for any of the simulations, as pressure profiles describe the dynamical state of the gas. However we comment that for the ADIArun, the radial velocity is negligible as it represents less than of the sound speed in the cluster core. This demonstrates that, in the absence of any radiative cooling process, the gas is in (almost) perfect equilibrium in the core and is unable to concentrate in a dense galactic disc.
3.3 The effect of atomic gas cooling
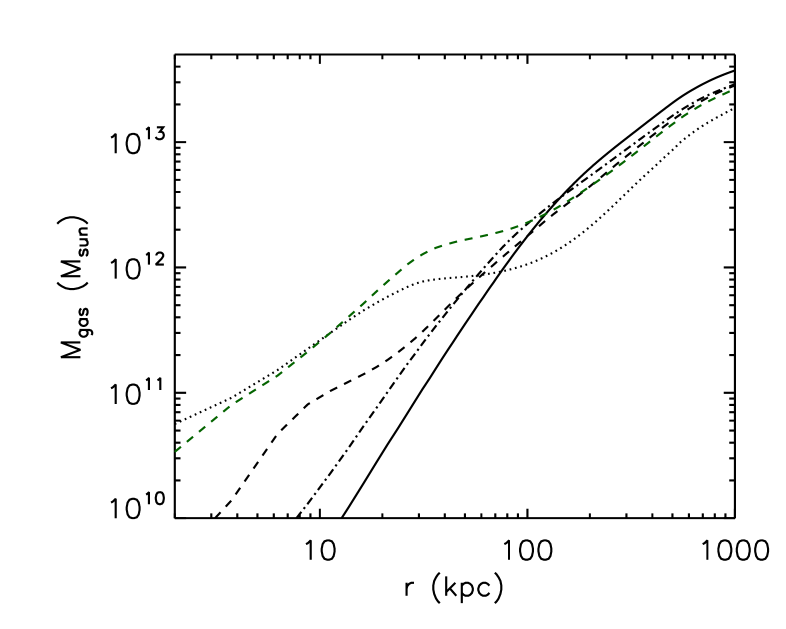
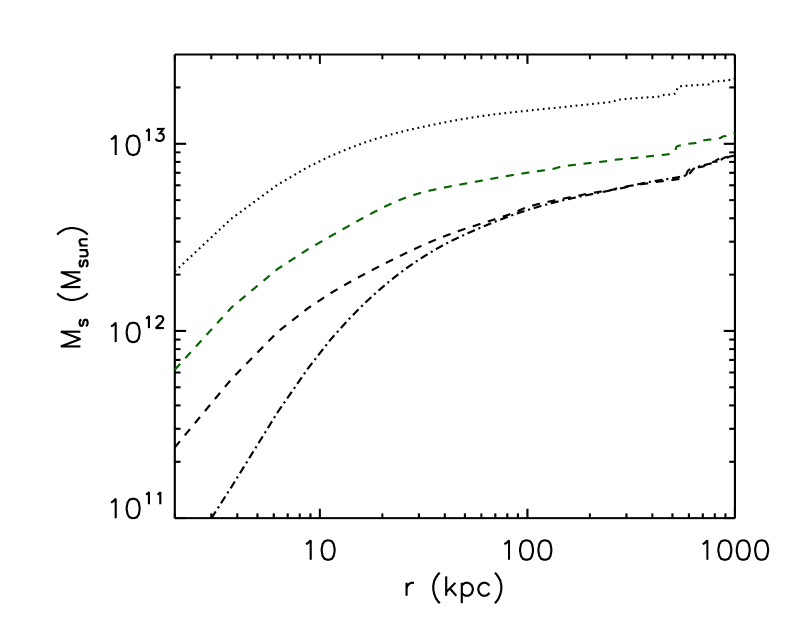
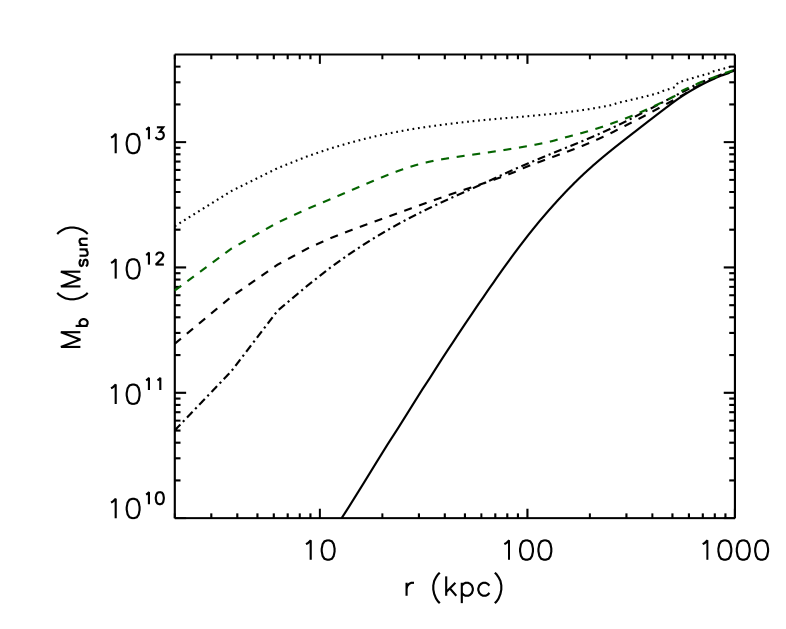
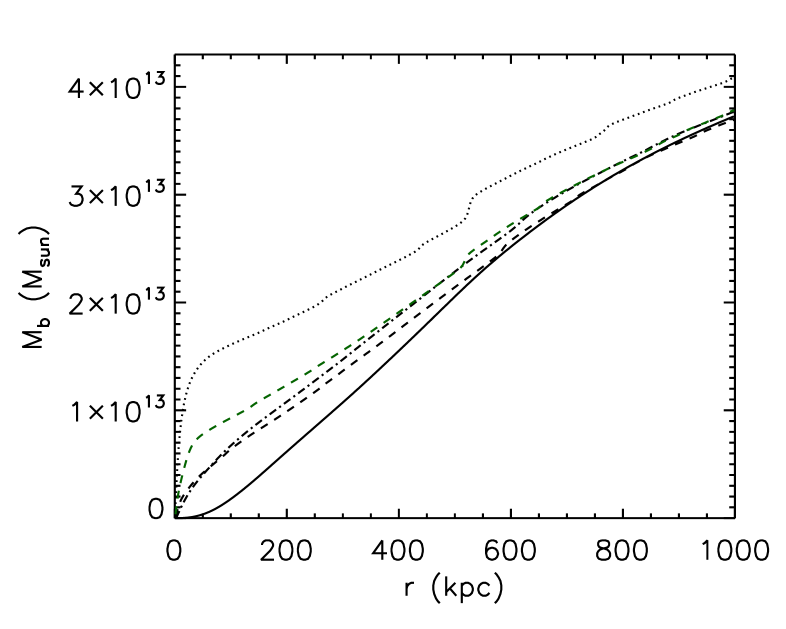
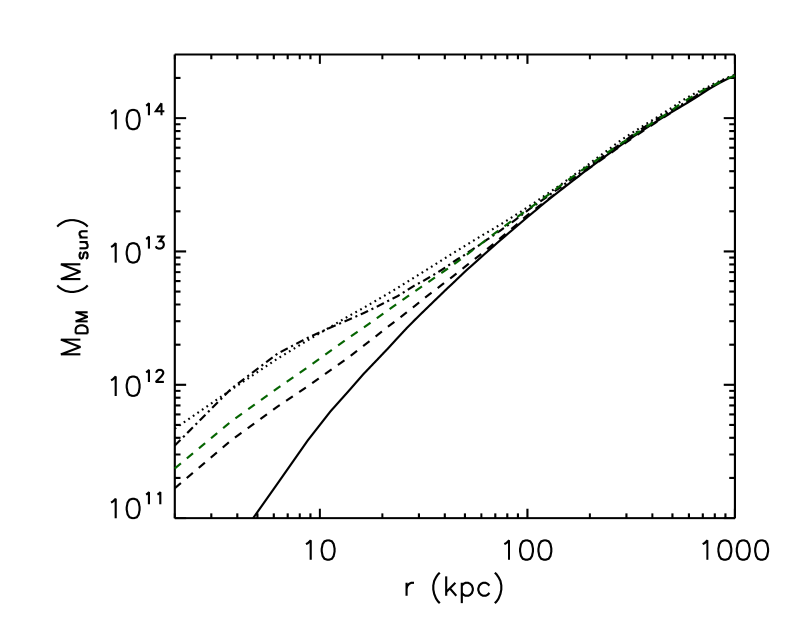
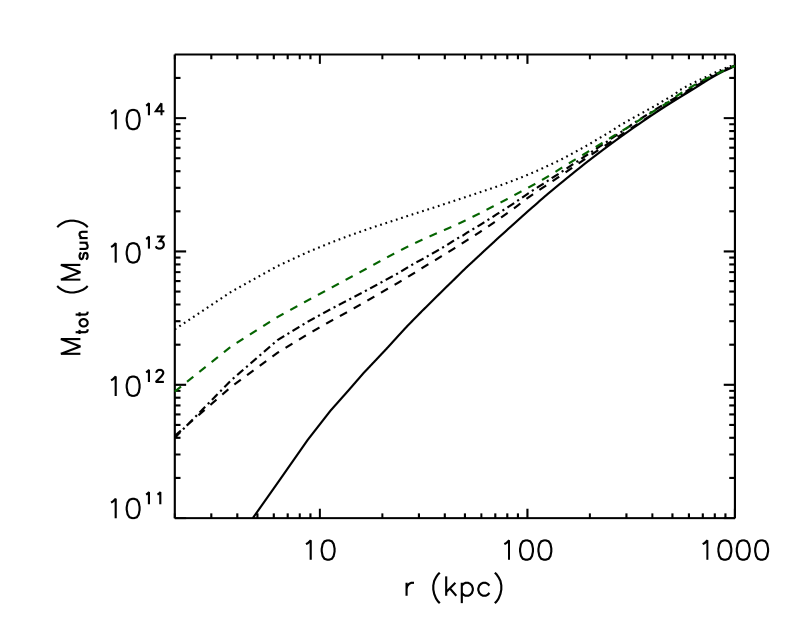
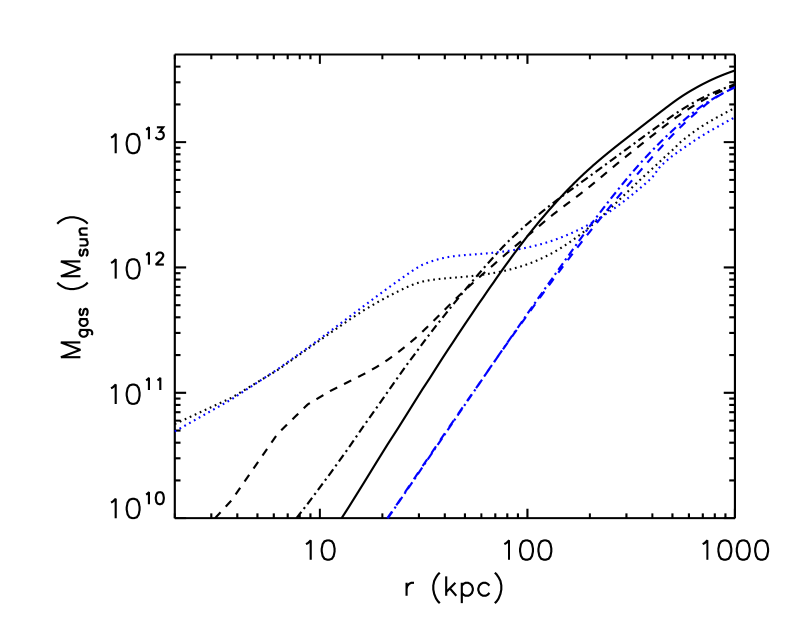
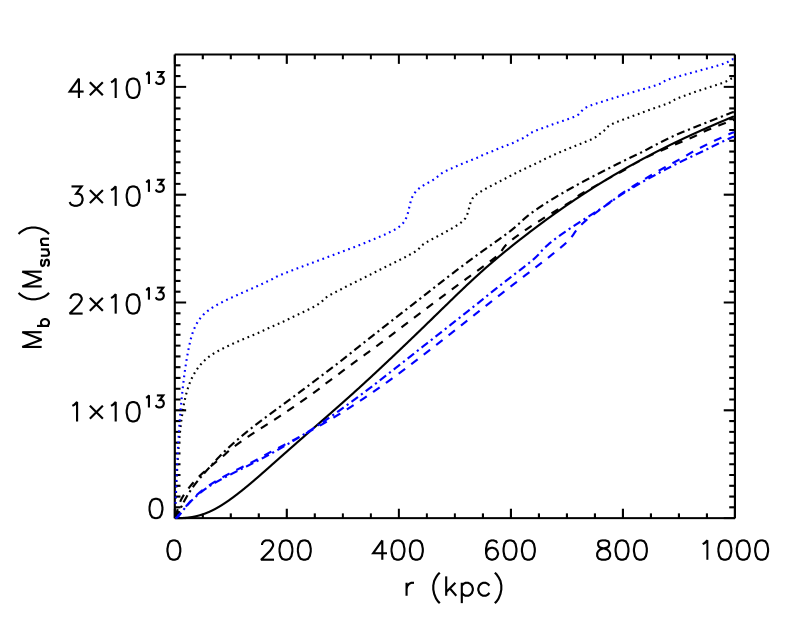
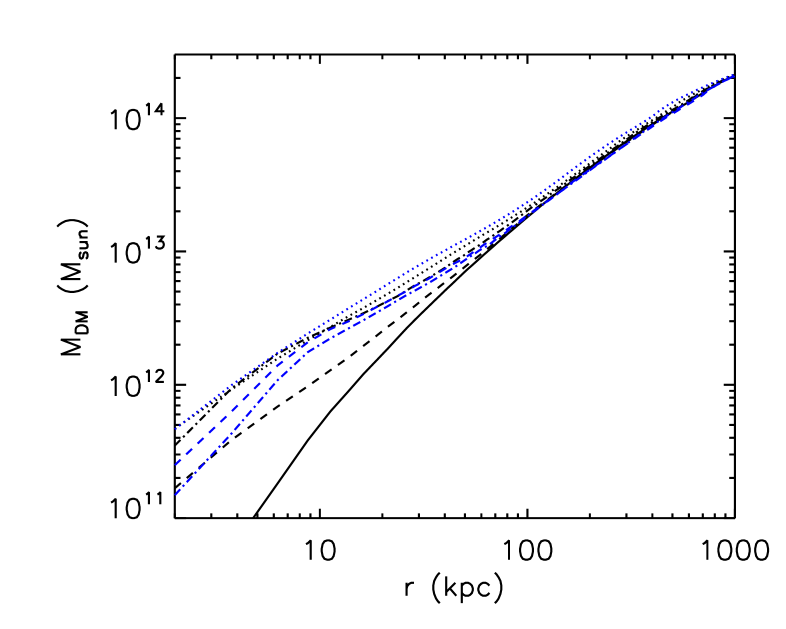
When atomic cooling and star formation are allowed (NOAGNrun), gas can cool down to very low temperatures ( K) compared to typical ICM temperatures ( K). Cold gas condenses in the centres of gravitational potential wells to form galactic discs. In turn, the gravitational potential deepens, pulling more and more DM into the centre. This well-known mechanism called ’adiabatic contraction‘ is described in detail in Blumenthal et al. (1986) (see also Gnedin et al., 2004). Displaying integrated mass profiles for the gas, stars, baryons and DM, Fig. 5 illustrates this effect: as more baryons concentrate in the core of the cluster, more DM particles are pulled in, forming a stronger DM core component.
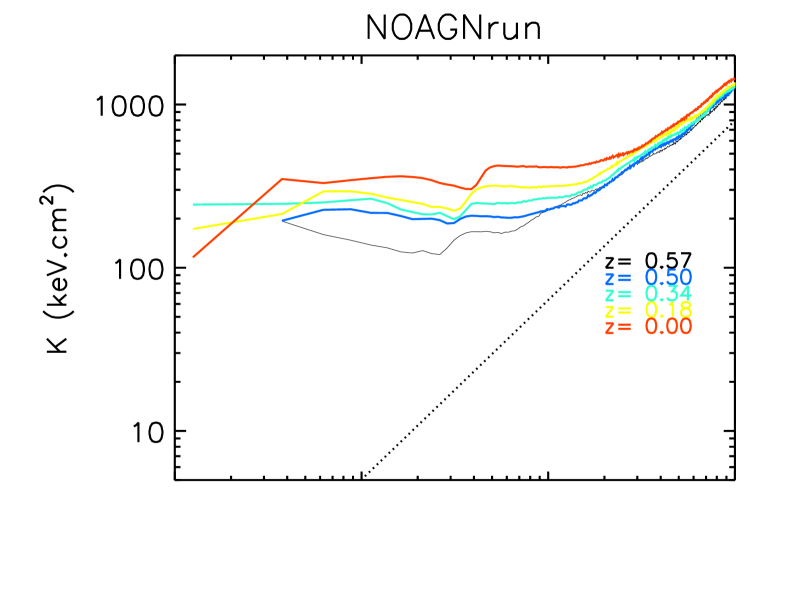
Fig. 4 (second column, first row) shows that at all times, the entropy in the core of the NOAGNrun is one order of magnitude higher than the entropy in the core of the ADIArun. Furthermore, the entropy in the NOAGNrun continuously increases with time in the cluster, both inside and outside the core. This entropy rise has been interpreted as arising from the removal of low entropy gas as it cools and turns into stars (note that the cooling time of the ICM is shorter than 6 Gyr, the time span between and ) and its replacement with high-entropy material coming from the outer parts of the cluster (Bryan, 2000; Voit & Bryan, 2001). Because of the Eulerian nature of grid codes, we cannot directly follow the history of gas elements in our simulations. However using the Lagrangian SPH technique, or tracer particles within grid codes, McCarthy et al. (2011) and Vazza (2011) have validated the above picture by showing that when low-entropy material condenses into the central disc, high-entropy material flows into the central parts of the halos replacing the depleted low-entropy gas.
Support for the above picture also comes from the gas density profiles (fig. 4, second row of second column) and the cumulative mass profiles (fig. 5). The gas density in the NOAGNrun strongly diminishes with time in the ICM (fig. 4, second column, second row) as cold gas gets incorporated into the galaxy. The small feature observed between - kpc in the gas density and gas entropy profiles is characteristic of the flaring tail of the disc, which is dense, warm and low entropy, and thus difficult to separate from the ‘true’ ICM. Indeed, in Fig. 5 we plot the gas mass profile (dotted line) for all the gas (ICM and gas in the galaxy) in the cluster. Since we include the galaxy’s gas, the cumulative gas mass profile for the NOAGNrun (dotted line) shows a strong contribution from the centre of the cluster. The outer regions ( kpc) in the cumulative gas mass profile are depleted of gas corroborating the picture that gas from the outer regions moves inward, cools, gets incorporated into the galaxy component and forms stars. Note that the total baryon mass at Mpc is hardly affected (on the level of 10 %) by atomic gas cooling. Since the cooling time in these regions is larger than a Hubble time, the accretion of material on large scales is mainly driven by cosmological accretion, and not by radiative processes.
More evidence for the above picture comes from pressure profiles (fig 4, second column, fifth row) They reveal that the gas in the NOAGNrun is far from hydrostatic equilibrium within kpc resulting in a massive cooling flow ( km/s) towards the centre of the cluster. Since low-entropy material cools faster than high entropy material (fig. 4, second column, fourth row), it continuously flows onto the galaxy and is converted into stars. This removes pressure support at small radii, causing high-entropy gas at large radii to smoothly flow towards the centre as it is sucked into the cluster core. This explains the difference in the cumulative baryon mass seen at (table 1 and first panel in second row of fig. 5) for the NOAGNrun (black dotted) compared to the ADIArun (black solid line).
Thus, we conclude that even though gas loses internal energy by radiative losses, the net effect of cooling is to replace low-entropy gas depleted onto the galaxy by high-entropy gas from large radii, and to fill the ICM with gas at higher temperature (see fig. 4, third column, second row). The rise in total mass (dotted curve in plot of fig. 5) of the cluster core drives a gas internal energy increase to counterbalance the extra gravity. Consequently, the massive reservoir of internal energy at large radii supplies the cluster core with what is missing to support its own collapse: gas at higher entropy and higher temperature.
The presence of this strong cooling flow is also characterized by a vigorous, turbulent radial velocity dispersion (fig. 4, second column, sixth row), but this cannot explain the increase in temperature as the radial velocity dispersion remains very low compared to the gas sound speed (). In a nutshell, we see all the features of a cooling catastrophe in the NOAGNrun: gas density is irreversibly depleted in the ICM, which leads to an unrealistic amount of gas flowing towards the central galaxy, and larger values of entropy and temperature in the cluster (see also Nagai et al., 2007).
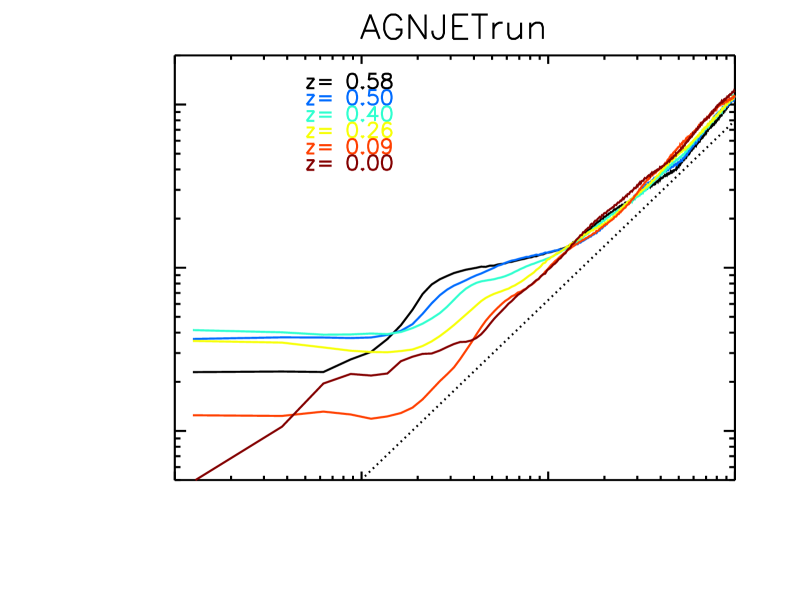
3.4 The effect of AGN feedback
As was shown in Dubois et al. (2010), jet-induced AGN feedback solves many problems associated with the cooling catastrophe: galaxies are less massive, they form less stars especially at late-times, and the cooling-flow is moderate and self-regulated. In an effort to understand how this works and what leads to the entropy profile presented in Dubois et al. (2010), we re-examine the AGNJETrun simulation.
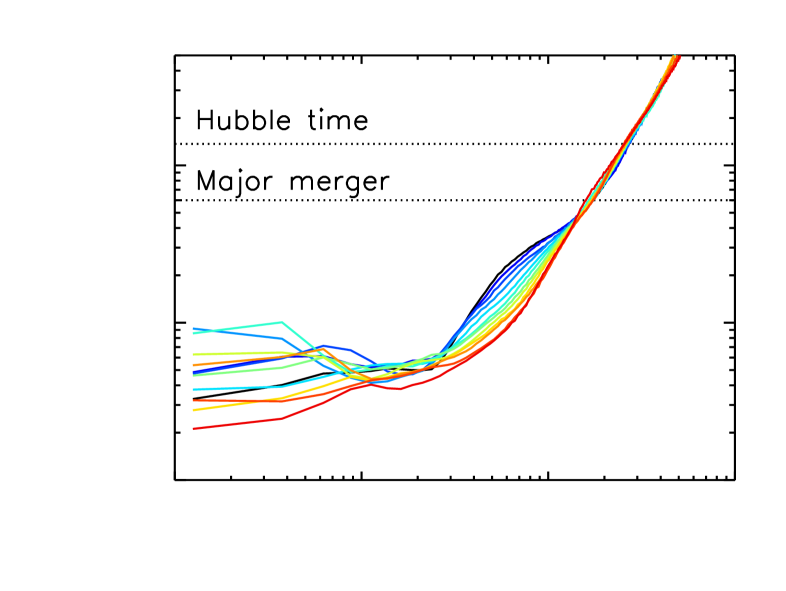
Following the cluster major merger at , the entropy in AGNJETrun shows a plateau in the core of the cluster at 100 keV.cm2 (fig. 4, third column, first row), which slightly decreases at late times as a moderate cooling flow develops and gas flows into the central galaxy. Nevertheless despite the cooling flow, high-entropy material does not replace the low-entropy material. The AGN regulates the amount of cold, low entropy material that gets incorporated into the galaxy by ejecting some of it back into the ICM, preventing high-entropy gas at large radii from flowing in in the process. Thus even though the cluster develops a small cooling flow, the amount of low entropy gas which flows into the centre is limited.
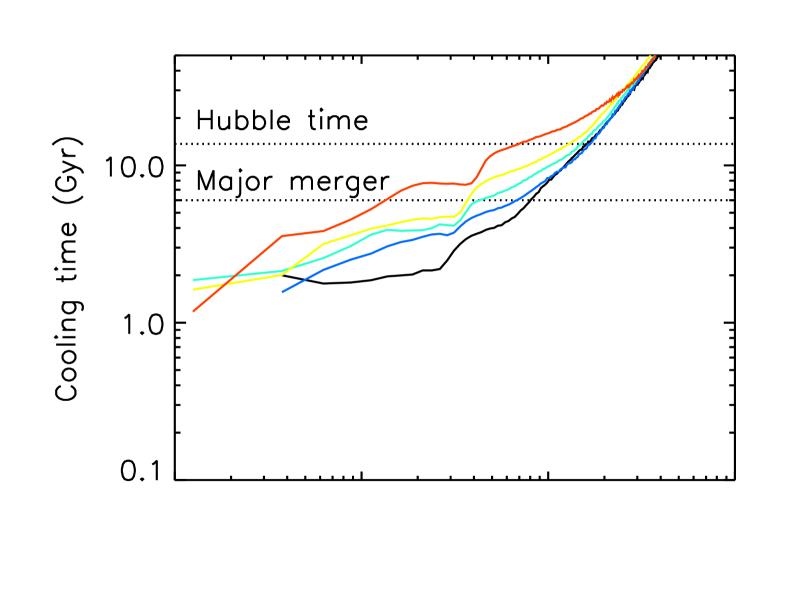
Contrary to the supersonic cooling flow in the NOAGNrun, that in the AGNJETrun is quiescent and largely sub-sonic () as can be seen from the radial velocity dispersion profiles (fig. 4, third column, sixth row). According to the cooling times plotted in figure 4 (third column, fourth row), the cluster core should experience a cooling catastrophe in less than 2-3 Gyrs (a few 100 Myr in the very central kpc region) if no source of feedback is active. It actually takes twice the time for the cluster to replenish the cold gas component in the galaxy and trigger a strong AGN activity at .
Understanding the mechanism of jet-induced AGN feedback is complicated by the variety of consequences it can have depending on the jet strength. In general, jet-induced AGN feedback stirs the cluster gas. Because the gas is compressible, kinetic energy imparted to the ICM can eventually turn into thermal energy. There are two ways of doing this: weak jets can gently stir the ICM and increase its turbulence, or strong jets can violently shock the surrounding gas and reheat it. While weak shocks increase the thermal energy indirectly by producing a high level of turbulence in the core that cascades into more weak shocks that further increase the entropy, strong shocks directly act on the entropy by increasing the temperature. Unfortunately, disentangling these two modes is a difficult task that is beyond the scope of this paper.
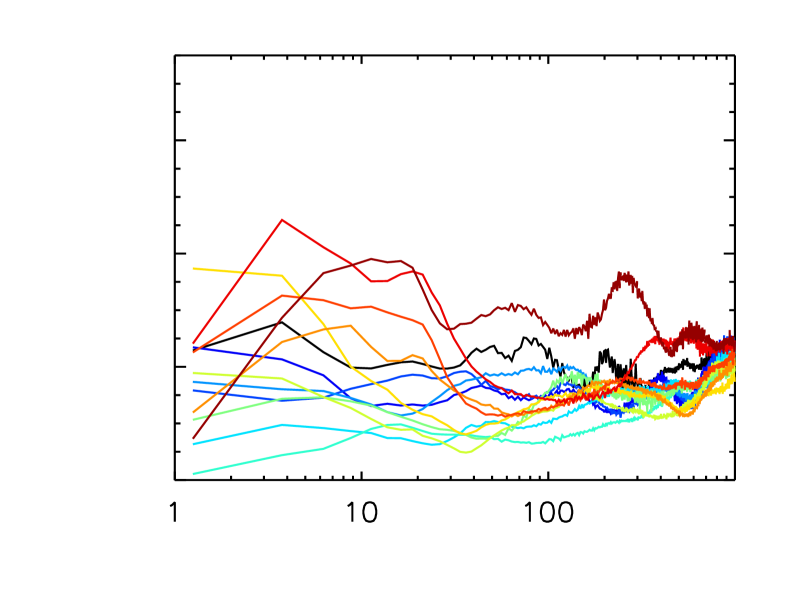
However, it appears that the effect of these different AGN jet modes on the ICM is to produce various entropy profiles in the cluster at different times. This could explain the large variety of entropy profiles in real X-ray clusters independent of their mass range (Sanderson et al., 2009; Pratt et al., 2010) as these would mainly dependent on the AGN activity. Indeed with the AGNJETrun simulation, we are able to produce a cluster that exhibits different entropy profiles at different times: from a flat entropy core at to a power-law entropy profile at .
The gas density profiles (fig. 4, third column, second row) lend support to the picture that AGN jet feedback stems the gas flow to the cluster core. Above an intermediate radius (100 kpc), the gas density is extremely close to the gas density in the ADIArun simulation, whereas in the NOAGNrun, gas is strongly depleted (gas density is four times lower at 100 kpc at in the NOAGNrun compared to the AGNJETrun). These conditions at intermediate radii and above hold over large time-scales, except at where a small cooling flow develops. The core’s gas density grows with time due to the cooling flow, but because of the AGN jet feedback all this gas cannot cool and form stars as efficiently as in the NOAGNrun. As a result the ICM density also grows in the core of the cluster.
The temperature profile (fig. 4, third column, third row) in the AGNJETrun simulation tends to an isothermal state at . After gas is shocked by the major merger (), the temperature is larger in the central 10 kpc of the cluster. AGN activity is negligible during this phase, (see Dubois et al., 2010) so it cannot explain the high temperature. Thereafter, gas cools diminishing the amount of thermal energy in the centre, and creating a small cooling flow around .
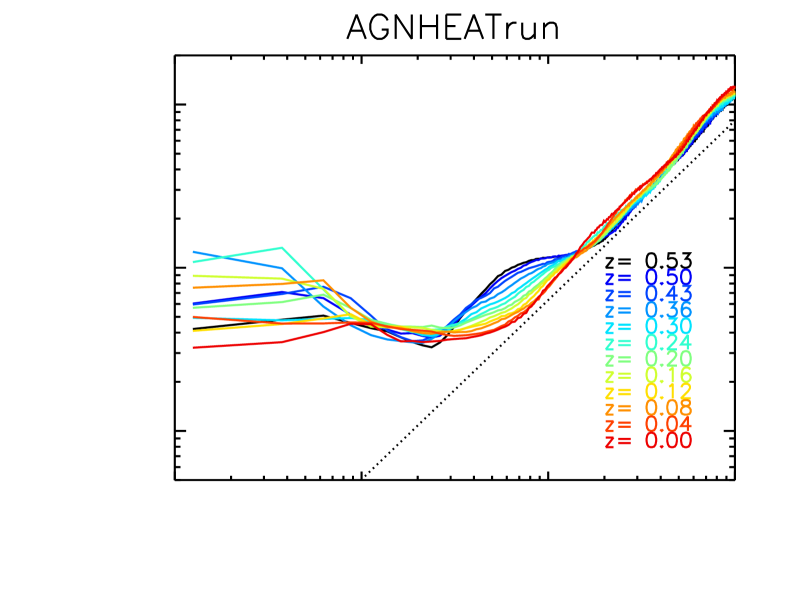
Interestingly, a thermal AGN feedback mode (AGNHEATrun) rather than a kinetic mode (AGNJETrun) creates a high temperature core component. We interpret this as a consequence of direct thermal energy injection from the central AGN source which translates into a larger injection of entropy at small radii. By not directly acting on the internal energy, the kinetic (jet) mode yields lower entropy profiles in the centre.
Like the jet AGN feedback, thermal AGN feedback prevents the cooling catastrophe. Indeed, the cumulative stellar mass profile in fig. 5, shows that the amount of stars formed at is very similar for the AGNHEATrun and the AGNJETrun. Gas mass and total baryon mass distributions are also very similar at intermediate and large ( kpc) cluster radii, therefore leading to similar ICM gas properties on these scales (see fig. 4). The only difference in the mass distributions appear in the core of the cluster: the total mass distributions (baryons plus dark matter) in the case of thermal energy and kinetic energy inputs are almost superimposed, but differences of a factor of a few are present in the separate components in the inner 20 kpc.
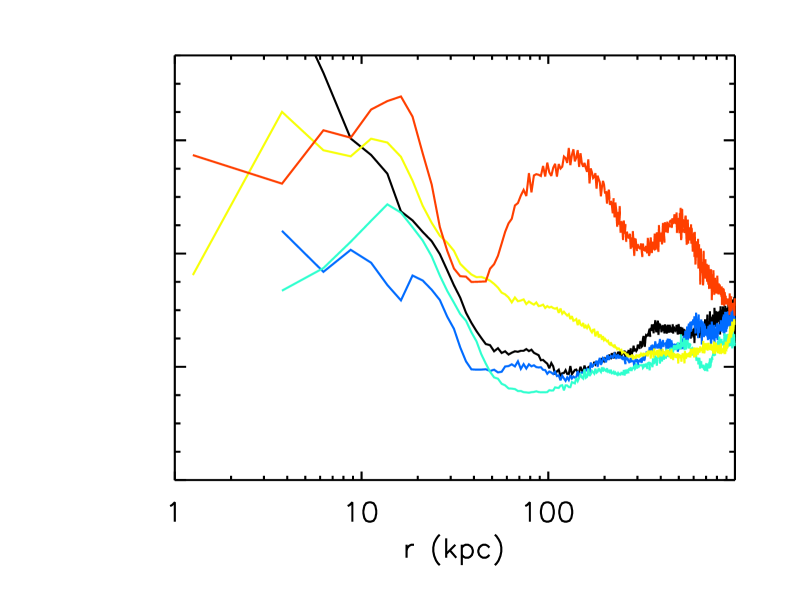
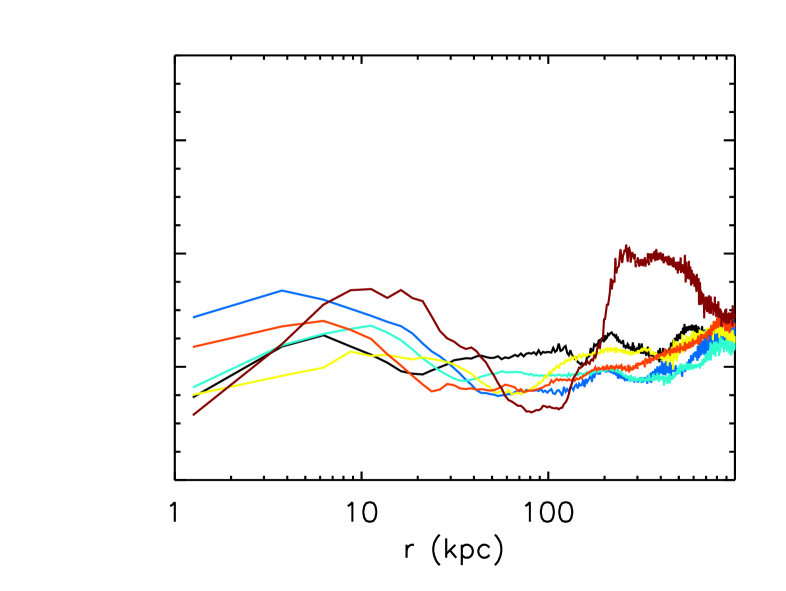
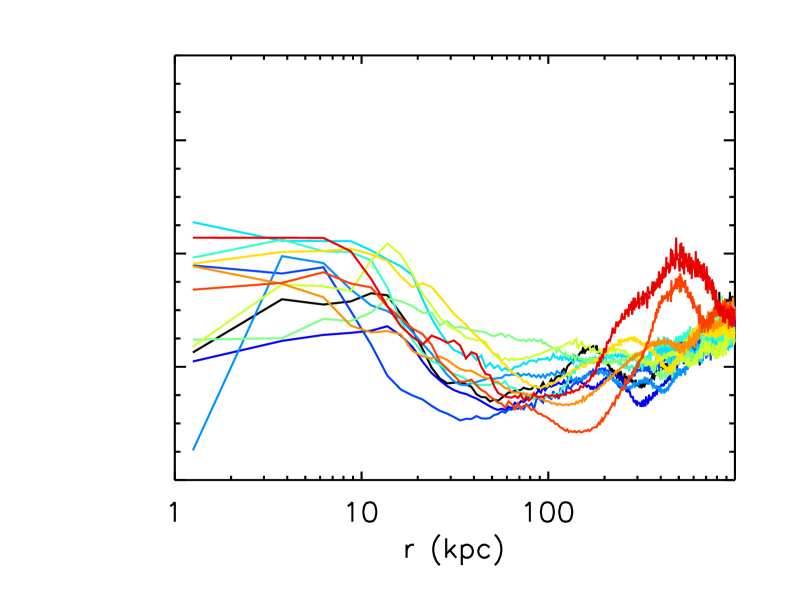
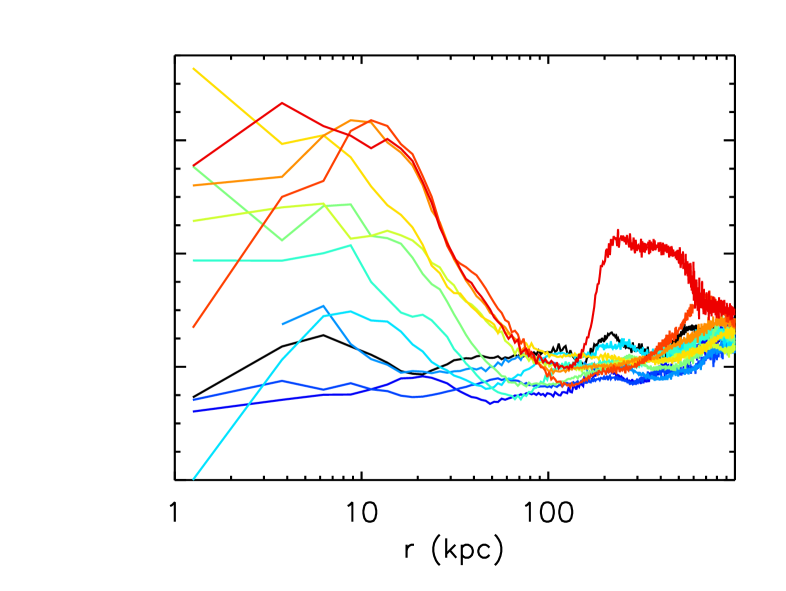
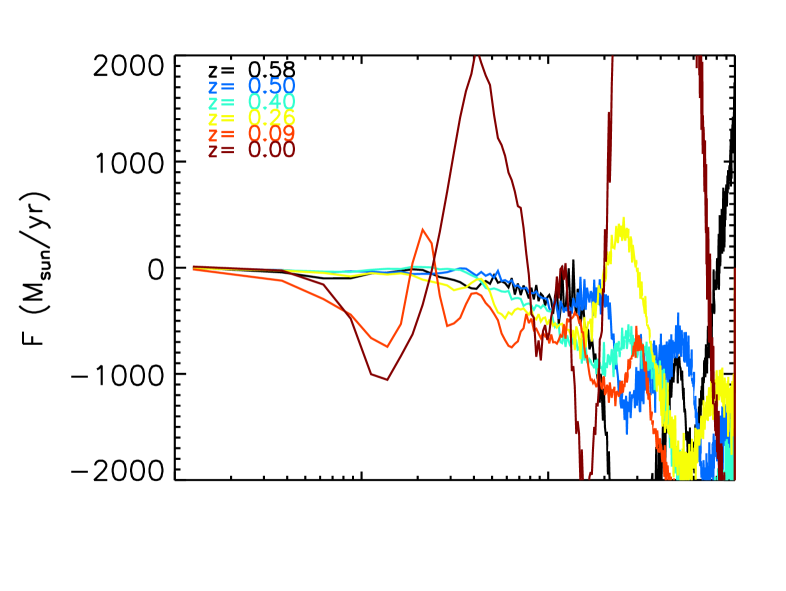
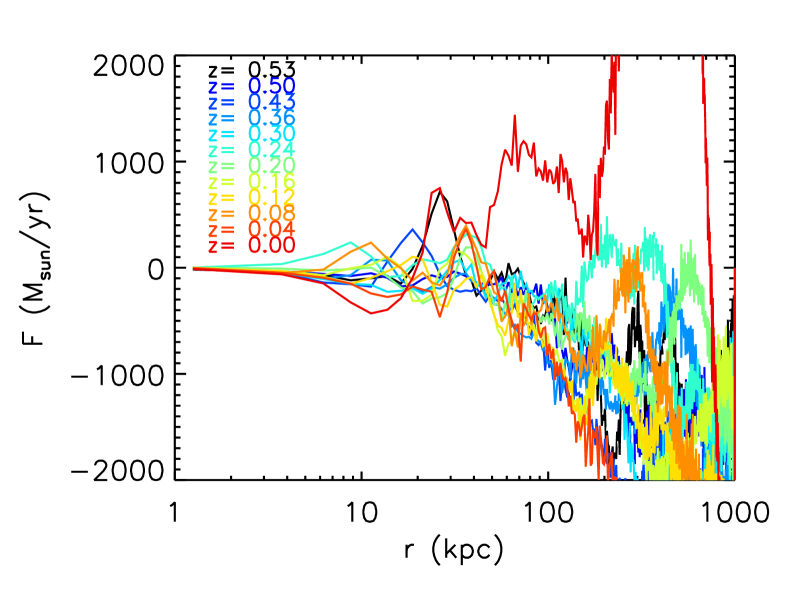
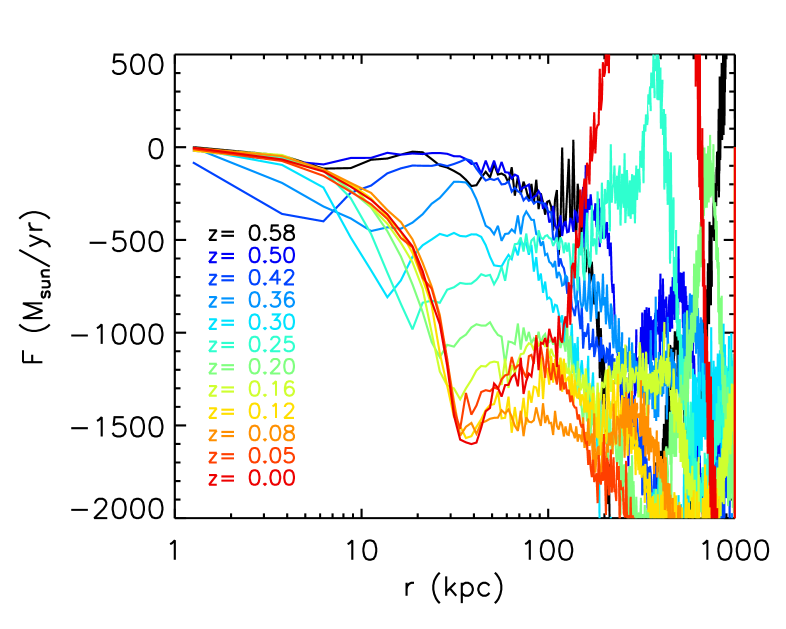
In fig. 6, we have represented the mass flux of gas at different radii and different times within spherical shells centred on the cluster for the AGNJETrun and the AGNHEATrun respectively. Negative and positive fluxes compensate to give a very faint net flux in the central 10 kpc of the cluster (fig. 6) for both the AGNJETrun and the AGNHEATrun. However at intermediate distances (), larger negative or positive net fluxes are measured, as a result of wave propagation from the central AGN source. The net flux in the cluster outskirts is largely negative as the AGN feedback does not significantly impact the gas at such large distances.
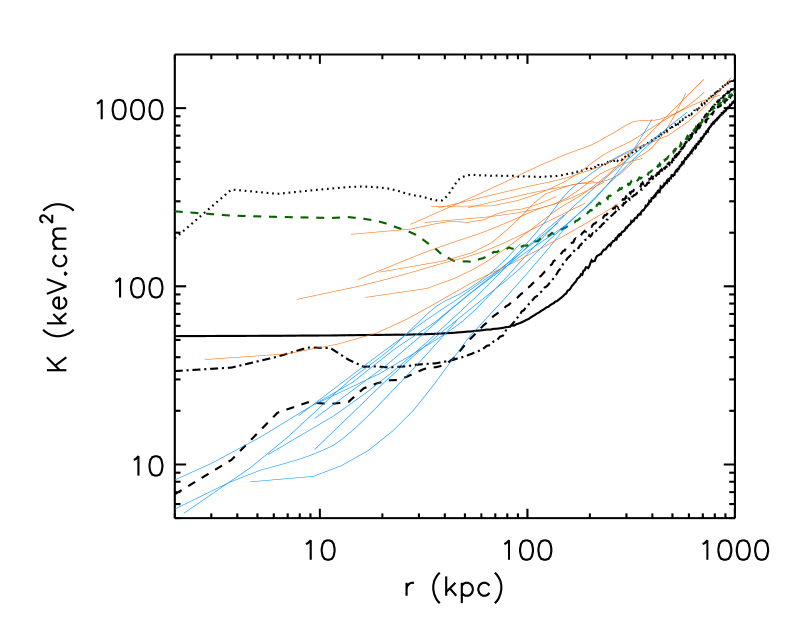
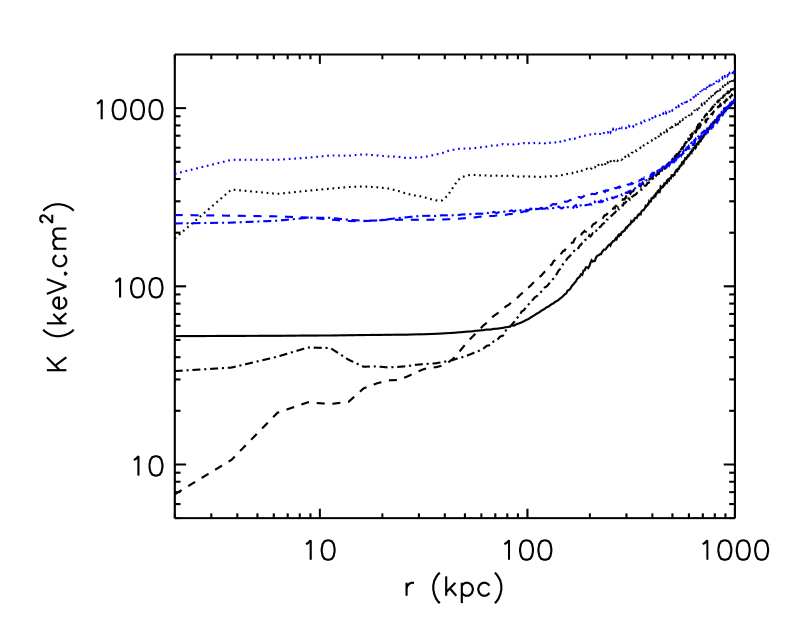
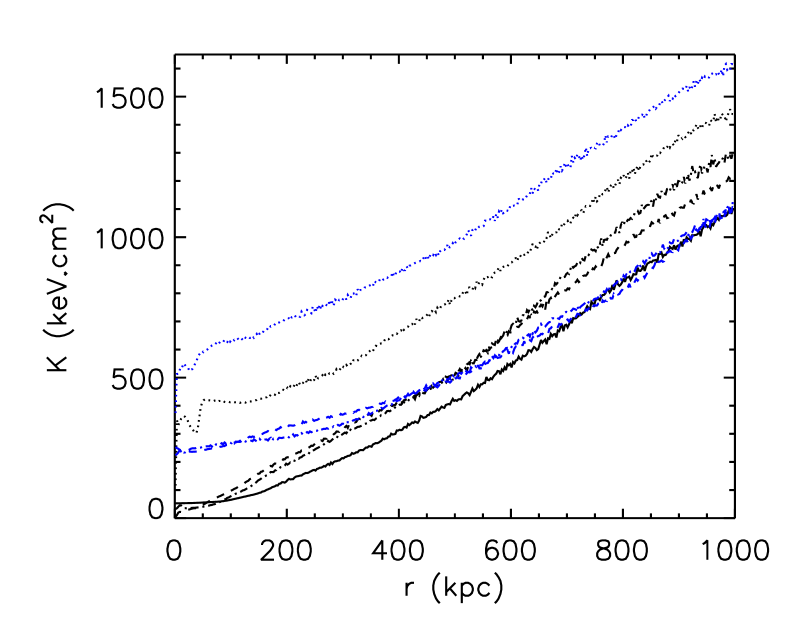
Fig. 7 shows that the simulation that includes AGN jet feedback (AGNJETrun) all the way down to reaches the lowest entropy, with values below keV.cm2 a few kpc away from the centre. In contrast, the simulation that has no feedback at anytime (NOAGNrun) has the largest entropy floor in the core ( keV.cm2). In fig. 7, we also give the observational entropy profiles of 20 X-ray selected clusters with cool cores (light blue lines) or non-cool cores (light orange lines) from Sanderson et al. (2009) in the temperature range 1-10 keV. The non-cool core clusters show an entropy floor in the centre of the cluster (light orange lines), whereas cool clusters possess entropy profiles declining towards the centre (light blue lines). Thus, the presence of jet AGN feedback allows the formation of a cool-core cluster whereas with the AGN heating mode the cluster is always maintained in a non-cool core configuration. It is worth to note that without AGN feedback the entropy floor is kept very high in the core with an amplitude higher than those observed for the most massive of the non-cool core clusters (Sanderson et al., 2009).
Finally, one might wonder how robust our profiles are to the choice of averaging method (spectroscopic-like/X-Ray or volume weighted) for the physical quantities. As discussed in detail in Appendix A, large differences between averages appear in the core of the cluster (inner 50 kpc or so) when a massive disc of cold gas has developed in the central galaxy, fed by an unchecked cooling catastrophe. Otherwise, the agreement between all estimates is excellent, as demonstrated by the profiles (black and dark blue curves in all panels) on Fig. 13. Therefore, at least all the inner profiles we measure in the (more realistic) runs where the cooling catastrophe is prevented (AGNJET and AGNHEAT) are reliable.
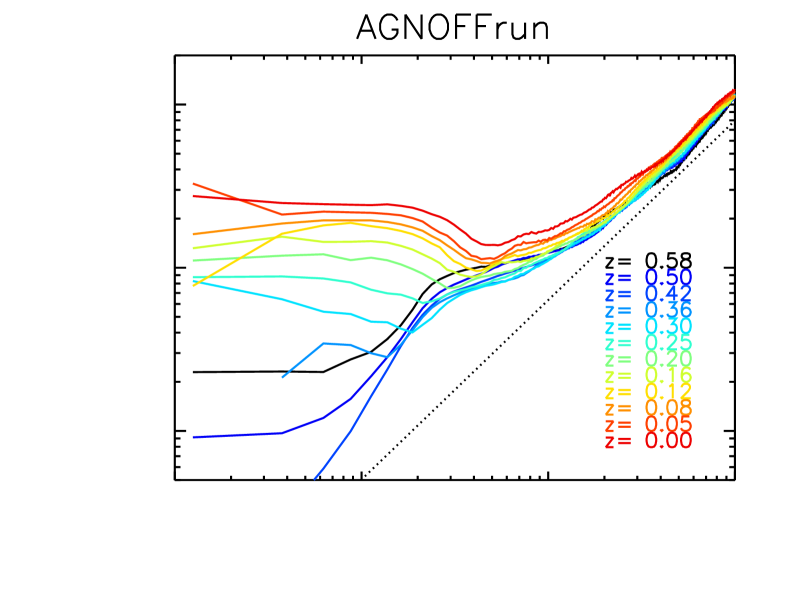
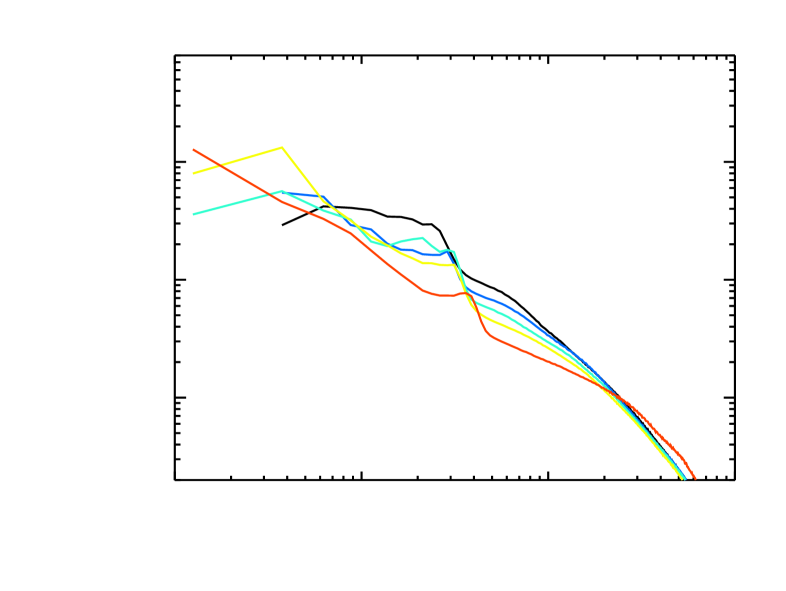
3.5 The effect of the pre-heating
In the interest of understanding whether a strong initial pre-heating of the gas is alone able to prevent a cooling catastrophe for several Gyrs, we run the following simple experiment: we restart the AGNJETrun simulation after the major merger, i.e. from , deactivating BH accretion and AGN feedback. We call this simulation the AGNOFFrun. In the literature, the term ‘pre-heating’ is generally employed in a generic sense to describe a rise in the level of entropy of the proto-cluster gas (e.g. Kaiser, 1991; Evrard & Henry, 1991) which can be caused by various physical processes. In the current work, we refer to pre-heating as the rise in entropy which is self-consistently provided by the feedback processes modelled in the simulations before the final assembly of the cluster. This explains why the end of the pre-heating phase coincides with the beginning of the last major merger undergone by the cluster at .
Between and , 2 Gyrs of evolution elapse. Fig. 4 (fifth column, fourth row) shows that this coincides with the cooling time for AGNOFFrun’s ICM gas at and kpc. Therefore as expected, inside this radius, the entropy profile strongly declines during this time interval (fig. 4, fifth column, first row), signaling a cooling flow into the centre. More specifically the entropy in the cluster core ( kpc) decreases from its values at () to very low values () at . Concomitantly the gas density in the centre of the cluster increases (fig. 4, fifth column, second row) as internal energy is radiated away by gas cooling, leading to a loss of pressure support (fig. 4, fifth column, fifth row). Nevertheless by redshift , the cluster has not yet reached the cooling catastrophe stage; the cooling flow is still moderate and subsonic.
Gradually after , the cooling catastrophe develops: gas flows supersonically into the gravitational potential well (see radial velocity dispersion profiles in fig. 4, fifth column, sixth row), concentrates in the cluster centre (fig. 5, left panel in upper row) and forms a cold disc component (see fig. 3). As the gas condenses in the centre, strong star formation occurs in the central galaxy (see cumulative stellar mass profiles in upper middle panel of fig. 5) resulting in a more massive galaxy at in the AGNOFFrun than in the AGNJETrun. DM also concentrates more in the cluster centre through adiabatic contraction (fig. 5, middle panel in bottom row). Bizarrely enough, it is also clear from this figure, that the AGNOFFrun cluster features a DM halo less concentrated than in the AGNHEATrun. This, in turn, demonstrates that a different implementation of AGN feedback can have a significant and counterintuitive impact on the DM concentration of clusters: the mode that reduces the baryonic mass the most in the cluster core (AGNHEATrun) at is also the mode which has the largest DM halo concentration. This is because the stellar component should be taken into account when calculating adiabatic contraction as it responds in the same collisionless way as the dark matter. In other words, when one compares the total mass of dark matter plus stars (fig. 5, right panel in bottom row, at least in the center where the gas mass in negligible), the AGNOFFrun becomes more concentrated than its AGNHEATrun counterpart, as naively expected.
We can monitor the effect of preheating on the progression of the cooling catastrophe in fig. 8. It shows that as soon as the AGN feedback is turned off, the low-entropy material quickly flows into the centre and becomes part of the central galaxy ISM. Gas located at larger distances is then subsequently accreted. In other words, higher entropy material replaces low-entropy gas thereby increasing the ICM entropy in the core of the cluster (fig. 4, fifth column, first row). In the meantime, fig. 4 (fifth column, first row) shows that the entropy continues to grow at larger radii ( kpc) because of the loss of pressure support at increasingly larger radii as low entropy gas is removed from the cluster centre to form stars. Unlike the supersonic flow at small radii, at large radii ( kpc) the gas flows quiescently into the core (see gas radial velocity dispersion in fig. 4, fifth column, sixth row). We also note that the entropy profile at is larger in the core ( kpc) than at moderate distance ( kpc) from the centre (see fig. 4, fifth column, first row). This cannot be the consequence of an adiabatic process, because the entropy profile would be monotonic. Therefore, there are two possible explanations for the behavior of the entropy profile: (i) either it is the result of spurious entropy produced by the grid code which is not a strictly entropy-conserving scheme, or (ii) a strong shock developed somewhere in the cluster core causing the gas to endure a non-reversible process. Even though we cannot entirely rule out the former possibility, there is plenty of evidence in favor of the latter. As the central ICM rapidly flows onto a cold and dense galactic disc component, there is a strong discontinuity both in gas density and temperature at the disc interface. This is evidence of a strong shock. As a result, upwind of the shock the ICM is heated, and both temperature and entropy increase. Figs. 2 and 3, show this high-entropy, hot region perpendicular to the galactic disc.
Finally, an interesting feature of the AGNOFFrun simulation is that compared to the AGNJETrun which includes kinetic AGN feedback all the way down to , the gas properties at large radii are hardly modified by the absence of late-time AGN activity. This is because the cooling flow does not extend to radii greater than kpc and the late AGN jet activity hardly perturbs the gas beyond these distances. In light of our previous analysis, we conclude that pre-heating from AGN feedback at high redshift () cannot single-handedly prevent a cooling catastrophe, but that it plays an important role in (i) setting up the gas properties at large distances from the centre, and (ii) to some extent softens the consequences of the catastrophic cooling in the core (lower entropy, temperature of the gas and even mass of dark matter and baryons).
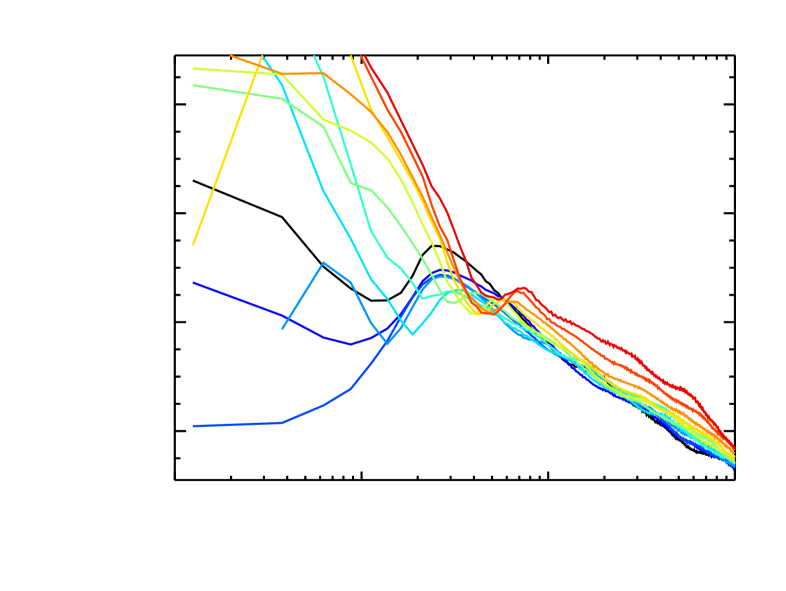
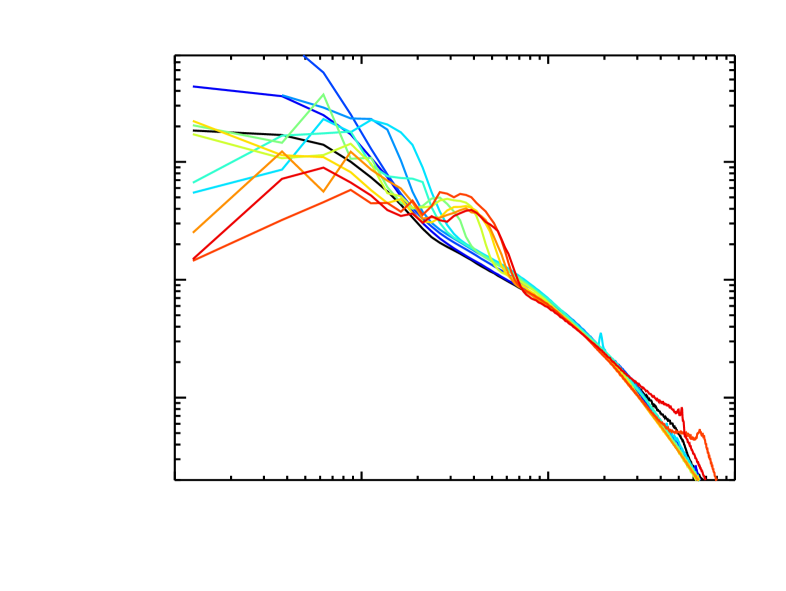
3.6 The effect of metal cooling


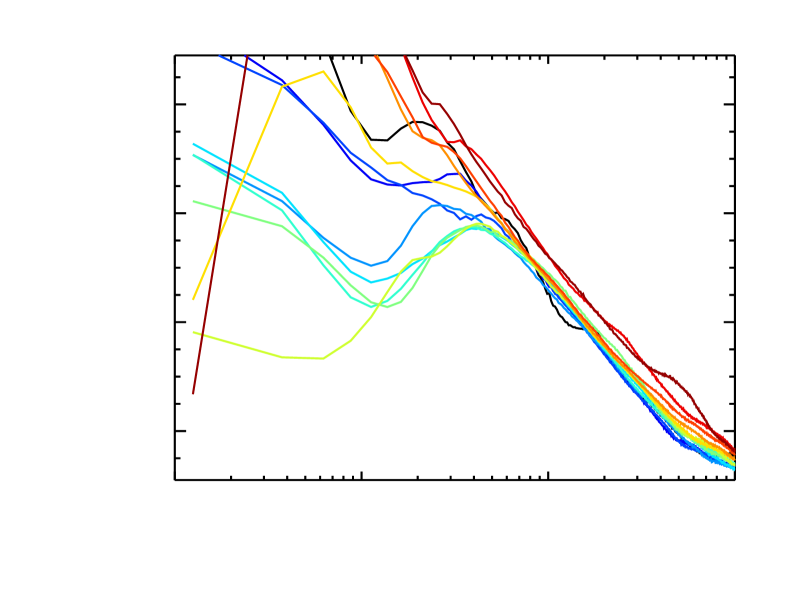

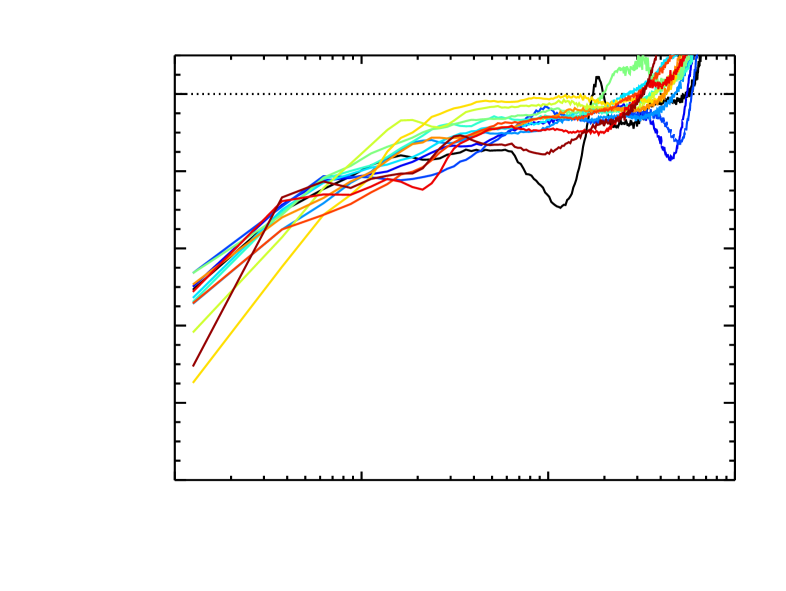
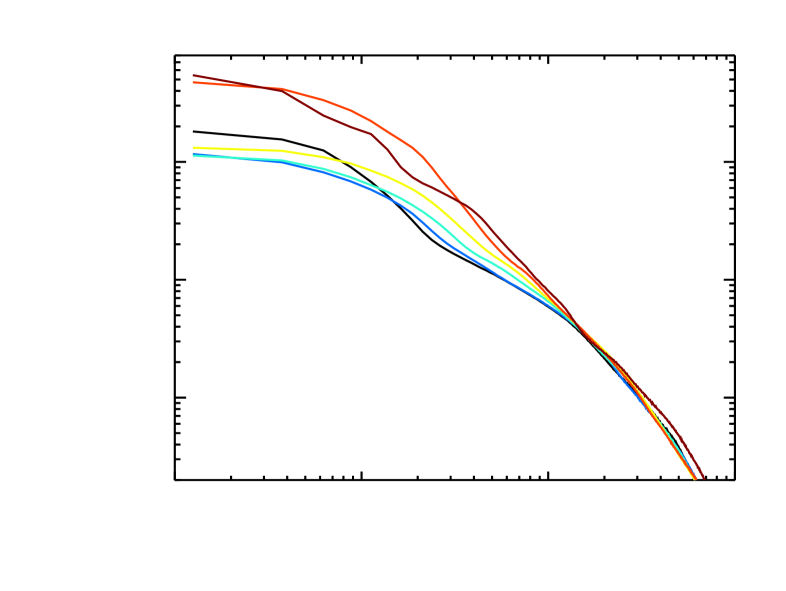
Until now, this paper has discussed the results from the cluster resimulations without supernovae and the accompanying stronger cooling due to metals released in the explosions. In this section, we analyze versions of the cluster simulations with supernovae (ZNOAGNrun, ZAGNJETrun, ZAGNHEATrun, ZAGNOFFrun) and focus on the effect of metal cooling on the gas properties of the ICM.
Like Fig. 4 for the no metal case, Fig. 9 shows the time evolution of different thermodynamical gas profiles for the ICM when SN and hence metal enrichment is included in the simulations. For ease of comparison, we display the results from the simulation with primordial cooling (NOAGNrun) in the same panel. In the absence of AGN feedback (ZNOAGNrun), the galaxy cluster endures a strong cooling catastrophe as evidenced clearly by the gas pressure profiles (Fig. 9, second column, fifth row), even though energy from SN explosions is deposited into the surrounding gas. This is not a surprising result as it has been known for some time that the energy from SN feedback is not enough to suppress the cooling catastrophe in massive structures (Nagai et al., 2007). Cosmological re-simulations of the formation and evolution of a proto-galactic structure in a Milky-Way like halo performed at sub-parsec resolution (Powell et al., 2011) show that the mass-loading factor of large-scale, supernova driven outflows is low and therefore they cannot remove large amounts of gas from high-redshift galaxies, as was also shown in an idealized context by Dubois & Teyssier (2008).
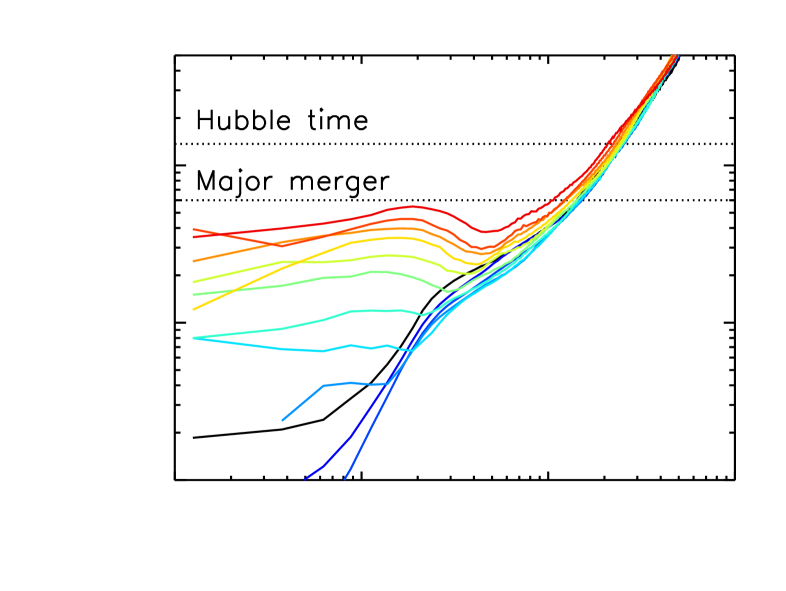
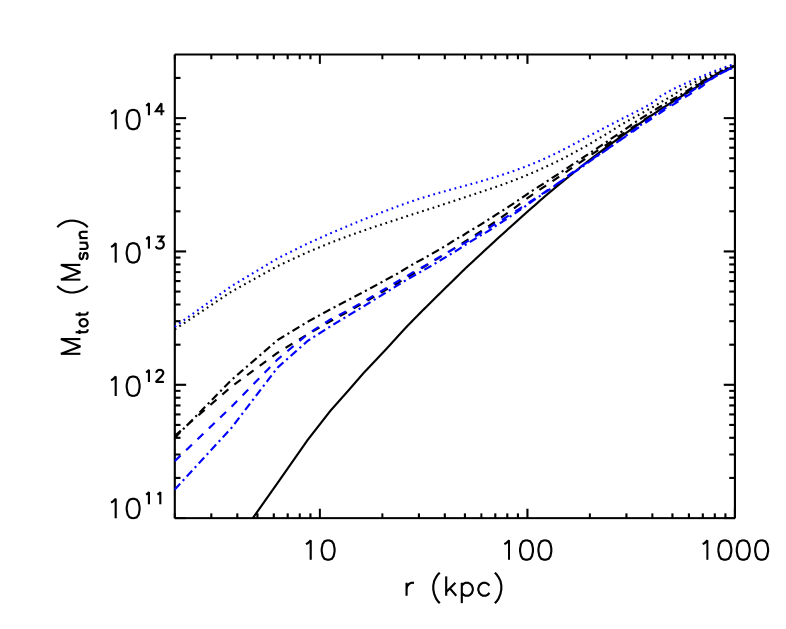
Therefore, instead of alleviating the cooling catastrophe, SNe actually produce a stronger one, with the total mass being more concentrated in the centre of the cluster than in the absence of SN feedback (NOAGNrun, fig. 10). This is because the metals released by SNe reduce the cooling timescales at high redshift. Indeed, even though this effect is very pronounced at lower temperatures (TK), and more moderate for the ICM (20 % variation at keV), the high redshift progenitors of the cluster are filled by material at much lower temperature than a few keV, and so metals lead to an increase of the gas cooling efficiency by about an order of magnitude or more in these structures (Sutherland & Dopita, 1993). It results in larger cooling times at low redshift (see cooling timescale profiles in Fig. 9, fourth row, first and second columns) because the cluster has suffered more from the cooling catastrophe and the gas that stays in the core of the ICM has a larger entropy.
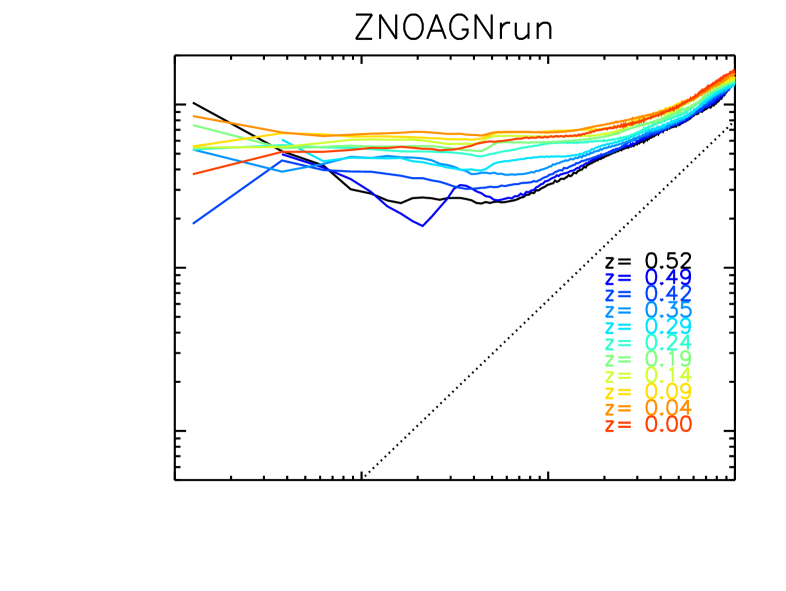
In other words, in the simulations with metals, a larger amount of gas collapses early on into galaxy and group size dark matter halos and forms stars. Halos thereby endure a more marked depletion of their gas content than in the comparable simulation with no metals (NOAGNrun), leading to lower gas density profiles for ZNOAGNrun (see Fig. 9, second row, first and second columns). As explained in previous sections, as central regions get depleted, gas from the outer regions can flow into them because of the lack of pressure support. Because this loss of pressure support associated with the cooling catastrophe in the ZNOAGNrun not only takes place earlier but also at larger radii than in the NOAGNrun, gas flows into the cluster centre from larger distances in the ZNOAGNrun. Since the gas density is lower at large radius but the temperature of the infalling shocked IGM gas is the same as at smaller radii, the amount of entropy carried by gas coming in from larger radii is larger. As a result, higher entropy gas than that in the NOAGNrun replaces the low entropy material at small radii in the ZNOAGNrun, leading to entropy profiles that rise with time to a higher level in the run with metals (Fig. 9, first and second column, first row).
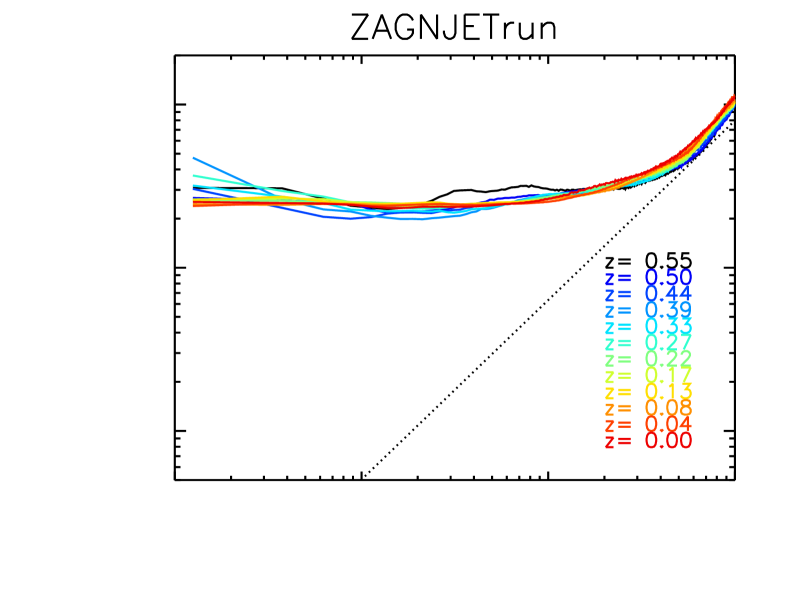
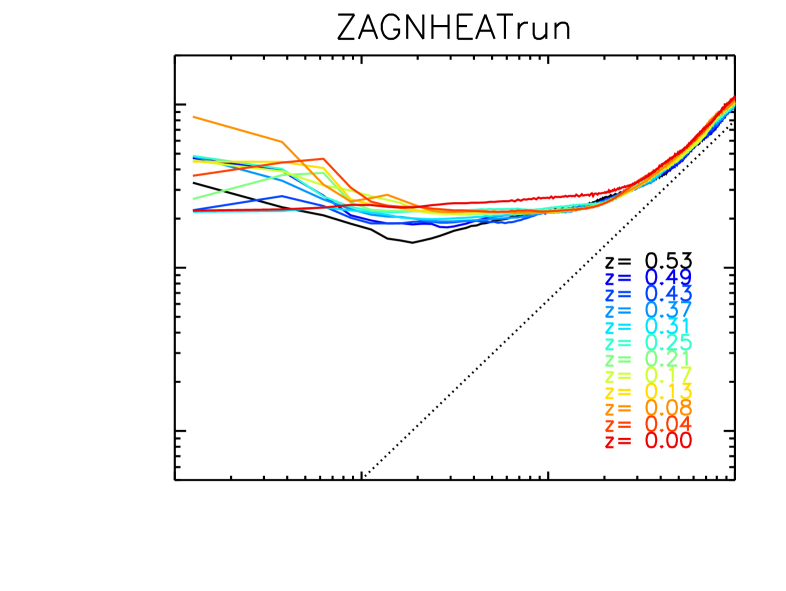
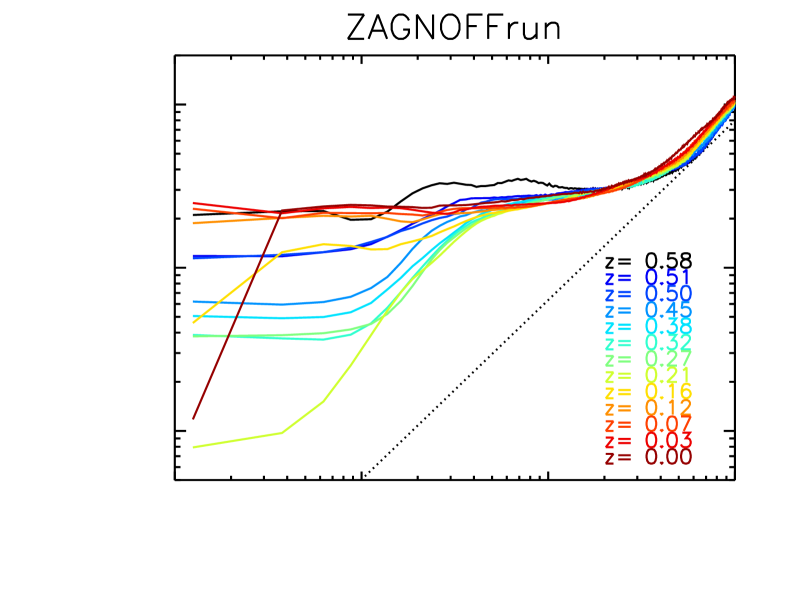
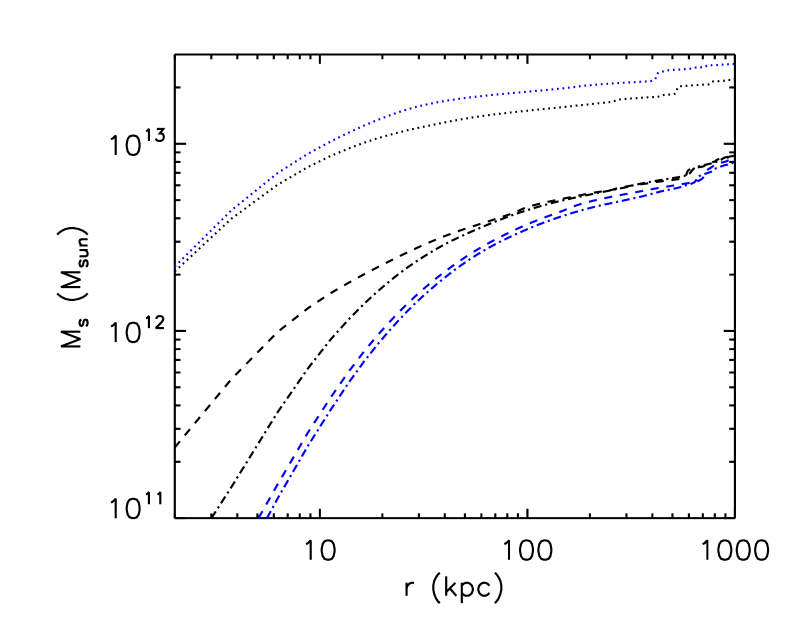
The simulations ZAGNJETrun and ZAGNHEATrun, which include AGN feedback with the kinetic and thermal modes respectively, show very similar gas properties (Fig. 9, third and fourth columns), and mass distributions (Fig. 10). Even the concentration of the cluster DM profile which was noticeably different in the AGNJETrun and AGNHEATrun simulations is now very similar. Thus, we will not consider hereafter the different effects of these two modes on the gas, which are already described for their equivalent simulations with no SN (AGNJETrun and AGNHEATrun) in section 3.4. Instead we focus on how metals alter the effect of AGN feedback. First we compare the three simulations with metals, where one has no AGN feedback (ZNOAGNrun) and the others do (ZAGNJETrun, ZAGNHEATrun). As was the case without metals, for the simulations with metals (ZAGNJETrun and ZAGNHEATrun) AGN feedback diminishes the amount of entropy in the ICM compared to the simulation without AGN (ZNOAGNrun). AGN feedback, again, suppresses the cooling catastrophe, even though more efficient metal cooling at early times makes this more challenging than in the no metal case. We emphasize that, as in the no metal case and despite a much larger amount of preheating from SN and AGNs at high redshift, only the runs where AGN feedback is present during the whole evolution of the cluster are able to prevent the cooling catastrophe. In the ZAGNOFFrun simulation (Fig. 9, last column) where AGN feedback is switched off after the last major merger, the central galaxy ends up accreting cold gas at a rate of 500 /yr by . All mass components (gas, stars, DM) at in ZAGNJETrun and ZAGNHEATrun are less concentrated in the centre of the cluster compared to the ZNOAGNrun (Fig. 10), and unlike in ZNOAGNrun, the gas supports itself against its own collapse in ZAGNJETrun and ZAGNHEATrun (Fig. 9, third and fourth columns, fifth row).
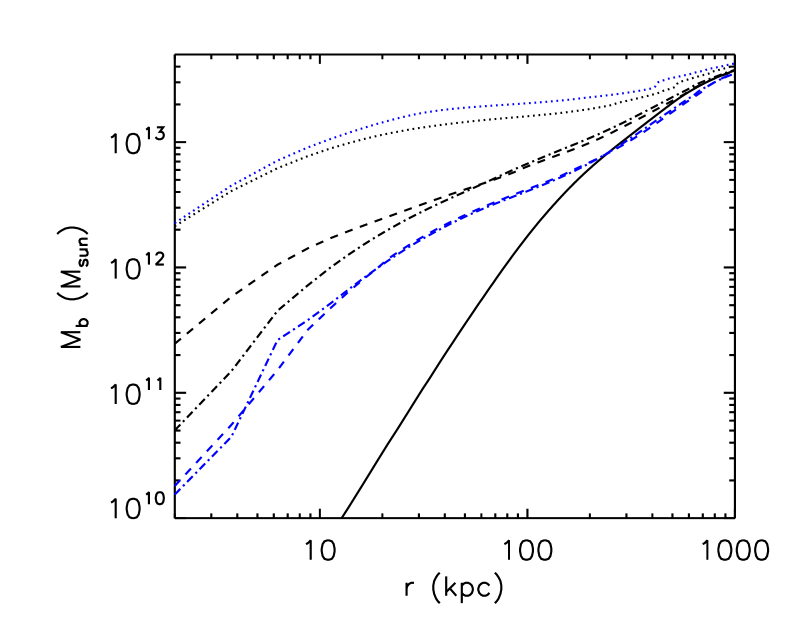
Next we examine the differences between the AGN feedback runs with and without metals. The presence of metals plays a crucial role in how the AGN impacts the gas. Comparing entropy profiles at for simulations with AGN feedback and metals (ZAGNJETrun and ZAGNHEATrun), to the equivalent simulations without metals (AGNJETrun and AGNHEATrun) in Fig. 11, we see that, in the simulations with metals, entropy levels in the cluster core are larger by almost one order of magnitude. The cause of this effect can be traced back to the fact that metals increase the cooling efficiency of the gas in the early phases of structure formation. This leads to more fuel for AGN activity at early times which pushes more gas to larger distances from the centre of the halos. Note however, that this is only an integrated time effect. As a consequence, very early on, before the AGN has reached a mass when its feedback allows it to significantly impact the fate of the intra-halo gas, baryons are more concentrated in the ZAGNJETrun than in the AGNJETrun. This is reflected in the DM density profile which is more concentrated in the ZAGNJETrun than in the AGNJETrun (fig. 10 middle panel of bottom row), even though the amount of baryons in the ZAGNJETrun at is much smaller than in the AGNJETrun.
Nevertheless, in general, because of these early time effects, the integrated mass of baryons at at all radii (Fig. 10) is smaller when metals and AGN are present (ZAGNJETrun and ZAGNHEATrun) than for the equivalent AGN simulations without metals (AGNJETrun and AGNHEATrun). The total stellar mass at in the cluster is also reduced by the combined effect of AGN activity and metal release by SNe. This underlines the fact that AGN feedback has a stronger effect on the cold baryon content, because of the enhanced cooling rates which allow the BH central engine to grow faster at high redshift and thus quench star formation earlier on. This is also reflected by the fact that the central BH is more massive when metal enhanced cooling is enabled (see table 1) and implies larger amounts of energy deposited into the ICM.
We note that the main results we obtain when metal cooling and AGN feedback are included in the simulations (i.e. increased amount of pre-heating at high redshift, reduced stellar mass for the central galaxies, too high level of entropy in the cluster core, central temperature profiles which are too steep) are broadly consistent with those obtained by Fabjan et al. (2010) for different clusters using a different numerical technique and a slightly different model of AGN thermal feedback. We also remark that we still have an adiabatic contraction of the DM halo, contrary to what Teyssier et al. (2011) obtained in their Virgo-like cluster with thermal AGN feedback. In this paper, we inject the energy of the thermal feedback on the same scale as the jet mode, close to the resolution limit, to facilitate a comparison between the two runs. Note that this is different from the scale adopted by Teyssier et al. (2011), who injected the thermal energy into large bubbles, and explains why we are not able to halt adiabatic contraction and they are. In short, injecting thermal energy on larger scales increases the effective efficiency of AGN feedback. A detailed study of parameter/resolution impact on our results is deferred to a companion paper (Dubois et al, in prep).
At late times , there is no longer a cold gas component in the centre of the cluster of ZAGNJETrun and ZAGNHEATrun (Fig. 9, third and fourth columns, third row) and the gas remains in hydrostatic equilibrium (Fig. 9, third and fourth columns, fifth row) because cooling times are comparable to the last major merger times (Fig. 9, third and fourth columns, fourth row), and therefore cold gas only triggers some faint AGN feedback activity. Note however that such a reduced level of AGN feedback activity at low redshift is key to prevent a cooling catastrophe, as demonstrated by the gas profiles measured in the ZAGNOFFrun simulation (Fig. 9, fifth column) which lacks such a low redshift AGN feedback activity. The strong enhanced early phase of AGN activity in ZAGNJETrun and ZAGNHEATrun leads to lower entropy compared to the no metal simulations AGNJETrun and AGNHEATrun at large distances from the centre, because of the redistribution of the gas from the centre of the cluster to the outskirts (Fig. 11, bottom panel). However, the temperature profiles for ZAGNJETrun and ZAGNHEATrun seem rather unrealistic, when compared to observations: they continuously increase with decreasing radius with extremely high values (10–20 keV) in the central 10 kpc (Fig. 9, third and fourth columnds, third row). This is a direct consequence of the mass distribution in the cluster and the hydrostatic equilibrium. It is possible that a more complete AGN feedback prescription such as one that includes photo-heating could, at least partially, alleviate this problem. As suggested by Cantalupo (2010), soft X-ray photons emitted by stars during strong starburst episodes or by AGN, can offset radiative losses by photo-heating the main ion coolants in proto-cluster and massive galaxy halos. If this kind of feedback takes place at high redshift, it could halt the cooling catastrophe without removing much mass from the centre. This would increase the central gas density, decrease the ‘apparent’ cooling time (as opposed to the effective cooling time, which is increased by the photo-ionization effect), and allow for lower temperatures in the cores of the clusters. We defer a numerical investigation of this scenario to future studies.
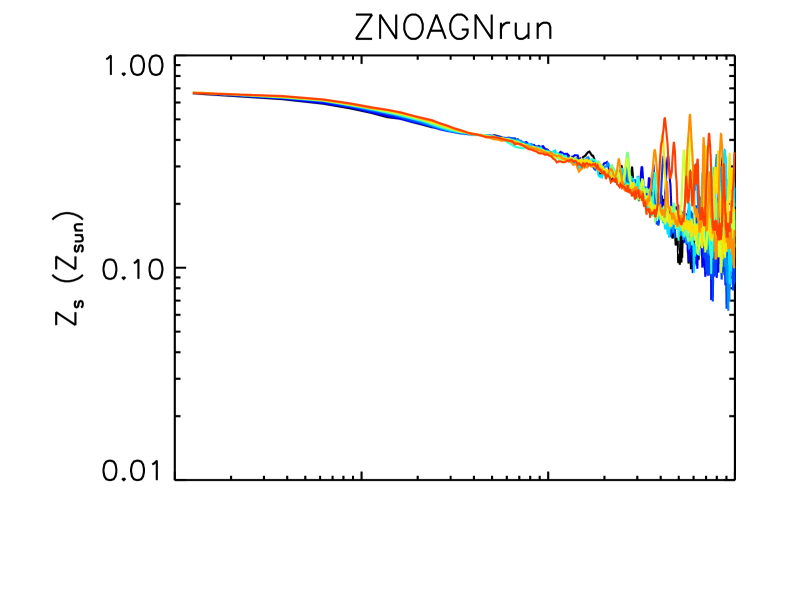
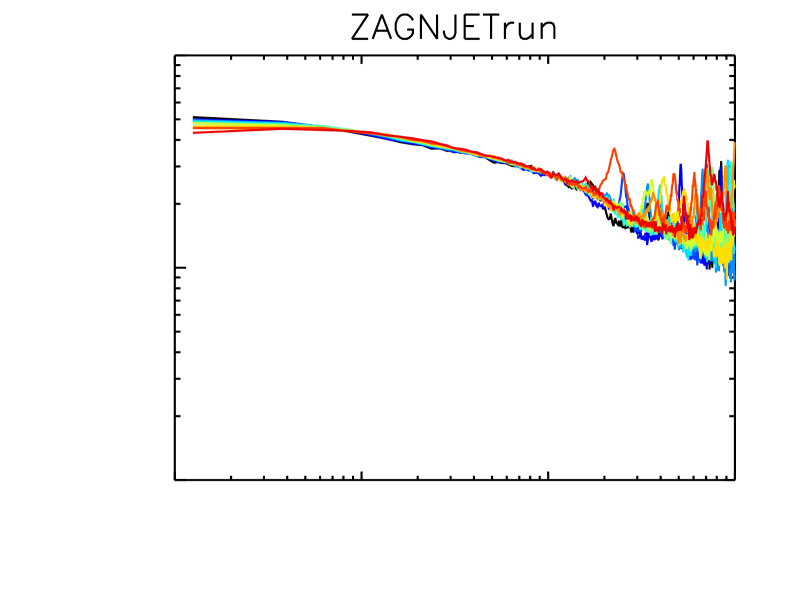
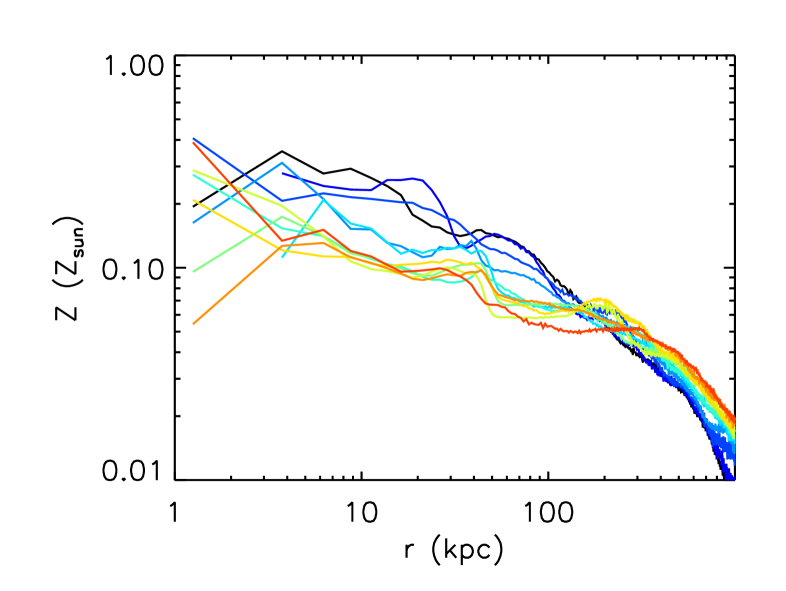
Finally, we must also point out that we measure a lower gas metallicity, at , plotted in fig. 12 and a steeper spatial gradient that those observed (- from Sanderson et al., 2009). This is even worse for the stellar metallicity, which is observed to be larger than solar for giant ellipticals (e.g. Casuso et al. (1996)). Aside from uncertainties in the stellar yields and the stellar initial mass function, there are (at least) two other reasons why we are not able to achieve more realistic metal abundances. The first one is the inability at a given DM mass resolution to resolve well enough the star formation of small satellites galaxies that are responsible for the enrichment of the IGM with large-scale galactic winds (Dubois & Teyssier, 2008). The second is the lack of modeling of both stellar winds and Type Ia SN that return a large fraction of their stellar mass content back to the gas. We plan to address both issues in a near future but the comparison of the no metal and (low) metal runs that we have performed strongly suggest that a higher amount of metals in the gaseous phase will simply lead to more intense early AGN feedback.
4 Conclusions
We have performed high-resolution resimulations of a cosmological galaxy cluster, using standard implementations for galactic physics (e.g. radiative cooling, star formation, supernova feedback, uniform UV background heating to model reionization) and different prescriptions for AGN feedback (Dubois et al., 2010; Teyssier et al., 2011).
Whereas observations indicate that non-cool cores are highly correlated with the level of disturbance of the ICM (e.g. Sanderson et al., 2009; Rossetti & Molendi, 2010), suggesting that major mergers are responsible for the formation of non-cool core objects, our set of simulations leads us to conclude that merger activity alone (i.e. not backed by AGN feedback) cannot sustain core profiles over timescales comparable to the Hubble time. It therefore seems difficult to argue that this mechanism can account for a significant fraction of the non-cool core cluster population. These simulations also show that pre-heating by SN and AGN feedback at high redshift alone, before the cluster has fully assembled is not sufficient to prevent the occurrence of a cooling catastrophe. Instead, they lend support to the view that AGN must provide some amount of extra pressure support to the gas in the cluster core after the galaxy cluster has formed. This late feedback is also key to shape the thermodynamical properties of the central ICM.
Indeed, we established that for a gas with pristine composition, the natural interaction between an AGN jet and the ICM which regulates the growth of the AGN’s BH, can produce entropy profiles with different shapes: sometimes the profile has an entropy floor in the core (i.e. the cluster will be classified as non-cool core), while at other times, if cooling is sufficiently rapid there will be a power-law entropy profile extending from large radii down to the cluster centre (i.e. the cluster will belong to the cool core cluster category). Hence, AGN jet feedback appears to be a good candidate to explain the variety of entropy profiles observed in galaxy clusters (Sanderson et al., 2009), provided metal cooling is neglected.
Without significant AGN feedback at intermediate and low redshift, clusters rapidly transfer their low-entropy ICM material to a galactic disc and replace it with the high-entropy gas stocked in their outskirts. As a result, a high-entropy floor and large amounts of baryons are systematic features of cluster cores. Moreover, as the cooling catastrophe ensues, gigantic starbursts erupt within the massive galactic discs anchored at the bottom of the gravitational potential well of these clusters. Taken at face value, these results seem to contradict the recent findings of McCarthy et al. (2011)’s simulations of galaxy groups. In these lighter structures, they conclude that, on average, turning off the AGN feedback at intermediate redshift () lowers the entropy of the gas in the core compared to simulations where AGN feedback is permitted to proceed down to . Assuming that the differences between our results cannot be attributed to numerics (SPH versus Eulerian grids), we interpret them as an indication of a fundamental difference in the way feedback mechanisms can operate in galaxy groups and clusters. For the former, the effects of high redshift AGN feedback are still felt at , whereas for the latter they are wiped out by the stronger gravitational forces on time scales comparable to the assembly time and therefore need to be sustained at later epochs.
Finally, we assessed the effect of metal cooling on the gas properties of the ICM. Metals ejected by SNe accelerate the gravitational collapse of baryons by sapping their internal energy. As a result, in the absence of an AGN feedback mechanism, the cooling catastrophe is exacerbated. However, when AGN feedback is turned on, AGN activity is fueled by a more rapid growth of the central BH engine, and thus has a more dramatic impact on the ICM and the baryon content of galaxies. Indeed as the gas concentrates in structures earlier, larger BH accreting at a higher rate can push the gas further away from the centers of less massive halos, resulting in less concentrated gas and stellar profiles in the final galaxy cluster at low redshift. Since the gas density decreases, and entropy scales as , larger entropy floors are logically present in the core of metal rich galaxy clusters. These effects systematically lead to the formation of non-cool core clusters regardless of how AGN feedback was implemented in the simulations, which is in obvious contradiction with the observed cool core / non-cool core dichotomy.
There are several outstanding issues which need to be addressed in more detail with follow up work. First we need to extend our study to both lower-mass galaxy groups and the most-massive superclusters to verify that our conjecture regarding the different impact of early AGN pre-heating on groups and clusters holds. At the same time, large number statistics are mandatory to support our view that the two types of entropy profiles (cool and non-cool cores) are simply linked to different evolutionary stages of cluster assembly histories. It also remains to be shown that we can retrieve this result when metals are included in the simulations. Finally, the metallicities of both the simulated ICM and central massive galaxy under-estimate observations so far. It will therefore be important to quantify how resolution, stellar winds and type Ia SNe alter metallicity profiles, cooling times, and, thus, the gas properties of the ICM. The effect of X-ray photo-ionisation of ion species which act as coolants of the proto-cluster intra-halo gas must also be explored as it is possible that it will offset the large amount of extra metal cooling. In summary, we find that the cooling core structure is extremely sensitive both to the physics and the AGN feedback modelling, and consequently requires a more careful investigation.
Acknowledgment
We would like to thank the anonymous referee for his very constructive report that helped us to improve the quality of this paper. We thank Andrei Kravtsov and Arif Babul for useful discussions. We thank Francesco Vazza and Steen Hansen for their comments. We also thank Alastair Sanderson for providing his observational data points. YD is supported by an STFC Postdoctoral Fellowship. The simulations presented here were run on the TITANE cluster at the Centre de Calcul Recherche et Technologie of CEA Saclay on allocated resources from the GENCI grant c2009046197, and on the DiRAC facility jointly funded by STFC, the Large Facilities Capital Fund of BIS and the University of Oxford. This research is part of the Horizon-UK project. JD and AS’ research is supported by Adrian Beecroft, the Oxford Martin School and STFC.
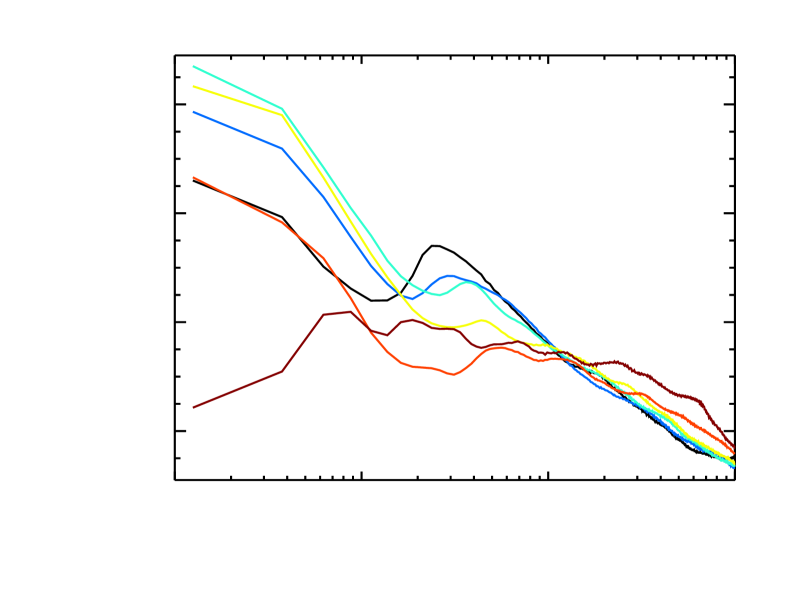
Appendix A Volume-weighted versus X-ray-weighted profiles


A commonly adopted way to measure ICM gas properties is to weight them by their X-ray emission (). Indeed, as observations of ICM gas are often done in X-ray (although the Sunyaev-Zeldovich (SZ) effect can also be a good probe of the gas temperature, density, etc., Kay et al., 2008; Prokhorov et al., 2010), it seems natural for one to mass-weight or emission-weight one-dimensional gas profiles when comparing simulations with real data. However, the problem with such weightings is that strong density contrasts will mask the contribution of diffuse gas. This typically happens when a cold, gaseous galactic disc is present in the centre of a galaxy cluster. The central parts of the profiles are dominated by the ISM emission because of its large density, and so the temperature will shift towards the peak of radiative cooling around - K. One solution often used is to excise this ISM dominated emission by removing all gas elements colder than some temperature ( keV), which corresponds to the lower temperature limit of X-ray instruments (Rosat, Chandra, XMM-Newton). Another form of weighting which might provide a better comparison to observations is spectroscopic-like weighting (Mazzotta et al., 2004). In this appendix, we discuss why none of these prescriptions is entirely satisfactory.
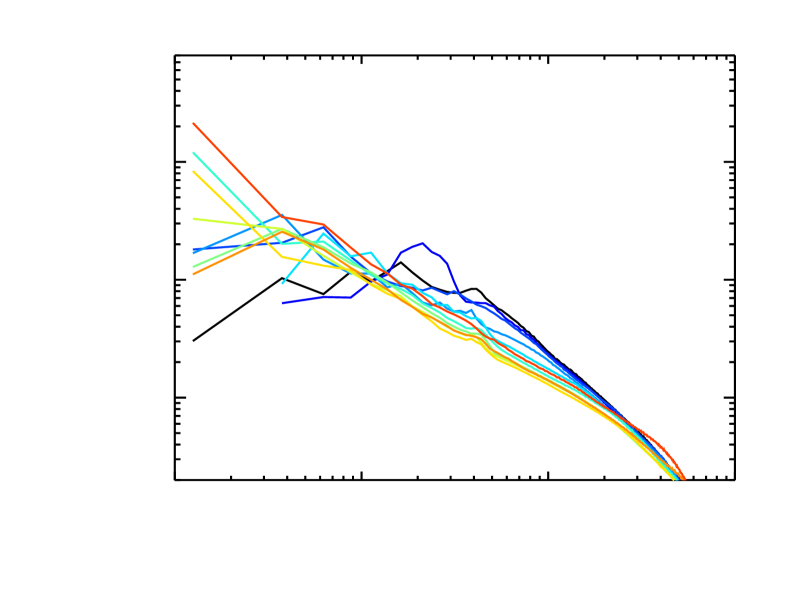
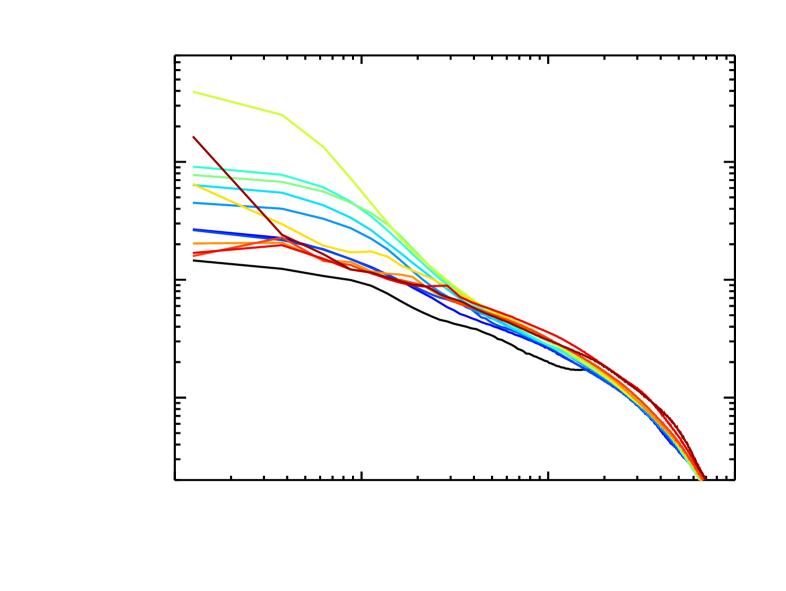
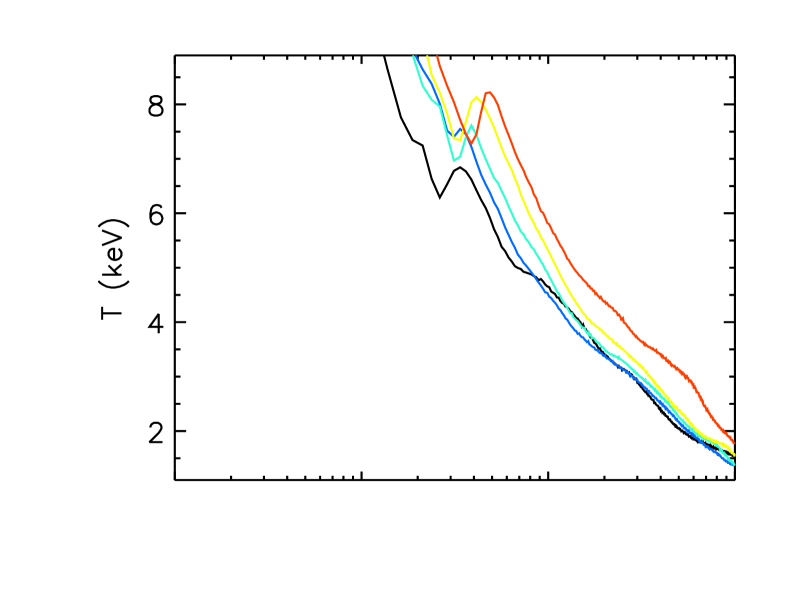
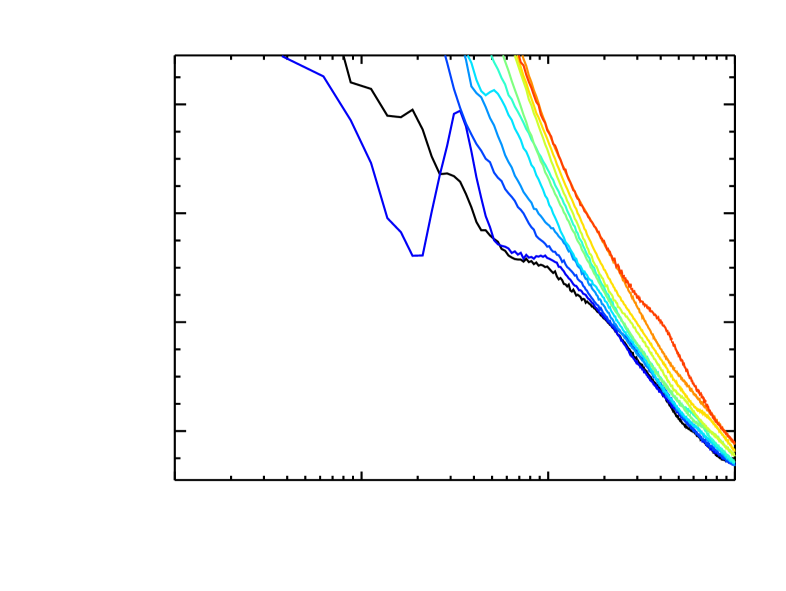
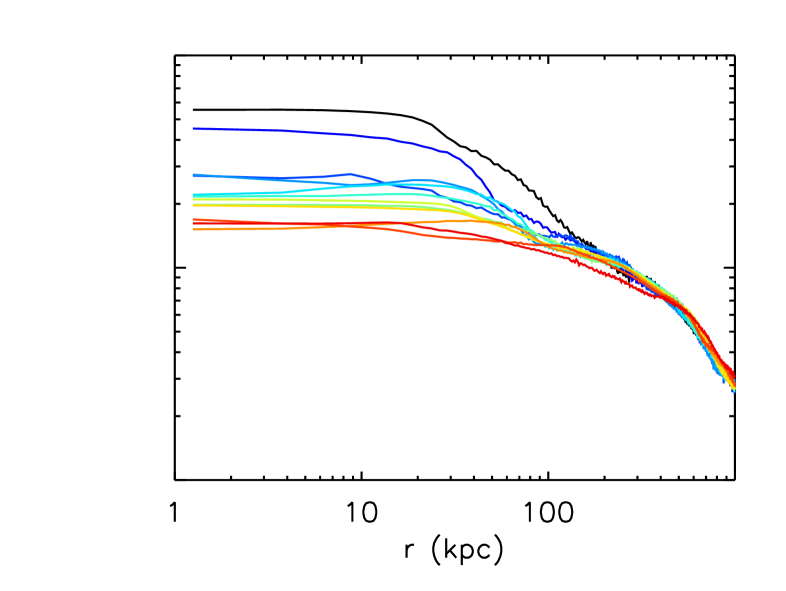
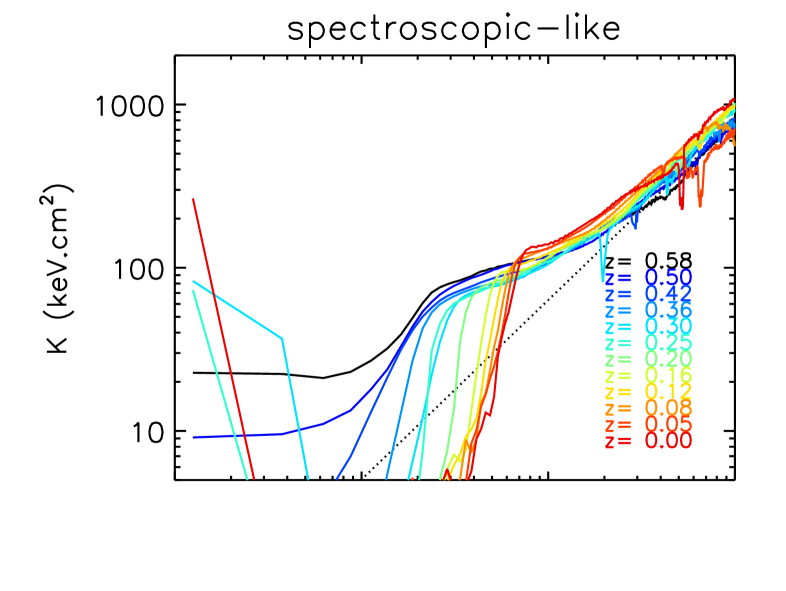
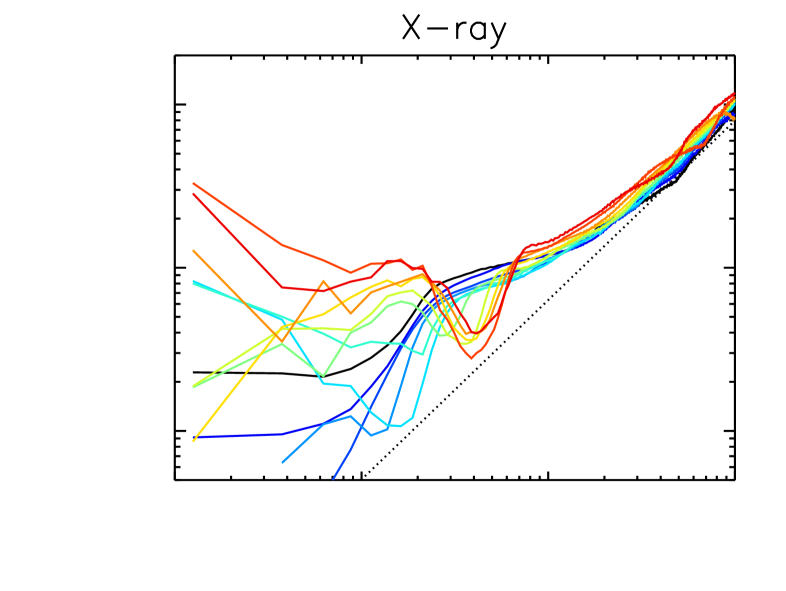
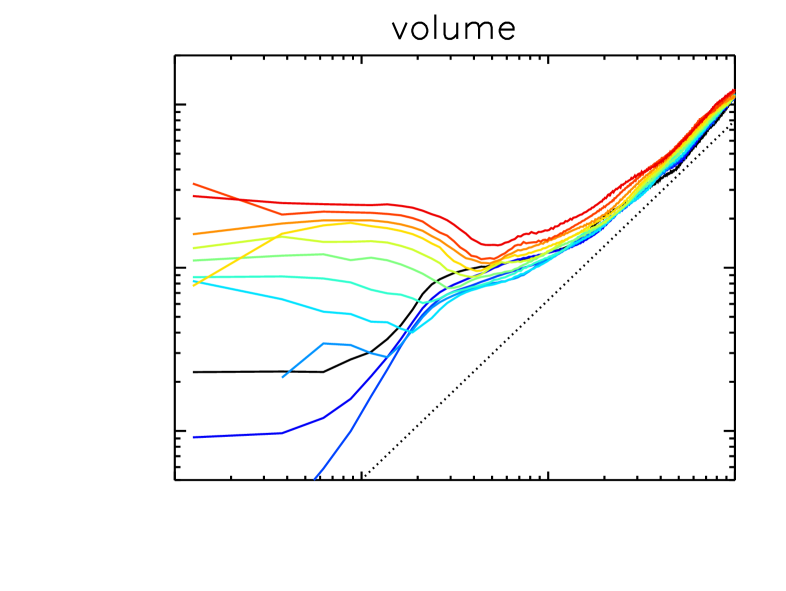
In fig. 13, we compare spectroscopic-like weighting (first column), X-ray weighting (second column) and volume weighting (third column) of entropy, gas density, and temperature profiles for the AGNOFFrun. The cluster in this simulation does not harbour any cold ISM component at (recall it is restarted from the output of AGNJETrun), and then very quickly develops a cold and massive galactic disc in the centre (see section 3.5 for details). The first thing to note is that the slopes and the levels of entropy, density, and temperature, are very insensitive to the weighting method sufficiently far away from the centre ( kpc), independent of redshift. Furthermore, when no cold gas disc is present (e.g. at , , and ) there exist no significant difference between the different weighting methods all the way to the centre of the cluster.
It is only when the cold ISM has built up significantly that the profiles start to differ strongly. Even when cold gas cells (defined as cells with temperature or keV) are excluded from the analysis, X-ray and spectroscopic-like profiles are dominated by the disc component. The reason for this is that even though most of the cold gas in galaxies is at very low temperatures ( keV), the gas at the interface between the disc and the ICM lies close to a very strong discontinuity, and as such is extremely sensitive to any kind (numerical or physical) of diffusion process that mixes the two phases together, especially because it is extremely difficult to resolve the cooling length () . This disc ‘skin’ is extremely difficult to peel from the profiles except by applying a prohibitive density/temperature cut-off. In addition to these ’skins’, large galactic discs also sport a flaring component at large radii, which is dense (), hot ( keV ), and low entropy ( keV.cm2). As X-ray emission is proportional to , this means that even when suppressing cold gas cells ( keV), profiles will still be dominated by the disc tail component. The characteristic signature of such a disk tail is apparent in the X-ray weighted profiles of fig. 13 (middle column) with cells below a temperature of keV removed. At 40 kpc from the centre, a dip is visible in both the entropy and temperature profiles, and a bump shows up in the density profiles. In contrast, volume-weighting the profiles, allows us to mostly probe the volume filling ICM without being strongly affected by the disc component of the central galaxy. For this reason, we adopted volume-weighted quantities throughout this paper.
References
- Agertz et al. (2007) Agertz O., Moore B., Stadel J., Potter D., Miniati F., Read J., Mayer L., Gawryszczak A., Kravtsov A., Nordlund Å., Pearce F., Quilis V., Rudd D., Springel V., Stone J., Tasker E., Teyssier R., Wadsley J., Walder R., 2007, MNRAS, 380, 963
- Babul et al. (2002) Babul A., Balogh M. L., Lewis G. F., Poole G. B., 2002, MNRAS, 330, 329
- Bate et al. (1995) Bate M. R., Bonnell I. A., Price N. M., 1995, MNRAS, 277, 362
- Binney & Tabor (1995) Binney J., Tabor G., 1995, MNRAS, 276, 663
- Blumenthal et al. (1986) Blumenthal G. R., Faber S. M., Flores R., Primack J. R., 1986, ApJ, 301, 27
- Booth & Schaye (2009) Booth C. M., Schaye J., 2009, MNRAS, 398, 53
- Borgani et al. (2005) Borgani S., Finoguenov A., Kay S. T., Ponman T. J., Springel V., Tozzi P., Voit G. M., 2005, MNRAS, 361, 233
- Borgani et al. (2002) Borgani S., Governato F., Wadsley J., Menci N., Tozzi P., Quinn T., Stadel J., Lake G., 2002, MNRAS, 336, 409
- Bryan (2000) Bryan G. L., 2000, ApJ, 544, L1
- Cantalupo (2010) Cantalupo S., 2010, MNRAS, 403, L16
- Casuso et al. (1996) Casuso E., Vazdekis A., Peletier R. F., Beckman J. E., 1996, ApJ, 458, 533
- Cavagnolo et al. (2009) Cavagnolo K. W., Donahue M., Voit G. M., Sun M., 2009, ApJS, 182, 12
- Dolag et al. (2005) Dolag K., Vazza F., Brunetti G., Tormen G., 2005, MNRAS, 364, 753
- Donahue et al. (2006) Donahue M., Horner D. J., Cavagnolo K. W., Voit G. M., 2006, ApJ, 643, 730
- Dubois et al. (2010) Dubois Y., Devriendt J., Slyz A., Teyssier R., 2010, MNRAS, 409, 985
- Dubois & Teyssier (2008) Dubois Y., Teyssier R., 2008, A&A, 477, 79
- Ettori et al. (2004) Ettori S., Borgani S., Moscardini L., Murante G., Tozzi P., Diaferio A., Dolag K., Springel V., Tormen G., Tornatore L., 2004, MNRAS, 354, 111
- Evrard & Henry (1991) Evrard A. E., Henry J. P., 1991, ApJ, 383, 95
- Fabian & Daines (1991) Fabian A. C., Daines S. J., 1991, MNRAS, 252, 17P
- Fabjan et al. (2010) Fabjan D., Borgani S., Tornatore L., Saro A., Murante G., Dolag K., 2010, MNRAS, 401, 1670
- Gnedin et al. (2004) Gnedin O. Y., Kravtsov A. V., Klypin A. A., Nagai D., 2004, ApJ, 616, 16
- Haardt & Madau (1996) Haardt F., Madau P., 1996, ApJ, 461, 20
- Hansen et al. (2011) Hansen S. H., Macció A. V., Romano-Diaz E., Hoffman Y., Brüggen M., Scannapieco E., Stinson G. S., 2011, ApJ, 734, 62
- Häring & Rix (2004) Häring N., Rix H.-W., 2004, ApJ, 604, L89
- Kaiser (1991) Kaiser N., 1991, ApJ, 383, 104
- Kay et al. (2008) Kay S. T., Powell L. C., Liddle A. R., Thomas P. A., 2008, MNRAS, 386, 2110
- Kennicutt (1998) Kennicutt Jr. R. C., 1998, ApJ, 498, 541
- Khalatyan et al. (2008) Khalatyan A., Cattaneo A., Schramm M., Gottlöber S., Steinmetz M., Wisotzki L., 2008, MNRAS, 387, 13
- Kravtsov et al. (2005) Kravtsov A. V., Nagai D., Vikhlinin A. A., 2005, ApJ, 625, 588
- Krumholz et al. (2004) Krumholz M. R., McKee C. F., Klein R. I., 2004, ApJ, 611, 399
- Krumholz & Tan (2007) Krumholz M. R., Tan J. C., 2007, ApJ, 654, 304
- Lewis et al. (2000) Lewis G. F., Babul A., Katz N., Quinn T., Hernquist L., Weinberg D. H., 2000, ApJ, 536, 623
- Lloyd-Davies et al. (2000) Lloyd-Davies E. J., Ponman T. J., Cannon D. B., 2000, MNRAS, 315, 689
- Mazzotta et al. (2004) Mazzotta P., Rasia E., Moscardini L., Tormen G., 2004, MNRAS, 354, 10
- McCarthy et al. (2011) McCarthy I. G., Schaye J., Bower R. G., Ponman T. J., Booth C. M., Dalla Vecchia C., Springel V., 2011, MNRAS, pp 35–+
- McCarthy et al. (2010) McCarthy I. G., Schaye J., Ponman T. J., Bower R. G., Booth C. M., Dalla Vecchia C., Crain R. A., Springel V., Theuns T., Wiersma R. P. C., 2010, MNRAS, 406, 822
- Mitchell et al. (2009) Mitchell N. L., McCarthy I. G., Bower R. G., Theuns T., Crain R. A., 2009, MNRAS, 395, 180
- Morandi & Ettori (2007) Morandi A., Ettori S., 2007, MNRAS, 380, 1521
- Nagai et al. (2007) Nagai D., Kravtsov A. V., Vikhlinin A., 2007, ApJ, 668, 1
- Navarro & White (1993) Navarro J. F., White S. D. M., 1993, MNRAS, 265, 271
- Omma et al. (2004) Omma H., Binney J., Bryan G., Slyz A., 2004, MNRAS, 348, 1105
- Pearce et al. (2000) Pearce F. R., Thomas P. A., Couchman H. M. P., Edge A. C., 2000, MNRAS, 317, 1029
- Piffaretti et al. (2005) Piffaretti R., Jetzer P., Kaastra J. S., Tamura T., 2005, A&A, 433, 101
- Powell et al. (2011) Powell L. C., Slyz A., Devriendt J., 2011, MNRAS, pp 660–+
- Pratt et al. (2010) Pratt G. W., Arnaud M., Piffaretti R., Böhringer H., Ponman T. J., Croston J. H., Voit G. M., Borgani S., Bower R. G., 2010, A&A, 511, A85+
- Pratt et al. (2007) Pratt G. W., Böhringer H., Croston J. H., Arnaud M., Borgani S., Finoguenov A., Temple R. F., 2007, A&A, 461, 71
- Prokhorov et al. (2010) Prokhorov D. A., Dubois Y., Nagataki S., 2010, A&A, 524, A89+
- Puchwein et al. (2008) Puchwein E., Sijacki D., Springel V., 2008, ApJ, 687, L53
- Rasera & Chandran (2008) Rasera Y., Chandran B., 2008, ApJ, 685, 105
- Rasera & Teyssier (2006) Rasera Y., Teyssier R., 2006, A&A, 445, 1
- Rephaeli & Silk (1995) Rephaeli Y., Silk J., 1995, ApJ, 442, 91
- Rossetti & Molendi (2010) Rossetti M., Molendi S., 2010, A&A, 510, A83+
- Sanderson et al. (2009) Sanderson A. J. R., Edge A. C., Smith G. P., 2009, MNRAS, 398, 1698
- Sanderson et al. (2009) Sanderson A. J. R., O’Sullivan E., Ponman T. J., 2009, MNRAS, 395, 764
- Sanderson et al. (2006) Sanderson A. J. R., Ponman T. J., O’Sullivan E., 2006, MNRAS, 372, 1496
- Shakura & Sunyaev (1973) Shakura N. I., Sunyaev R. A., 1973, A&A, 24, 337
- Sijacki & Springel (2006) Sijacki D., Springel V., 2006, MNRAS, 366, 397
- Sijacki et al. (2007) Sijacki D., Springel V., di Matteo T., Hernquist L., 2007, MNRAS, 380, 877
- Silk (1977) Silk J., 1977, ApJ, 211, 638
- Spergel et al. (2003) Spergel D. N., Verde L., Peiris H. V., Komatsu E., Nolta M. R., Bennett C. L., Halpern M., Hinshaw G., Jarosik N., Kogut A., Limon M., Meyer S. S., Page L., Tucker G. S., Weiland J. L., Wollack E., Wright E. L., 2003, ApJS, 148, 175
- Springel & Hernquist (2003) Springel V., Hernquist L., 2003, MNRAS, 339, 289
- Suginohara & Ostriker (1998) Suginohara T., Ostriker J. P., 1998, ApJ, 507, 16
- Sutherland & Dopita (1993) Sutherland R. S., Dopita M. A., 1993, ApJS, 88, 253
- Teyssier (2002) Teyssier R., 2002, A&A, 385, 337
- Teyssier et al. (2011) Teyssier R., Moore B., Martizzi D., Dubois Y., Mayer L., 2011, MNRAS, 414, 195
- Tozzi & Norman (2001) Tozzi P., Norman C., 2001, ApJ, 546, 63
- Tremaine et al. (2002) Tremaine S., Gebhardt K., Bender R., Bower G., Dressler A., Faber S. M., Filippenko A. V., Green R., Grillmair C., Ho L. C., Kormendy J., Lauer T. R., Magorrian J., Pinkney J., Richstone D., 2002, ApJ, 574, 740
- Truelove et al. (1997) Truelove J. K., Klein R. I., McKee C. F., Holliman II J. H., Howell L. H., Greenough J. A., 1997, ApJ, 489, L179+
- Tweed et al. (2009) Tweed D., Devriendt J., Blaizot J., Colombi S., Slyz A., 2009, A&A, 506, 647
- Vazza (2011) Vazza F., 2011, MNRAS, 410, 461
- Vazza et al. (2010) Vazza F., Brunetti G., Gheller C., Brunino R., Brüggen M., 2010, ArXiv e-prints
- Vikhlinin et al. (2006) Vikhlinin A., Kravtsov A., Forman W., Jones C., Markevitch M., Murray S. S., Van Speybroeck L., 2006, ApJ, 640, 691
- Voigt & Fabian (2004) Voigt L. M., Fabian A. C., 2004, MNRAS, 347, 1130
- Voit & Bryan (2001) Voit G. M., Bryan G. L., 2001, Nature, 414, 425
- Voit et al. (2005) Voit G. M., Kay S. T., Bryan G. L., 2005, MNRAS, 364, 909
- ZuHone et al. (2010) ZuHone J. A., Markevitch M., Johnson R. E., 2010, ApJ, 717, 908