Large Miscibility Gap in the Ba(MnxFe1-x)2As2 System
Abstract
The compounds BaMn2As2 and BaFe2As2 both crystallize in the body-centered-tetragonal ThCr2Si2-type (122-type) structure at room temperature but exhibit quite different unit cell volumes and very different magnetic and electronic transport properties. Evidently reflecting these disparities, we have discovered a large miscibility gap in the system Ba(MnxFe1-x)2As2. Rietveld refinements of powder x-ray diffraction (XRD) measurements on samples slow-cooled from 1000 ∘C to room temperature (RT) reveal a two-phase mixture of BaMn2As2 and phases together with impurity phases for , 0.4, 0.5, 0.6 and 0.8. We infer that there exists a miscibility gap in this system at 300 K with composition limits . For samples quenched from 1000 ∘C to 77 K, the refinements of RT XRD data indicate that the miscibility gap at RT narrows at 1000 ∘C to . Samples with , 0.5 and 0.6 quenched from 1100–1400 ∘C to 77 K contain a single 122-type phase together with significant amounts of Fe1-xMnxAs and FeAs2 impurity phases. These results indicate that the system is not a pseudo-binary system over the whole composition range and that the 122-type phase has a significant homogeneity range at these temperatures. Magnetic susceptibility , electrical resistivity and heat capacity measurements versus temperature of the single-phase quenched polycrystalline samples with and 0.8 are reported. We also report attempts to grow single crystals of the substituted compounds Ba(Mn)2As2 ( = Cr, Fe, Co, Ni, Cu, Ru, Rh, Pd, Re, Pt) and BaMn2(As1-xSbx)2 out of Sn flux. Energy dispersive x-ray analyses show that most of these elements do not substitute into the lattice in amounts greater than 0.5%. However, concentrations of 4.4%, % and 2.6% were achieved for Cr, Fe and Sb substitutions, respectively, and and data for these crystals are presented.
pacs:
74.70.Xa, 64.75.Nx, 75.40.Cx, 75.50.EeI INTRODUCTION
The discoveryKamihara1 of superconductivity at 26 K in LaFeAsO1-xFx with the tetragonal ZrCuSiAs-type structure in 2008 motivated many efforts to understand the superconducting pairing mechanism and to discover additional families of Fe-based superconductors. Johnston2010 New parent compounds Fe2As2 ( = Ba, Sr and Ca) that crystallize in the related tetragonal ThCr2Si2-type (122-type) structure, together with other families, were soon discovered.Johnston2010 Among 122-type materials, BaFe2As2 has gained much attention as a parent compound because superconductivity can be induced in this material by various means, i.e., by applying pressure Yamazaki1 ; Ishikawa1 ; Colombier1 and by substitutions at the Ba site (by K)Rotter1 , at the Fe site (by Co, Ni, Ru, Rh, and Pd),Johnston2010 ; Canfield2010 and at the As site (by P).Jiang1 An interesting result is that while electron doping by Co, Ni, Rh and Pd at the Fe site in BaFe2As2 induces superconductivity, hole doping by Cr and Mn for Fe does not.Sefat1 ; Liu2010 ; Budko1 ; Kim2010b
The reported experimental results and electronic structure calculations demonstrate that the physical properties of BaCr2As2 and BaMn2As2 are significantly different from those of BaFe2As2. DJSingh1 ; An1 ; YSingh1 ; YSingh2 In particular, the unit cell volume of BaMn2As2 (234.12 Å3) is much larger than that of BaFe2As2 (204.38 Å3),Johnston2010 in spite of the fact that Mn and Fe are 3 transition-metal neighbors in the Periodic Table. This divergence suggests that the Mn+2 is in a high-spin state while, in a local moment model, Fe+2 is in a low-spin state. is an antiferromagnetic insulator with a large ordered moment of /Mn and a high Néel temperature K (Ref. YSingh2, ) whereas BaFe2As2 is an itinerant antiferromagnet with a much lower ordered moment of /Fe and a much lower K.Johnston2010 In addition, the antiferromagnetic structure of BaMn2As2 is Néel-type (G-type or checkerboard-type) with the ordered moments aligned along the tetragonal axis,YSingh2 whereas that of BaFe2As2 is a type of antiferromagnetic stripe structure with the ordered moments aligned in the plane.Johnston2010
There have been a number of investigations of iron-arsenide compounds in which the Fe is partially substituted by Mn.Kim2010b ; Cheng2010 ; Kim2010a ; Kim2010c ; Kasinathan2009 ; Liu2010 ; Berardan2009 ; Huang2010 For -type materials, a maximum of and Fe substitution by Mn was reported for (Ref. Kim2010b, ) and (Ref. Kim2010a, ), respectively. Although the Mn doping leads to suppression of the magnetic and structural transitions to lower temperatures, the reported results suggest that doping with Mn is detrimental to the occurrence of superconductivity and in most cases it leads to a magnetic and more resistive ground state.Cheng2010 ; Kim2010a ; Kim2010b ; Kim2010c ; Kasinathan2009 ; Liu2010 ; Berardan2009 It has been reported that in hole-doped systems, besides the changes in the electronic structure introduced by the dopant, the resultant variation of the Fe-As bond length plays a crucial role in defining the nature of the ground state.Kim2010a ; Kasinathan2009 The variation of Fe-As bond length for K- and Mn-doped is significantly different.Kim2010a In none of these studies of (MnxFe1-x)2As2 systems was the possible existence of a miscibility gap in the phase diagram mentioned.
The peculiar properties of suggest that this compound may be a bridge between the BaFe2As2-type materials and the more ionic high- cuprates.YSingh1 ; YSingh2 This in turn suggests that if could be doped into the metallic state, the resulting compounds might have interesting superconducting properties. This possibility motivated our attempts to grow single crystals of substituted , as will be discussed. However, we found that the attempted substitutions usually failed to achieve concentrations above 0.5%. In the case of Fe substitutions for Mn, the single crystals contained a maximum of % Fe substituted for Mn. It was not clear to us whether such limits arose from peculiarities of the crystal growths, or were intrinsic to the equilibrium phase diagrams. To investigate this question, we chose to study Ba(MnxFe1-x)2As2 in more detail as a prototype system using polycrystalline samples. We discovered a wide miscibility gap in this system in slow-cooled samples, which only narrows slightly for samples quenched from 1000 ∘C to 77 K. Magnetic susceptibility , electrical resistivity and heat capacity versus temperature data for single-phase polycrystalline and samples quenched from 1000 ∘C will be reported. We also present and/or data for several of the above-mentioned lightly-doped crystals.
The remainder of the paper is organized as follows. The experimental details are given in Sec. II. The phase analyses and structures of polycrystalline and single crystal samples with nominal composition Ba(MnxFe1-x)2As2, which establish the miscibility gap, are given in Sec. III. The physical properties of the single-phase polycrystalline and samples quenched from 1000 ∘C are presented in Sec IV. Our and data for substituted single crystals of are presented in Sec. V. A summary of this work and our conclusions are given in Sec. VI.
II EXPERIMENTAL DETAILS
Polycrystalline samples of Ba(MnxFe1-x)2As2 (, 0.4, 0.5, 0.6 and 0.8) were synthesized by solid state reaction using Ba (99.99%) from Sigma-Aldrich, and Fe (99.998%), Mn (99.95%) and As (99.99999%) from Alfa-Aesar. Stoichiometric mixtures of the elements were pelletized and placed in alumina crucibles that were sealed inside evacuated silica tubes. The samples were heated to 585 ∘C at a rate of 40 ∘C/h, held there for 20 h, then heated to 620 ∘C at a rate of 7 ∘C/h, held there for 20 h, and finally heated to 750 ∘C at 30 ∘C/h and held there for 25 h. The samples were then thoroughly ground, pelletized and again sealed in evacuated silica tubes. The samples were fired at 750 ∘C and then at 1000 ∘C for 20 h and 80 h, respectively, followed by furnace-cooling (“slow-cooling”). For quenching experiments, pressed pellets were wrapped in Ta foil and sealed in silica tubes containing atm of Ar. The tubes were then heated to temperatures ranging from 1000 to 1400 ∘C for 2–20 h and then quenched into liquid nitrogen at 77 K. There was no evidence that the samples reacted with either the Ta foils or the silica tubes during these quenching experiments.
Structural characterization of the polycrystalline samples was performed using powder x-ray diffraction (XRD) data obtained from a Rigaku Geigerflex powder diffractometer and CuKα radiation. The FullProf package was used for Rietveld refinement of the XRD data.Carvajal1
Attempts to grow single crystals of Ba(Mn)2As2 ( = Cr, Fe, Co, Ni, Cu, Ru, Rh, Pd, Re and Pt) and BaMn2(As1-xSbx)2 were made using Sn flux. To begin, polycrystalline samples of Ba(Mn)2As2 or BaMn2(As1-xSbx)2 were synthesized using the method described above and then mg of a sample was placed in an alumina crucible together with Sn, using a sample to Sn molar ratio of . The top of the crucible was packed with quartz wool. The alumina crucible was sealed inside a silica tube under a pressure of 1/3 atm Ar. The sample was heated to 1100 ∘C at a rate of 40 ∘C/h, held there for 40 h, and then cooled to either 700 ∘C or 900 ∘C at a rate of 4 ∘C/h. At the respective temperature the Sn flux was decanted using a centrifuge. The typical size of the shiny plate-like crystals obtained was mm3.
| Substitutions | Site | Amount(%) | Sn-content (%) |
|---|---|---|---|
| Cr | Mn-site | ||
| Fe | Mn-site | ||
| Fe* | Mn-site | ||
| Co | Mn-site | ||
| Ni | Mn-site | “0” | |
| Cu | Mn-site | ||
| Ru | Mn-site | “0” | |
| Rh | Mn-site | “0” | |
| Pd | Mn-site | “0” | |
| Re | Mn-site | “0” | |
| Pt | Mn-site | “0” | |
| Sb | As-site |
The chemical compositions of the crystals grown in Sn flux were measured by energy dispersive x-ray (EDX) analysis using a JEOL scanning electron microscope. The EDX results showed that most growth attempts resulted in substitutions of less than 0.5% except for the cases of Cr, Fe and Sb where 4.4%, and 2.6% substitutions were obtained, respectively, as shown in Table 1. A more detailed study of the compositions of Fe-substituted crystals is given in Sec. III.3.
An interesting result is that in contrast to the case of BaFe2As2 crystals grown in Sn flux where up to 2–3 at% of Sn with respect to Fe becomes incorporated into the crystalsNi2008 that drastically modifies their physical properties,Baek2008 ; Wang2009 ; Su2009 Sn enters the crystal lattice of pure or lightly substituted BaMn2As2 in much smaller amounts (see Table 1). Consistent with this result, our lightly Cr-, Fe- and Sb-substituted crystals were found to have magnetic properties very similar to those of pure BaMn2As2, as will be shown in Sec. V.
Field- and temperature-dependent magnetization measurements were carried out using a superconducting quantum interference device magnetometer (Quantum Design, Inc.). Heat capacity measurements were done using a thermal relaxation technique with a Quantum Design physical property measurement system (PPMS).
Electrical resistivity measurements were carried out using a four-probe ac method in the PPMS. Contacts of the 0.05 mm diameter Pt electrical leads to the samples were made using silver epoxy for the polycrystalline samples and solder for the crystals. The measurement current amplitude and frequency were 1 mA and 38 Hz for the polycrystalline samples, and 0.01 mA and 38 Hz and 18 Hz for the Fe- and Cr-doped crystals, respectively. The room-temperature contact resistances were 4–5 for the quenched polycrystalline and samples and 0.1 and 1 k for the Cr- and Fe-doped crystals, respectively. The validity of the resistivity data was verified by examining the voltage waveform at representative temperatures for each sample.
III Miscibility Gap in the Ba(MnxFeAs2 System
| Compound | SC or Q | ||||||
|---|---|---|---|---|---|---|---|
| (Å) | (Å) | (Å3) | (Å) | (deg) | |||
| Q (1000 ) | 4.0014(1) | 13.1195(5) | 210.06(1) | 0.3566(1) | 2.441(2) | 110.1(1) | |
| SC (Phase-1) | 4.169(1) | 13.432(8) | 233.4(2) | 0.358(1) | 2.54(2) | 110(1) | |
| SC (Phase-2) | 3.9676(3) | 13.071(1) | 205.76(3) | 0.3550(2) | 2.412(3) | 110.7(2) | |
| Q (1100 ) | 4.0565(4) | 13.245(2) | 217.95(5) | 0.3577(2) | 2.480(4) | 109.8(2) | |
| SC (Phase-1) | 4.1716(3) | 13.481(1) | 234.60(3) | 0.3619(3) | 2.574(5) | 108.3(3) | |
| SC (Phase-2) | 3.9837(2) | 13.0770(7) | 207.53(2) | 0.3562(2) | 2.428(2) | 110.2(2) | |
| Q (1400 ) | 4.1135(5) | 13.340(2) | 225.74(5) | 0.3599(2) | 2.526(4) | 109.0(2) | |
| SC (Phase-1) | 4.1659(2) | 13.4679(7) | 233.74(2) | 0.3614(2) | 2.567(3) | 108.5(2) | |
| SC (Phase-2) | 3.9744(2) | 13.0605(7) | 206.30(2) | 0.3554(1) | 2.417(2) | 110.6(1) | |
| Q (1250 ) | 4.099(1) | 13.313(4) | 223.7(1) | 0.3584(3) | 2.507(6) | 109.7(3) | |
| SC (Phase-1) | 4.1719(3) | 13.484(1) | 234.68(3) | 0.3620(2) | 2.575(4) | 108.2(2) | |
| SC (Phase-2) | 3.9863(3) | 13.073(1) | 207.74(3) | 0.3555(3) | 2.424(5) | 110.6(3) | |
| Q (1000 ) | 4.1368(3) | 13.388(1) | 229.11(3) | 0.3615(1) | 2.551(2) | 108.4(1) | |
| SC (Phase-1) | 4.1697(3) | 13.4714(9) | 234.22(3) | 0.3626(2) | 2.578(4) | 107.9(2) | |
| SC (Phase-2) | 3.9880(5) | 13.043(3) | 207.43(6) | 0.3567(5) | 2.432(8) | 110.2(5) |
III.1 Slow-Cooled Polycrystalline Samples
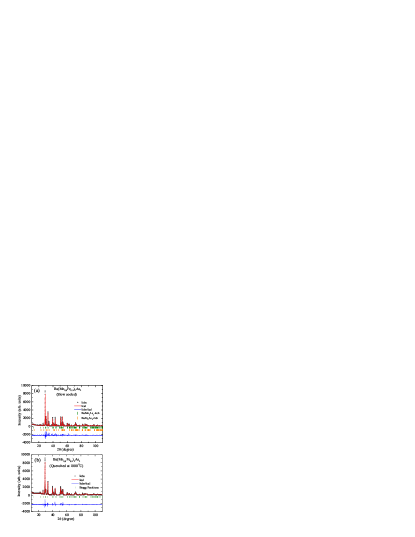
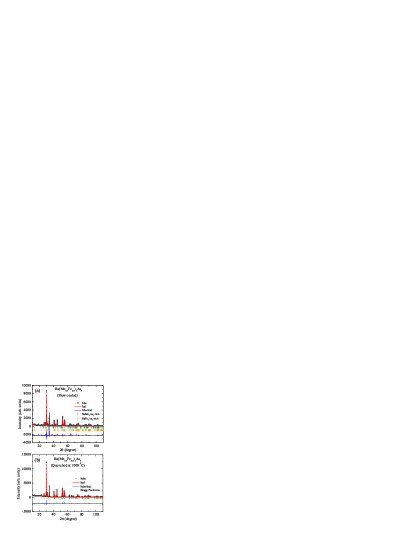
A room-temperature XRD pattern of a slow-cooled sample of Ba(Mn0.8Fe0.2)2As2 is shown in Fig. 1(a). The XRD data for the sample indicate that the sample contains a significant amount of impurities, mainly Fe1-xMnxAs. We refined the XRD data using a two-phase (BaMn2As2-rich and BaFe2As2-rich phases) Rietveld refinement but did not include the impurity phases in the refinement. For each 122-type phase, the data were refined in the body-centered-tetragonal space group 4/ using the atomic positions of the ThCr2Si2-type structure.Johnston2010 Figure 1(a) shows the Rietveld fit, the difference profile between the data and fit, and the fitted line positions. The room temperature powder XRD pattern of the slow-cooled sample of Ba(Mn0.2Fe0.8)2As2 is shown in Fig. 2(a). Similar to the case of Ba(Mn0.8Fe0.2)2As2 in Fig. 1(a), the slow-cooled sample of Ba(Mn0.2Fe0.8)2As2 contains a significant amount of impurities. A two-phase Rietveld refinement of the data was carried out in the same way as for Ba(Mn0.8Fe0.2)2As2 to obtain the unit cell parameters and the volumes and percentage molar fractions of BaMn2As2-rich and BaFe2As2-rich phases. This fit is shown in Fig. 2(a).
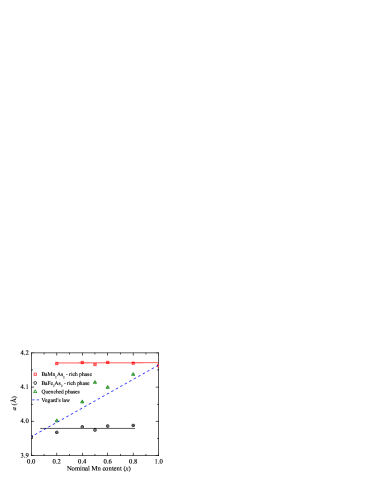
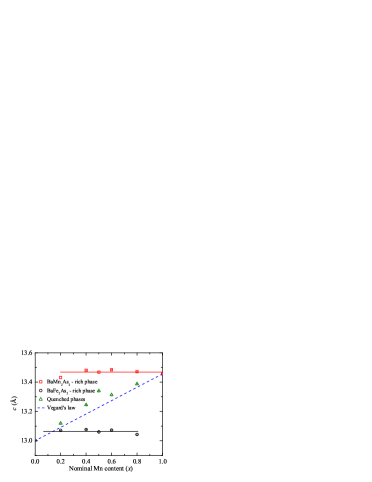
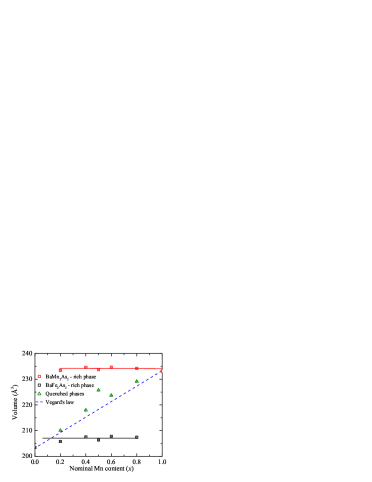
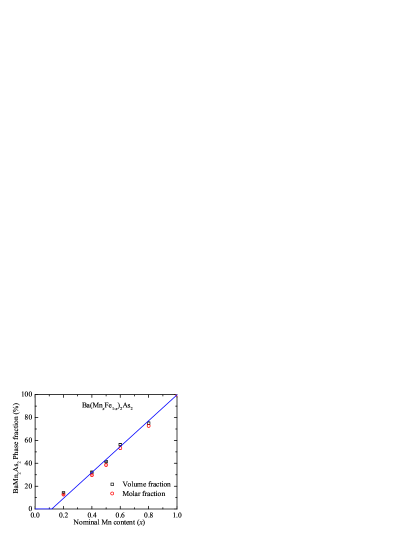
Similar to the above cases of Ba(Mn0.8Fe0.2)2As2 and Ba(Mn0.2Fe0.8)2As2, the slow-cooled samples of Ba(Mn1-xFex)2As2 (x = 0.4, 0.5 and 0.6) also contain phase-separated mixtures of the Fe-rich and Mn-rich 122-type phases together with impurity phases. We carried out similar two-phase Rietveld refinements of the XRD patterns of these samples for the Mn-rich and Fe-rich 122-type phases. The and lattice parameters and the unit cell volumes of the BaMn2As2-rich and BaFe2As2-rich phases in Ba(MnxFe1-x)2As2 are listed in Table 2 and plotted versus nominal Mn content for all five samples in Fig. 3, together with dataJohnston2010 for and from the literature. The corresponding volume and molar fraction of the BaMn2As2-rich phase in the samples are plotted versus nominal Mn concentration in Fig. 4. Since impurity phases were not accounted for in the refinements, the values of the molar fraction in Fig. 4 represent the relative fractions of the BaMn2As2-rich and BaFe2As2-rich phases.
Considering Vegard’s law shown in Fig. 3 and the straight-line fit to the data in Fig. 4, the data in these two figures consistently indicate that a miscibility gap occurs in the Ba(MnxFe1-x)2As2 system at 300 K (for the slow-cooled samples) that has the composition range . That is, about 12% of Mn can be substituted for Fe in BaFe2As2 but almost no Fe can be substituted for Mn in BaMn2As2. In the following section we investigate whether the miscibility gap boundaries are temperature-dependent.
III.2 Quenched Polycrystalline Samples
The Rietveld refinement of the powder XRD data for a Ba(Mn0.8Fe0.2)2As2 sample quenched from 1000 ∘C to 77 K, shown in Fig. 1(b), indicates that the sample is a single phase, with no evidence of phase separation of different compositions of 122-type phases or of impurity phases. The unit cell volume calculated from the lattice parameters is 229.11(3) Å3, which is 2.19% smaller than that of pure BaMn2As2. Similarly, Rietveld refinement of a quenched Ba(Mn0.2Fe0.8)2As2 sample shown in Fig. 2(b) exhibits an excellent fit to the data for a single 122-type phase with no evidence for any impuritiy phases. The volume of the unit cell is 210.06(1) Å3, which is larger than that of pure BaFe2As2, as expected for a single-phase sample. These observations and those above in Sec. III.1 demonstrate that BaMn2As2 and BaFe2As2 are miscible at 1000 ∘C at the compositions Ba(Mn0.8Fe0.2)2As2 and Ba(Mn0.2Fe0.8)2As2 but phase-separate when slowly cooled from this temperature.
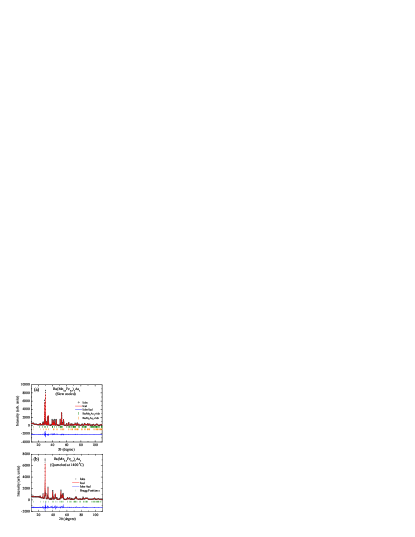
In contrast to the samples with compositions and 0.8 that were single-phase when quenched from 1000 ∘C to 77 K, the samples with , 0.5 and 0.6 synthesized under identical conditions were manifestly multi-phase, demonstrating that the miscibility gap at 1000 ∘C is . The x-ray patterns of the latter three compositions were too ill-defined to be able to obtain reliable Rietveld refinements using them. On increasing the temperature to 1100 -1400 ∘C from which the samples were quenched (see Table 2), multi-phase samples were still obtained but for which the x-ray patterns could be refined assuming an approximately single 122-type phase plus impurity phases, suggesting that the miscibility gap does not close even at 1400 ∘C. For example, shown in Fig. 5 are powder XRD data for Ba(Mn0.5Fe0.5)2As2 samples that were either slow-cooled from 1000 ∘C or quenched from 1400 ∘C as representative of the x = 0.4, 0.5 and 0.6 compositions. Both samples contain impurity phases that are mainly FeAs2 and Fe1-xMnxAs. A two-phase Rietveld refinement of the XRD data for the slow-cooled sample in Fig. 5(a) yields the unit cell volumes and percentage molar fractions of BaMn2As2-rich and BaFe2As2-rich phases shown in Table I and Figs. 3 and 4 that were discussed above in Sec. III.1. The powder XRD pattern of the quenched sample in Fig. 5(b) indicates that the sample contains an approximately single 122-type phase in addition to impurity phases. The calculated unit cell volume of the 122-type phase is 225.74(5) Å3, which suggests a significant mixing of BaMn2As2 and BaFe2As2 at 1400 ∘C, but as noted this sample is not single-phase. The crystal data for these quenched samples with compositions x = 0.4, 0.5 and 0.6 are summarized in Table 2 and Figs. 3 and 4.
The results in this section indicate that the miscibility gap at 300 K has narrowed to at 1000 ∘C. The occurrence of a single 122-type phase plus impurity phases for samples with quenched from 1100 to 1400 ∘C suggests the existence of a homogeneity range at these temperatures for the 122-type phase.
III.3 Ba(MnxFe1-x)2As2 Single Crystals
| Crystal | Spot | Mn-content | Fe-content |
|---|---|---|---|
| (%) | (%) | ||
| Crystal-1 (700 ∘C) | 1 | Remainder | |
| 2 | Remainder | ||
| Crystal-2 (700 ∘C) | 1 | Remainder | |
| 2 | Remainder | ||
| 3 | Remainder | ||
| 4 | Remainder | ||
| Crystal-3 (700 ∘C) | 1 | Remainder | |
| 2 | Remainder | ||
| 3 | Remainder | ||
| 4 | Remainder | ||
| 5 | Remainder | ||
| 6 | Remainder | ||
| Crystal-4 (900 ∘C) | 1 | Remainder | |
| 2 | Remainder | ||
| 3 | Remainder | ||
| 4 | Remainder | ||
| Crystal-5 (900 ∘C) | 1 | Remainder | |
| 2 | Remainder | ||
| 3 | Remainder | ||
| Crystal-6 (900 ∘C) | 1 | Remainder | |
| 2 | Remainder | ||
| 3 | Remainder | ||
| Crystal-7 (900 ∘C) | 1 | Remainder | |
| 2 | Remainder | ||
| 3 | Remainder | ||
| Crystal-8 (900 ∘C) | 1 | Remainder | |
| 2 | Remainder | ||
| 3 | Remainder |
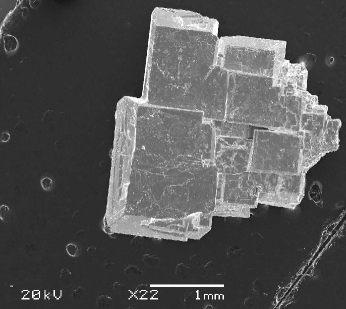
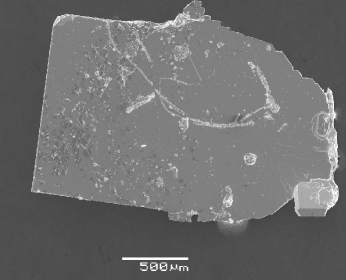
Two batches of Ba(MnxFe1-x)2As2 crystals were grown in Sn flux from a polycrystalline sample of nominal composition by slowly cooling from 1100 ∘C as discussed in Sec. II. The molten Sn flux was decanted at either 700 or 900 ∘C by removing the silica tube from the oven at the respective temperature and quickly placing the inverted tube into a centrifuge that spun up within s. This procedure is equivalent to a slow quench of the crystals to room temperature from the respective temperature. Examples of such crystals are shown in Fig. 6. The compositions of many crystals from the two batches at up to six points on each crystal were measured using EDX and representative results are shown in Table 3. The data for the crystals examined demonstrate that a miscibility gap exists in the Ba(MnxFe1-x)2As2 system, with a composition range of at 700 ∘C and an upper limit to that decreases somewhat to at 900 ∘C, qualitatively similar to our results above on polycrystalline samples. Note that Crystal-3 obtained by decanting the Sn flux at 700 ∘C showed a % variation in the Mn concentration at different points on the crystal.
Among eleven crystals for which the Sn flux was decanted at C that were examined by EDX analysis (only five of which are shown in Table 3), none were found to be Fe-rich even though such crystals were found when the Sn flux was decanted at C. This difference suggests that Fe-rich crystals grow in Sn flux only between 700 and C when the starting composition is .
IV Physical Properties of Single-Phase Quenched Polycrystalline Ba(MnxFe1-x)2As2 Samples ( = 0.2, 0.8)
IV.1 Electrical Resistivity Measurements

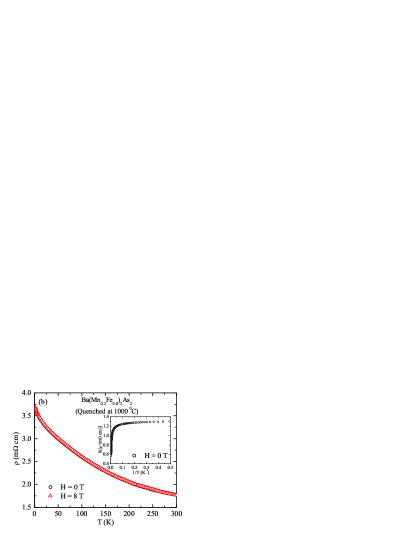
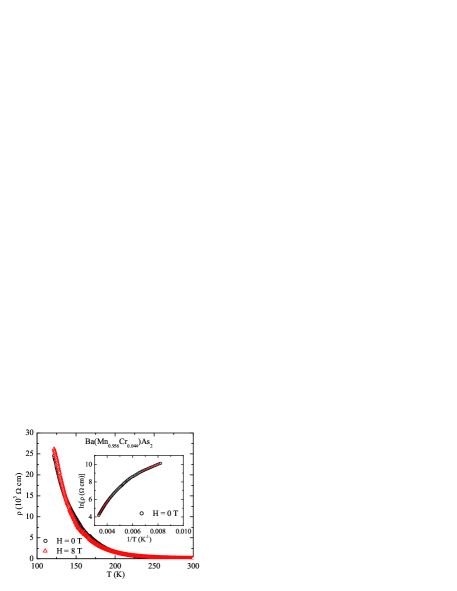
The data for the single-phase quenched polycrystalline samples of Ba(Mn0.8Fe0.2)2As2 and Ba(Mn0.2Fe0.8)2As2 are shown in Fig. 7. The large magnitudes and semiconducting-like temperature dependences suggest nonmetallic ground states for both compounds. However, we emphasize that electronic transport measurements on polycrystalline samples can give spurious results. Measurements on single crystals are needed for definitive electronic transport characterizations. The data in applied magnetic fields and T closely superimpose, suggesting that spin-dependent scattering does not contribute significantly to the resistivity of these materials over the range of the measurements. Plots of ln versus are shown in the insets of the respective figures. Extended linear regions are not found in these plots, which precludes the estimation of activation energies in contrast to BaMn2As2 crystals where meV was found from in-plane measurements.YSingh1
The data for Fe-rich in Fig. 7(b) show no obvious anomaly that might arise from a structural and/or antiferromagnetic (or spin density wave SDW) transition below 300 K. We note that the results in Ref. Kim2010b, for single crystals of the Ba(MnxFe1-x)2As2 system with show evidence for stripe SDW order for below a possibly smeared-out Néel temperature K [see Fig. 4(a) in Ref. Kim2010b, ] and with a ordered moment of per transition metal atom. On the other hand, our data in Fig. 7(a) for Ba(Mn0.8Fe0.2)2As2, near the opposite Mn-rich end of the composition range, suggest that some type of phase transition may occur at K.
IV.2 Magnetization and Magnetic Susceptibility Measurements
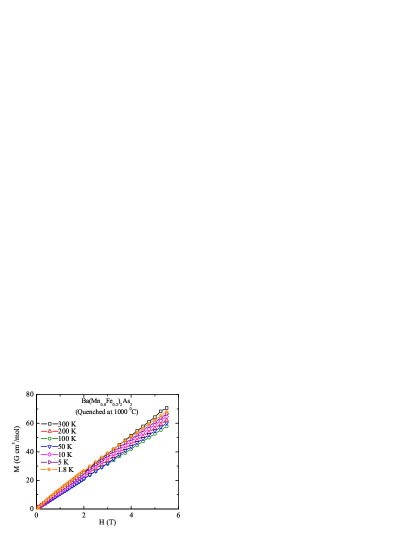
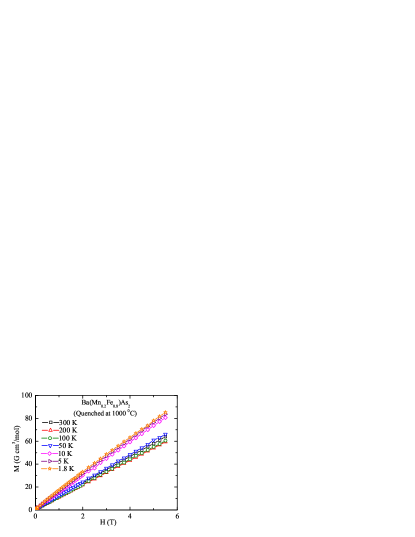

Isothermal magnetization versus measurements for the quenched single-phase polycrystalline samples of Ba(Mn0.8Fe0.2)2As2 and Ba(Mn0.2Fe0.8)2As2 are shown in Fig. 8 for the field range up to 5.5 T. The data taken at various temperatures for both compositions are proportional to , except for the data below 10 K where they exhibit slight nonlinear behaviors with negative curvature for fields below T, which most likely arise from saturable paramagnetic impurities. We performed linear fits to the data in the field range T for K; the high-field slopes give independent values of of the materials below 10 K that are referred to below.
The magnetic susceptibilities versus temperature measured in T for the quenched samples of Ba(Mn0.8Fe0.2)2As2 and Ba(Mn0.2Fe0.8)2As2 are shown in Fig. 9, together with the values of the calculated as described above from the isotherms for K. These latter values are similar to the values obtained in the respective scans at fixed , demonstrating that the amounts of saturable impurities are almost negligible in these samples. The positive slopes of for Ba(Mn0.8Fe0.2)2As2 and Ba(Mn0.2Fe0.8)2As2 at the higher temperatures are consistent with the similar behaviors reported in the paramagnetic states for single crystals of BaMn2As2 (Ref. YSingh1, ) and BaFe2As2.Wang2009 ; Rotter2 The upturns in for the samples below –200 K may be due to the presence of nonsaturable paramagnetic impurities and/or magnetic defects, although as previously noted we did not detect any impurity phases in these samples from XRD measurements. There is no clear evidence from the data for either sample for an anomaly in due a SDW and/or tetragonal-to-orthorhombic transition. Such transitions are observed at K in undoped BaFe2As2.Wang2009 ; Rotter2
We note that consistent with the XRD data in Fig. 5(b) for the quenched (1400 ∘C to 77 K) sample of Ba(Mn0.5Fe0.5)2As2, our data for this sample (not shown) indicated the presence of a substantial amount of ferromagnetic impurities. Hence, we did not attempt to extract from the data for this sample.
IV.3 Heat Capacity Measurements
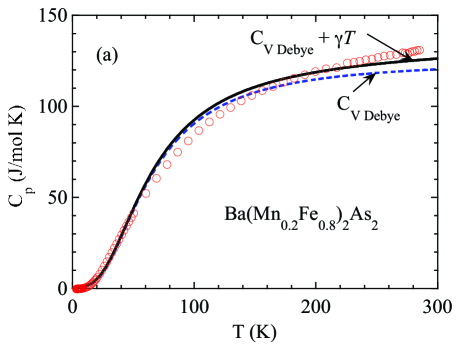
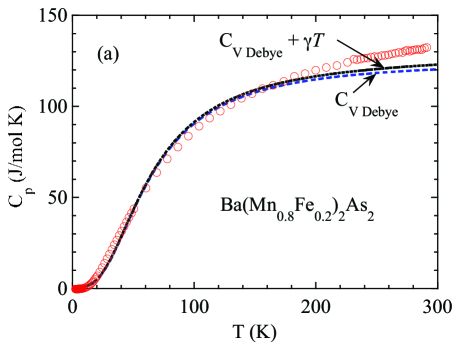
The temperature variation of the heat capacity at constant pressure () for the two single-phase quenched polycrystalline samples of and are shown in Figs. 10 and 11, respectively. The measured value of at K is 129 and 130 J/mol K for and , respectively. These values are close to, but a bit larger than, the classical Dulong-Petit heat capacity J/mol K expected for a crystalline compound containing five atoms/f.u. The data for the two compounds show no evidence for any phase transitions in the temperature range of measurement.
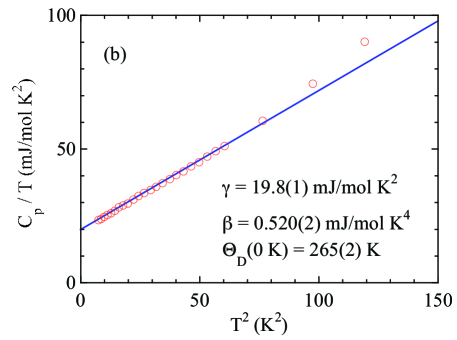
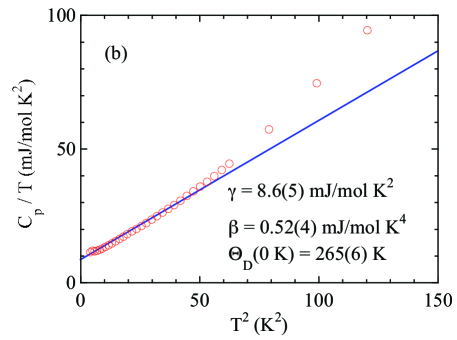
We fitted the low-temperature data in Figs. 10(b) and 11(b) using the expression
| (1) |
where is the Sommerfeld coefficient of the electronic heat capacity and is the coefficient of the Debye term for lattice heat capacity. The values of the fitting parameters and their error bars are given in the figures. The value of reported by Singh et al. for is 0.0(4) mJ/mol K2.YSingh1 The nonzero values of for and suggest metallic ground states. Indeed, our measurements indicate that the magnitude of the resistivities of and are significantly smaller than reported for .YSingh1 The Debye temperature is estimated using the expressionKittel2005
| (2) |
where is the number of atoms per formula unit [ in the present case of Ba(MnxFe1-x)2As2] and is the molar gas constant. The calculated values of are about 265 K, somewhat larger than K reported for a single crystal of .YSingh1
The Debye lattice heat capacity function at constant volume per mole of atoms isKittel2005
| (3) |
This function describes the heat capacity of acoustic phonons. The is plotted in Figs. 10(a) and 11(a) using the value K determined in Figs. 10(b) and 11(b) and taking into account the five atoms per formula unit. Overall, the Debye function fits the data reasonably well, but a temperature dependence of is evident from the comparison.Gopal1966 Also, the experimental data at the higher temperatures are above the Debye function, suggesting additional contributions. We added the respective electronic contributions to the Debye function, as shown in Figs. 10(a) and 11(a). The data are still above the calculated values at the highest temperatures. Finally, we calculated the difference for the lattice heat capacity for the compound according to the thermodynamic relation
where is the molar volume, is the volume thermal expansion coefficient, and is the bulk modulus. For the 200–300 K temperature range, using the values K-1,Budko2010 dyne/cm2,Mittal2011 and cm3/mol,Johnston2010 we obtained
This prediction is similar in magnitude to the electronic contribution for the Mn-rich sample in Fig. 11(a) and is not sufficient to obtain agreement with both the magnitude and slope of the data near 300 K, especially for the Mn-rich sample, suggesting that at least one other contribution to the heat capacity is present. This additional heat capacity could arise from optic phonons and/or from magnetic excitations.
V Physical Properties of Single Crystalline Cr-, Fe- and Sb-substituted BaMn2As2
As noted previously in Sec. II, our attempts to grow single crystals of substituted Ba(Mn)2As2 ( = Cr, Fe, Co, Ni, Cu, Ru, Rh, Pd, Re, Pt) and BaMn2(As1-xSbx)2 using Sn flux were mostly unsuccessful. The only partially successful attempts were with Cr and Fe substitutions for Mn and Sb substitution for As, where we achieved 4.4%, % and 2.6% substitutions, respectively. These concentrations were much smaller than present in the starting compositions of the crystal growth mixtures. Here we present in-plane and anisotropic measurements on such Cr-, Fe- and Sb-substituted crystals, which were found to be similar to the respective properties of unsubstituted BaMn2As2 crystals.
V.1 Electrical Resistivity Measurements

The in-plane data for single crystals of and are shown in Fig. 12. The behaviors for both crystals exhibit monotonic increases with decreasing below our high-temperature limit of 300 K. The resistance values below K became very large and exceeded the measurement limit of our instrument, indicating insulating ground states of the materials, similar to previous observations on single-crystal BaMn2As2.YSingh1 ; An1 An applied magnetic field of 8 T resulted in no significant change in for either sample, as shown.
The insets of the two panels in Fig. 12 show ln versus . The data in each inset suggest two quasi-linear regions, as shown by the two straight red lines. The data in these regions follow , where is a constant, is the activation energy and is Boltzmann’s constant. The fitted values of the activation energies in the lowest and highest- regions for each sample are given in the figure caption. The larger value for each sample can probably be interpreted as the intrinsic activation energy while the smaller one may be the energy gap between donor or acceptor energy levels and a conduction or valence band, respectively.Pearson1 These observations suggest that similar to BaMn2As2,YSingh1 and are small-band-gap semiconductors.
V.2 Magnetization and Magnetic Susceptibility Measurements
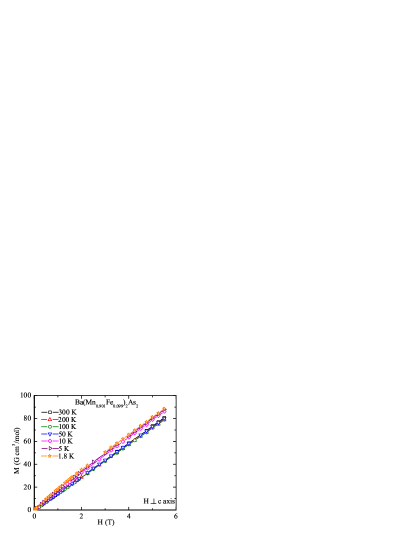
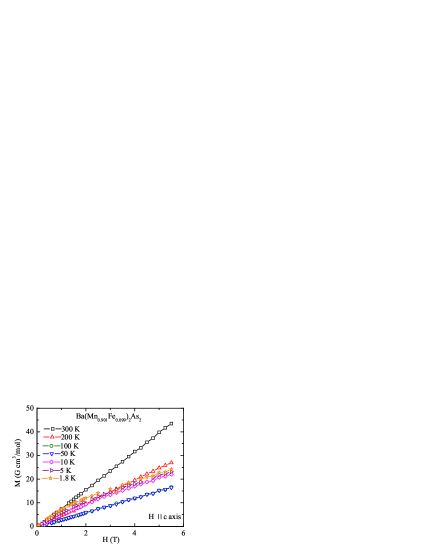
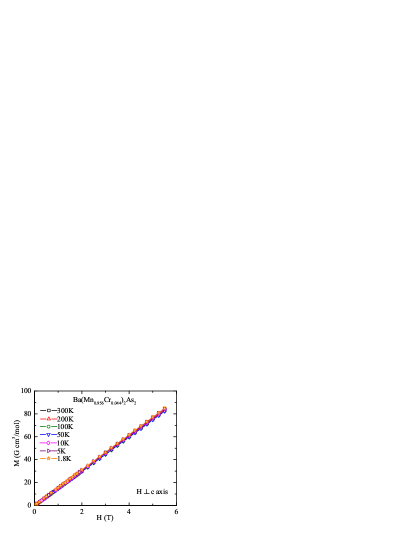
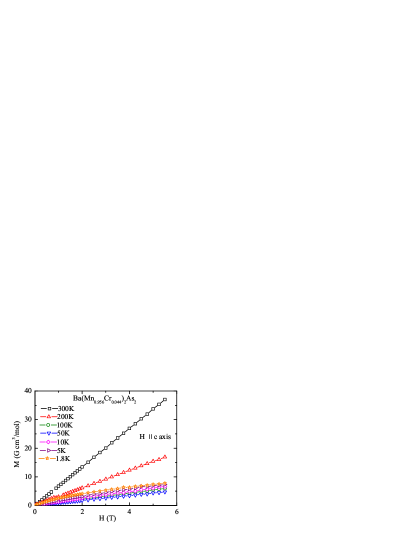
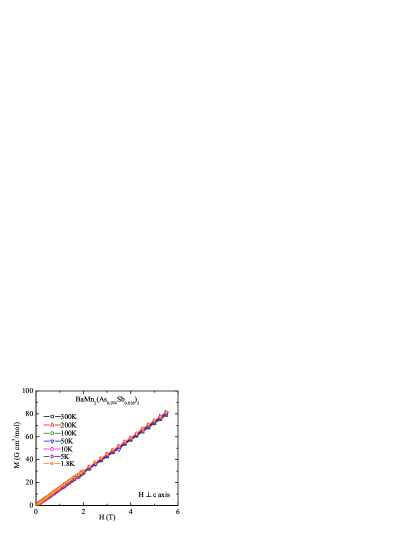
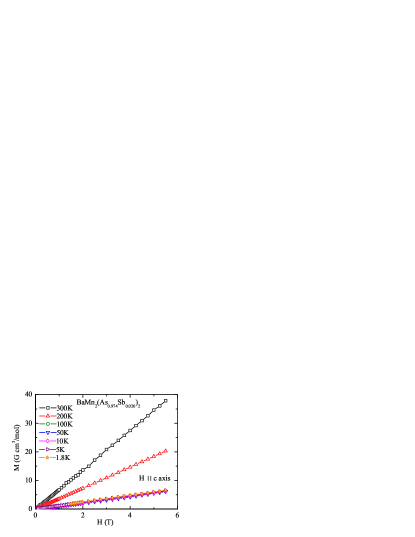
Shown in Figs. 13, 14 and 15 are isotherms at temperatures from 1.8 to 300 K for single crystals of Ba(Mn0.901Fe0.099)2As2, and , respectively. For each compound is proportional to , except for temperatures K where the data sometimes exhibit nonlinear behavior at fields below T. These data are similar to the above-discussed data for quenched polycrystalline samples of Ba(Mn0.8Fe0.2)2As2 and Ba(Mn0.2Fe0.8)2As2, and indicate the absence of significant amounts of ferromagnetic or saturable paramagnetic impurities in the samples. In particular, the problematic relatively large amounts of ferromagnetic MnAs impurities present in BaMn2As2 crystals studied previouslyYSingh1 are not present in the present lightly substituted crystals.
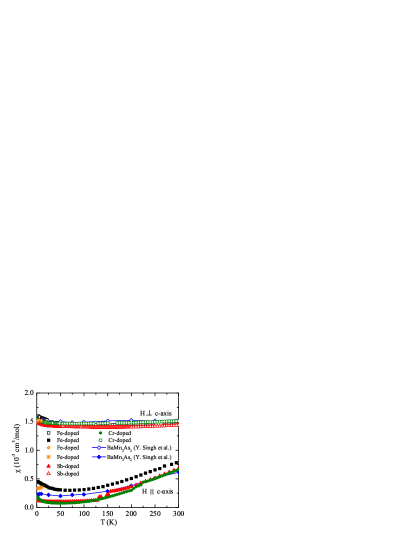
Shown in Fig. 16 is the anisotropic temperature variation of the magnetic susceptibility of the Ba(Mn0.901Fe0.099)2As2, and single crystals. The susceptibilities obtained as the slopes of the high-field linear part of the isotherms for temperatures K, in the field range of 3–5.5 T, are also plotted as distinct symbols in Fig. 16. Similar to data for undoped BaMn2As2 (Ref. YSingh1, ) that are also shown in the figure, the in-plane susceptibility cm3/mol is nearly independent of over the whole range of the measurement for all our crystals. In contrast, the axis susceptibility generally decreases monotonically with decreasing below 300 K. These observations indicate that our substituted crystals have magnetic properties very similar to those of unsubstituted BaMn2As2 and therefore that the former substituted crystals are antiferromagnetically ordered with Néel temperatures far above room temperature, where K for unsubstituted BaMn2As2.YSingh2
VI Summary and Conclusions
From our room-temperature powder XRD measurements of polycrystalline Ba(MnxFe1-x)2As2 samples slow-cooled from 1000 ∘C, we discovered a miscibility gap at 300 K with a composition range . However, the miscibility gap becomes narrower at higher temperatures. For samples quenched into liquid nitrogen from 1000 ∘C, the miscibility gap narrows to the concentration region . The quenched samples of Ba(MnxFe1-x)2As2 with x = 0.4, 0.5 and 0.6 contain a single 122-type phase but also contain significant amounts of impurities, mainly Fe1-xMnxAs and FeAs2. These latter results suggest that the equilibrium phase diagram between BaMn2As2 and BaFe2As2 is not pseudo-binary in nature near the middle of the composition range.
Electrical resistivity measurements suggest that our single-phase quenched polycrystalline Ba(Mn0.8Fe0.2)2As2 and Ba(Mn0.2Fe0.8)2As2 samples are not metallic, but we caution that reliable resistivity data on such materials can only be obtained using single crystals. Indeed, our heat capacity measurements on these two samples reveal significant linear terms at low temperatures, suggesting metallic ground states. Our measurements show that the quenched samples of Ba(Mn0.8Fe0.2)2As2 and Ba(Mn0.2Fe0.8)2As2 do not contain ferromagnetic impurities. The magnitudes and temperature dependences of around room temperature for these compositions are qualitatively consistent with those reported for BaMn2As2 and BaFe2As2. The resistivity data, but not the susceptibility data, for Ba(Mn0.8Fe0.2)2As2 suggest that some sort of phase transition may take place at about 260 K. Furthermore, heat capacity data for both Ba(Mn0.8Fe0.2)2As2 and Ba(Mn0.2Fe0.8)2As2 show no evidence for any phase transitions from 2 to 280 K. These data suggest that optical phonon excitations and/or magnetic excitations become important near and above room temperature.
Since the , and data for Ba(Mn0.2Fe0.8)2As2 do not show any anomalies below 300 K, these data suggest that the substitution of 20% of the Fe by Mn in BaFe2As2 suppresses the tetragonal-to-orthorhombic and SDW transitions that are observed in BaFe2As2. However, the recent work of Kim et al. found that 17.6% substitution of Fe by Mn suppresses the crystallographic transition, but not the SDW transition which still occurs at K.Kim2010b Furthermore, this study reported inflection points in the temperature dependences of the resistivities of their single crystal samples with that occurred at the respective composition-dependent temperatures of the structural/magnetic transition. Our resistivity measurement on polycrystalline Ba(Mn0.2Fe0.8)2As2 in Fig. 7(b) did not show any evidence for such an inflection point. It is not clear why our measurements on polycrystalline Ba(Mn0.2Fe0.8)2As2 do not show behaviors similar to those reported for single crystals at similar compositions.
We attempted to grow single crystals of substituted BaMn2As2 out of Sn flux. However, substitution of Mn by Co, Ni, Cu, Ru, Rh, Pd, Re and Pt did not occur in concentrations greater than 0.5% except for 4.4% and % substitutions in the case of Cr and Fe, respectively, and 2.6% substitution of As by Sb. The magnetic properties of Fe-, Cr- and Sb-substituted BaMn2As2 crystals are similar to those of pure BaMn2As2.
Acknowledgements.
We are grateful to Yogesh Singh and Andreas Kreyssig for helpful discussions, Supriyo Das for assistance with laboratory activities, and Makariy Tanatar for advice on making electrical contacts to the samples for resistivity measurements. Work at the Ames Laboratory was supported by the Department of Energy-Basic Energy Sciences under Contract No. DE-AC02-07CH11358.References
- (1) Y. Kamihara, T. Watanabe, M. Hirano, and H. Hosono, J. Am. Chem. Soc. 130, 3296 (2008).
- (2) D. C. Johnston, Adv. Phys. 59, 803 (2010).
- (3) T. Yamazaki, N. Takeshita, R. Kobayashi, H. Fukazawa, Y. Kohori, K. Kihou, C. H. Lee, H. Kito, A. Iyo, and H. Eisaki, Phys. Rev. B 81, 224511 (2010).
- (4) F. Ishikawa, N. Eguchi, M. Kodama, K. Fujimaki, M. Einaga, A. Ohmura, A. Nakayama, A. Mitsuda, and Y. Yamada, Phys. Rev. B 79, 172506 (2009).
- (5) E. Colombier, S. L. Bud’ko, N. Ni, and P. C. Canfield, Phys. Rev. B 79, 224518 (2009).
- (6) M. Rotter, M. Tegel, and D. Johrendt, Phys. Rev. Lett. 101, 107006 (2008).
- (7) P. C. Canfield and S. L. Bud’ko, Annu. Rev. Condens. Matter Phys. 1, 27 (2010).
- (8) S. Jiang, H. Xing, G. Xuan, C., Z. Ren, C. Feng, J. Dai, Z. Xu, and G. Cao, J. Phys.: Condens. Matter 21, 382203 (2009).
- (9) A. S. Sefat, D. J. Singh, L. H. VanBebber, Y. Mozharivskyj, M. A. McGuire, R. Jin, B. C. Sales, V. Keppens, and D. Mandrus, Phys. Rev. B 79, 224524 (2009).
- (10) Y. Liu, D. L. Sun, J. T. Park, and C. T. Lin, Physica C 470, S513 (2010).
- (11) S. L. Bud’ko, S. Nandi, N. Ni, A. Thaler, A. Kreyssig, A. Kracher, J.-Q. Yan, A. I. Goldman, and P. C. Canfield, Phys. Rev. B 80, 014522 (2009).
- (12) M. G. Kim, A. Kreyssig, A. Thaler, D. K. Pratt, W. Tian, J. L. Zarestky, M. A. Green, S. L. Bud’ko, P. C. Canfield, R. J. McQueeney, and A. I. Goldman, Phys. Rev. B 82, 220503(R) (2010).
- (13) D. J. Singh, A. S. Sefat, M. A. McGuire, B. C. Sales, D. Mandrus, L. H. VanBebber, and V. Keppens, Phys. Rev. B 79, 094429 (2009).
- (14) J. An, A. S. Sefat, D. J. Singh, and M.-H. Du, Phys. Rev. B 79, 075120 (2009).
- (15) Y. Singh, A. Ellern, and D. C. Johnston, Phys. Rev. B 79, 094519 (2009).
- (16) Y. Singh, M. A. Green, Q. Huang, A. Kreyssig, R. J. McQueeney, D. C. Johnston, and A. I. Goldman, Phys. Rev. B 80, 100403(R) (2009).
- (17) P. Cheng, B. Shen, J. Hu, and H. H. Wen, Phys. Rev. B 81, 174529 (2010).
- (18) J. S. Kim, S. Khim, H. J. Kim, M. J. Eom, J. M. Law, R. K. Kremer, J. H. Shim, and K. H. Kim, Phys. Rev. B 82, 024510 (2010).
- (19) M. G. Kim, D. K. Pratt, G. E. Rustan, W. Tian, J. L. Zarestky, A. Thaler, S. L. Bud’ko, P. C. Canfield, R. J. McQueeney, A. Kreyssig, and A. I. Goldman, Phys. Rev. B 83, 054514 (2011).
- (20) D. Kasinathan, A. Ormeci, K. Koch, U. Burkhardt, W. Schnelle, A. Leithe-Jasper, and H. Rosner, New J. Phys. 11, 025023 (2009).
- (21) D. Bérardan, L. Pinsard-Gaudard, and N. Dragoe, J. Alloys Compd. 481, 470 (2009).
- (22) T. W. Huang, T. K. Chen, K. W. Yeh, C. T. Ke, C. L. Chen, Y. L. Huang, F. C. Hsu, M. K. Wu, P. M. Wu, M. Avdeev, and A. J. Studer, Phys. Rev. B 82, 104502 (2010).
- (23) J. Rodriguez-Carvajal, Physica B 192, 55 (1993).
- (24) N. Ni, S. L. Bud’ko, A. Kreyssig, S. Nandi, G. E. Rustan, A. I. Goldman, S. Gupta, J. D. Corbett, A. Kracher, and P. C. Canfield, Phys. Rev. B 78, 014507 (2008).
- (25) S.-H. Baek, T. Klimczuk, F. Ronning, E. D. Bauer, J. D. Thompson, and N. J. Curro, Phys. Rev. B 78, 212509 (2008).
- (26) X. F. Wang, T. Wu, G. Wu, H. Chen, Y. L. Xie, J. J. Ying, Y. J. Yan, R. H. Liu, and X. H. Chen, Phys. Rev. Lett. 102, 117005 (2009).
- (27) Y. Su, P. Link, A. Schneidewind, Th. Wolf, P. Adelmann, Y. Xiao, M. Meven, R. Mittal, M. Rotter, D. Johrendt, Th. Brueckel, and M. Loewenhaupt, Phys. Rev. B 79, 064504 (2009).
- (28) M. Rotter, M. Tegel, D. Johrendt, I. Schellenberg, W. Hermes, and R. Pöttgen, Phys. Rev. B 78, 020503(R) (2008).
- (29) C. Kittel, Introduction to Solid State Physics, 8th edition (Wiley, New York, 2005).
- (30) E. S. R. Gopal, Specific Heats at Low Temperatures (Plenum, New York, 1966).
- (31) S. L. Bud’ko, N. Ni, and P. C. Canfield, Phil. Mag. 90, 1219 (2010).
- (32) R. Mittal, S. K. Mishra, S. L. Chaplot, S. V. Ovsyannikov, E. Greenberg, D. M. Trots, L. Dubrovinsky, Y. Su, Th. Brueckel, S. Matsuishi, H. Hosono, and G. Garbarino, Phys. Rev. B 83, 054503 (2011).
- (33) G. L. Pearson and J. Bardeen, Phys. Rev. 75, 865 (1949).