Active Galactic Nucleus Pairs from the Sloan Digital Sky Survey.
II. Evidence for Tidally Enhanced Star Formation and Black Hole
Accretion
Abstract
Active galactic nuclei (AGNs) are occasionally seen in pairs, suggesting that tidal encounters are responsible for the accretion of material by both central supermassive black holes (BHs). In Paper I of this series, we selected a sample of AGN pairs with projected separations h kpc and velocity offsets km s-1 from the SDSS DR7 and quantified their frequency. In this paper, we address the BH-accretion and recent star-formation properties in their host galaxies. AGN pairs experience stronger BH accretion, as measured by their [O III] 5007 luminosities (corrected for contribution from star formation) and Eddington ratios, than do control samples of single AGNs matched in redshift and host-galaxy stellar mass. Their host galaxies have stronger post-starburst activity and younger mean stellar ages, as indicated by stronger H absorption and smaller 4000 Å break in their spectra. The BH accretion and recent star formation in the host galaxies both increase with decreasing projected separation in AGN pairs, for – h kpc. The intensity of BH accretion, the post-starburst strength, and the mean stellar ages are correlated between the two AGNs in a pair. The luminosities and Eddington ratios of AGN pairs are correlated with recent star formation in their host galaxies, with a scaling relation consistent with that observed in single AGNs. Our results suggest that galaxy tidal interactions enhance both BH accretion and host-galaxy star formation in AGN pairs, even though the majority of low redshift AGNs is not coincident with on-going interactions.
Subject headings:
black hole physics – galaxies: active – galaxies: interactions – galaxies: nuclei – galaxies: stellar content1. Introduction
It has long been recognized that galaxy mergers and close interactions play a vital role in shaping the morphology of galaxies (e.g., Zwicky, 1956; Vorontsov-Velyaminov, 1959; Toomre & Toomre, 1972; Khachikian, 1987; Sanders et al., 1988; Barnes & Hernquist, 1992) and in particular the cores of ellipticals (e.g., Faber et al., 1997; Graham, 2004; Merritt et al., 2004; Lauer et al., 2005; Kormendy & Bender, 2009). While mergers only represent brief episodes in the lifetime of a galaxy (e.g., Lotz et al., 2008; Conselice et al., 2009; Darg et al., 2010b; Lotz et al., 2011), there is circumstantial evidence that they can trigger substantial star formation both in the nuclear region and throughout the galaxy (e.g., see the review by Struck, 2006). The enhancement in star formation predicted by numerical simulations depends on how that star formation and its associated feedback are modeled (e.g., Mihos et al., 1992; Kauffmann et al., 1993; Cole et al., 1994; Springel & Hernquist, 2003; Springel et al., 2005b). Therefore observations of star formation in interacting galaxies can be used to constrain these models, and help advance our general understanding of star formation, and in particular, modes that are exclusive to strong tidal encounters (e.g., Elmegreen et al., 1993; Daddi et al., 2010) which may be more common in early galaxy formation (e.g., Förster Schreiber et al., 2009).
Galaxy mergers and close interactions are also thought to drive significant accretion in their central supermassive black holes (BHs; e.g., Hernquist, 1989; Moore et al., 1996) and are thus responsible for at least some Active Galactic Nuclei (AGNs). The enhanced nuclear activity may be primarily driven by tidal torques, or secondarily fueled by stellar mass loss due to elevated levels of star formation (e.g., Norman & Scoville, 1988; Ciotti & Ostriker, 2007; Ciotti et al., 2010). Some numerical models predict that merger-induced AGNs heat the gas surrounding them, preventing further gas cooling and star formation (e.g., Springel et al., 2005b, a; Di Matteo et al., 2005; Hopkins et al., 2006). Observationally, however, the causal link between galaxy interactions and AGNs has been controversial. The details of AGN feeding, and in particular, the role of mergers, may be quite different at high and low accretion rates (e.g., Ho, 2008). While the small-scale (–1 Mpc) quasar-quasar two-point correlation function suggests a clustering excess over the large-scale ( Mpc) extrapolation (Hennawi et al., 2006; Myers et al., 2007; Hennawi et al., 2010; Shen et al., 2011b), it is unclear whether this is due to interactions of the quasar pairs’ host galaxies (e.g., Djorgovski, 1991; Kochanek et al., 1999; Mortlock et al., 1999), or is rather a manifest of the small-scale clustering strength of their host dark matter halos (e.g., Hopkins et al., 2008). Some observations found an excess of close neighbors in AGN host galaxies or a higher fraction of AGNs in interacting than in isolated galaxies (e.g., Petrosian, 1982; Hutchings & Campbell, 1983; Dahari, 1984; Kennicutt & Keel, 1984; Keel et al., 1985; Bahcall et al., 1997; Serber et al., 2006; Koss et al., 2010; Silverman et al., 2011; Ellison et al., 2011) whereas others detected no significant difference (e.g., Dahari, 1985; Schmitt, 2001; Miller et al., 2003; Grogin et al., 2005; Waskett et al., 2005; Ellison et al., 2008; Li et al., 2008b; Darg et al., 2010b).
Observations of galaxy pairs directly probe the effects induced by galaxy tidal interactions, at least at the early stages when the two galaxies can be identified as separate. Studies of the properties of galaxy pairs as a function of pair separation, and in comparison to single galaxies provide clues to how tidal effects evolve as mergers progress. Simulations suggest that merger-induced star formation and AGN activity peak after the galaxies have coalesced (Springel et al., 2005b; Di Matteo et al., 2005). There is accumulating evidence for tidally-enhanced activity starting at the early merger stages when the galaxies are still separate and that the enhancement becomes more prominent as a merger progresses. Emission-line galaxies in pairs show stronger star formation activity, which is larger for smaller projected separations (Barton et al., 2000; Lambas et al., 2003; Alonso et al., 2004; Nikolic et al., 2004; Ellison et al., 2008). Galaxy-AGN pairs with smaller separations show stronger AGN (Rogers et al., 2009), while galaxy pairs with smaller separations host a higher fraction of AGN (Woods & Geller, 2007; Darg et al., 2010a). If tidal effects impact both interacting components (e.g., by promoting gas infall and inducing gravitational instabilities) and the induced activity is synchronous, there should be observable correlations between them, unless additional factors regulate such trends. Indeed, Holmberg (1958) remarked on what is now called the “Holmberg effect”, whereby the colors of galaxies in pairs are correlated (e.g., Madore, 1986; Kennicutt et al., 1987; Laurikainen & Moles, 1989) which suggests the presence of tidally induced star formation in both of the interacting galaxies.
We have selected a sample of 1286 pairs of AGNs with projected separations h kpc and line-of-sight velocity offsets km s-1 from the Seventh Data Release (DR7; Abazajian et al., 2009) of the Sloan Digital Sky Survey (SDSS; York et al., 2000) and examined their frequency among the parent sample of optically selected AGNs (Liu et al., 2011, Paper I). The sample is defined in detail in Paper I. In the present paper, we study their BH-accretion and recent star-formation properties in the host galaxies to constrain the effects of galaxy tidal interactions. AGN pairs characterize a special population of galaxy pairs, in which the central SMBHs of both galaxies are actively accreting at the same time. A statistical sample of AGN pairs enables us to examine whether there is a correlation in the accretion power of the central SMBHs between the interacting components, akin to what has been observed for star formation in galaxy pairs.
In §2 we describe the construction of our AGN pair sample and the control sample of single AGNs. In §3 we present the recent star formation and BH accretion properties of AGN pairs, and we examine their dependence on the projected pair separation and recessional velocity offset in §3.1, the dependence on host-galaxy properties in §3.2, the correlation between the two components in each AGN pair in §3.3, and the correlation between recent star formation and AGN activity in §3.4. We discuss the implications of our results in §4 and conclude in §5. Throughout we assume a cosmology with , , and km s-1 Mpc-1.
2. Data: AGN Pairs, AGN Pairs with Tidal Features, and Control Samples
We briefly describe the basic properties and physical measurements of our AGN pairs. Details of our sample selection are presented in Paper I. We have selected AGN pairs with h kpc and km s-1 from a parent sample of 138,070 AGNs spectroscopically identified based on their optical diagnostic emission-line ratios111For narrow emission line objects, we adopt the Kauffmann et al. (2003a) empirical criterion for AGN classification as our baseline values (i.e., including AGN-H II composites to avoid selection biases against galaxies with more starburst components), but we have also tested that our results do not vary qualitatively using the Kewley et al. (2001) theoretical “starburst limit” criterion (i.e., excluding AGN-H II composites to focus on AGN dominated systems). and/or widths. 98% of the sample is contained in the SDSS main galaxy catalog (Strauss et al., 2002), and for the present analysis we have excluded broad-line objects (Hao et al., 2005) to avoid AGN continuum contamination on host-galaxy measurements. We refer to this sample as the “pair” sample. As discussed in Paper I, 256 of the 1286 AGN pairs show unambiguous morphological tidal features tails in the SDSS images, such as bridges, and/or rings, indicative of strong tidal interactions, and we refer to this subset as the “tidal” sample. We consider the tidal sample to be “cleaner” than the pair sample for studies of interactions, as the pair sample may include closely separated AGN pairs that are not yet tidally interacting. On the other hand, as discussed in Paper I, the tidal sample is incomplete and subject to biases due to the surface-brightness and image-resolution limits in our ability to recognize tidal features. We thus analyze both samples and compare results to quantify the range of possible values. As discussed in Paper I, due to the finite size of the SDSS fibers, galaxy pairs with separations smaller than 55″ will not both be observed unless they fall in the overlap regions on adjacent plates (Strauss et al., 2002; Blanton et al., 2003). We correct for this spectroscopic incompleteness by supplementing the observed sample of AGN pairs with repeated systems randomly drawn from the AGN pairs with separations smaller than 55″, where is the observed number of pairs and is the correction factor (see Paper I for details). The small separation AGN pairs fall in the overlap regions on adjacent plates so that they both got spectroscopic observations. There should be no biases introduced here because the spectroscopically observed small separation pairs are randomly distributed on the sky and are therefore representative of the parent small separation population.
We adopt redshifts and stellar velocity dispersions of each galaxy from the specBS pipeline (Adelman-McCarthy et al. 2008; Aihara et al. 2011; see also discussion in Blanton et al. 2005) and excluded extreme values of ( or km s-1) and those with large uncertainties (S/N) or negative errors from bad fits. Additional spectral and photometric properties such as emission-line fluxes, continuum spectral indices, stellar masses, and half-light radii are taken from the MPA-JHU data product222http://www.mpa-garching.mpg.de/SDSS/DR7/ (see Aihara et al. 2011 for a description of the catalog). The emission-line measurements are from Gaussian fits to continuum-subtracted spectra (Brinchmann et al., 2004; Tremonti et al., 2004). The emission-line fluxes have been normalized to SDSS -band photometric fiber magnitudes and have been corrected for Galactic foreground extinction following O’Donnell (1994) using the map of Schlegel et al. (1998). Continuum spectral indices such as H and are measured from data spectra after subtracting all 3- emission lines (Kauffmann et al., 2003b; Brinchmann et al., 2004), which, as we have checked, are consistent with those measured from best-fit continuum model spectra. The stellar mass estimates are total stellar masses derived from population synthesis fits using the Bruzual & Charlot (2003) models to SDSS broad-band photometry (Kauffmann et al., 2003b; Salim et al., 2007). The adopted stellar mass estimate from photometry fits is a good indicator of the dynamical mass inside the effective radius (, where is the galaxy effective radius and is the gravitational constant) for (Brinchmann & Ellis, 2000; Drory et al., 2004; Padmanabhan et al., 2004); At the lower mass end of our sample (), is dex larger than (Drory et al., 2004).
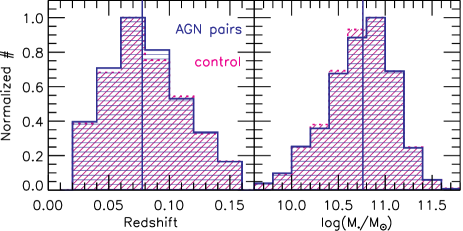
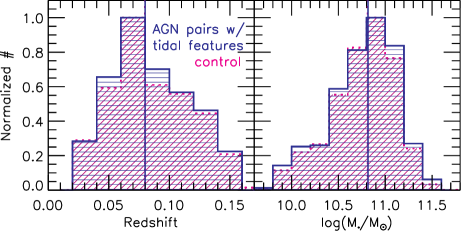
To characterize how the effects of tidal interactions on host star formation and BH accretion evolve in AGN pairs as the merger progresses, we examine their statistical properties as a function of pair separation and velocity offset, and compare to control samples of single AGNs. We draw control AGNs from our parent sample of 138,070 AGNs. We match the control sample to the AGN pair sample in redshift to mitigate selection biases in our flux-limited sample, and aperture bias due to the difference in the physical scales covered by the SDSS 3″ fibers for galaxies at different redshifts. We also match stellar mass distribution to control mass-dependent effects of AGN host-galaxy properties (Kauffmann et al., 2003a). We show in Figure 1 the redshift and stellar mass distributions of the pair (tidal) sample and its control sample, respectively. We match the whole distribution rather than object by object. The control samples are drawn to have the same distribution in redshift and in stellar mass as the pair (tidal) sample by requiring that their Kolmogorov-Smirnov (KS) probabilities are larger than 50% at least. We have matched galaxy mass rather than luminosity in our control sample, because interacting galaxies often show younger stellar populations than do isolated galaxies, making galaxy luminosity a biased indicator of mass (see also e.g., Ellison et al., 2008).
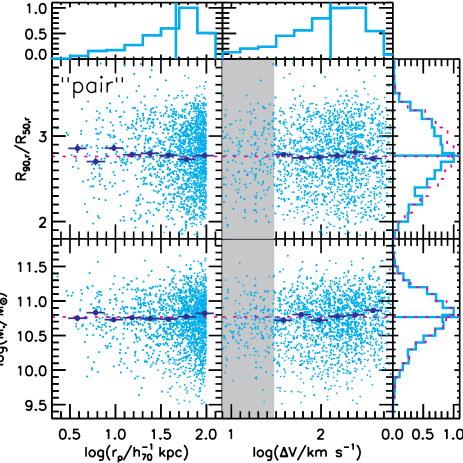
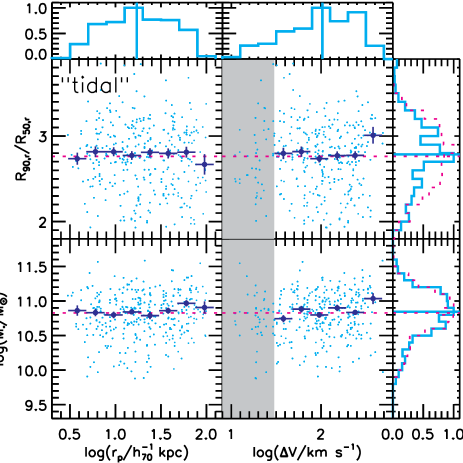
To study the intrinsic dependence of host star formation and BH accretion on and in AGN pairs, we first verify in Figure 2 that host-galaxy stellar mass does not correlate with or , obviating the need to match control samples for each subset of AGN pairs at any fixed or . Figure 2 also shows that galaxy concentration, a measure of the mass distribution within galaxies, does not correlate with or , which is relevant because the distribution of mass within galaxies may also regulate merger timescales333The mass distribution of dark matter halos at large radius dictates merger timescales on tens-of-kpc scales.. The -band concentration index is defined as the ratio between the -band Petrosian half-light radius and the radius enclosing 90% of the -band Petrosian luminosity of a galaxy (Strauss et al., 2002).
3. Results: Black Hole Accretion and Host-Galaxy Recent Star Formation in AGN Pairs
In §3.1 we present the distributions of BH accretion and host recent star formation properties of the pair and tidal samples and their dependence on and , and compare them with control AGN samples. We show how these results depend on host-galaxy stellar mass ratio and concentration in §3.2. §3.3 focuses on the correlations between the interacting components in an AGN pair. We then examine in §3.4 the correlation between BH accretion and host recent star formation in AGN pairs and compare with those of control samples of single AGNs.
3.1. Dependence on Projected Pair Separation and Recessional Velocity Offset
3.1.1 Recent Star Formation in the Host Galaxies
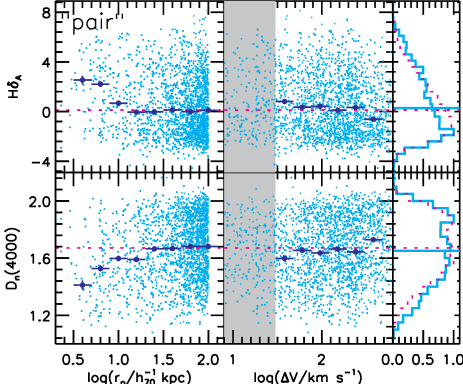
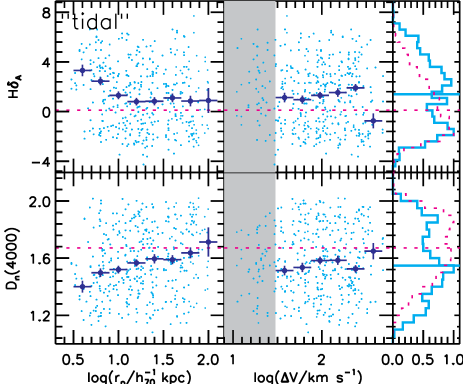
In this section, we address how galaxy tidal encounters affect recent star formation in AGN pairs. We cannot directly use the commonly used optical emission lines (H and [O II]) as indicators of current star formation for the galaxies in our sample because they contain contribution from AGN (e.g., Ho et al., 1997; Kauffmann et al., 2003a; Brinchmann et al., 2004). Instead we adopt the continuum spectral indices H and as indicators of recent star formation, following Kauffmann et al. (2003a). Strong H absorption lines arise in galaxies that experienced a burst of star formation that ended 0.1–1 Gyr ago, and large H values indicate strong recent starburst activity (e.g., Worthey & Ottaviani, 1997; Kauffmann et al., 2003b). measures the continuum break around rest-frame 4000 Å, which arises from a series of metal lines typical of 1–2-Gyr old stars (e.g., Bruzual, 1983; Balogh et al., 1999; Bruzual & Charlot, 2003). is small for young stellar populations and large for old, metal-rich galaxies, and can be used to characterize the luminosity-weighted mean stellar age (Kauffmann et al., 2003b).
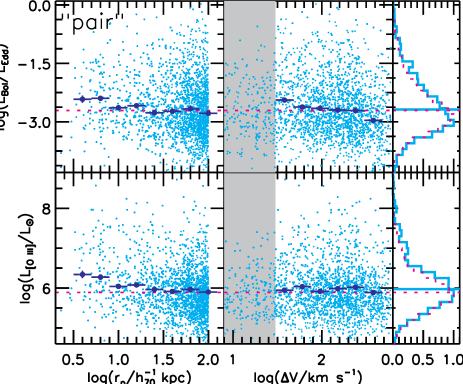
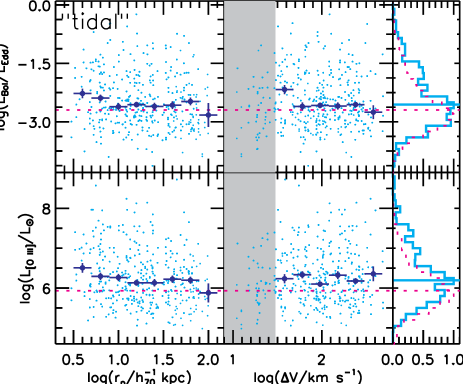
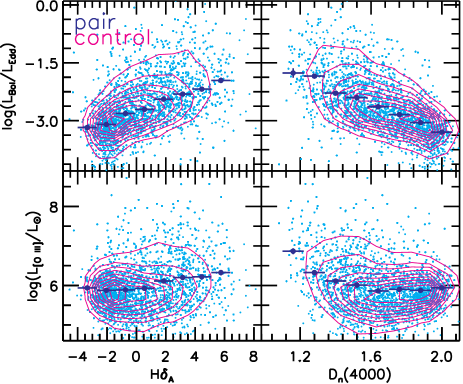
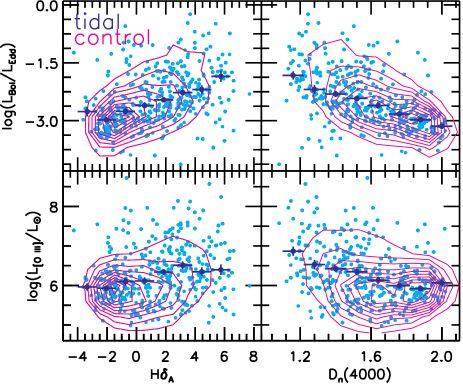
Figure 3 shows H and as functions of and for the pair and tidal samples. Here and throughout, the error bars denote 1- uncertainties in the medians. For AGN pairs with tidal features, both H and are significantly correlated with , despite having a large scatter. Spearman correlation tests show that the probability of null correlation between H () and is (). The correlation probabilities quoted are estimated from the individual data points directly. Pairs with smaller projected separations on average exhibit stronger recent starburst activity and younger mean stellar ages. Compared to the control AGN sample matched in redshift and stellar mass distributions, AGN pairs with tidal features on average have larger H and (median values of and compared to and ). The enhancement becomes significant ( above the control) for objects with 10– h kpc (i.e., logh kpc) –). In a sample of star-forming galaxies from SDSS DR4 (Adelman-McCarthy et al., 2006), Brinchmann et al. (2004) find that anti-correlates with specific star formation rate (SSFR) measured from optical emission lines. Objects with the smallest separation in our sample ( h kpc) have median , corresponding to log according to the calibration of Brinchmann et al. (2004). This is dex higher444This enhancement is reduced to dex if we adopt the calibration using mean instead of median values (Figure 11 of Brinchmann et al., 2004). than the SSFRs inferred for the control sample (with median , corresponding to log of ).
We detect a similar dependence of H () on in the parent population of all AGN pairs (i.e., regardless of the detection of tidal features). This suggests that the -dependence of H () is robust against biases from the requirement of tidal features. However, the difference between the median and overall H () distributions of the pair and control samples is much smaller than that between the tidal and control samples, most likely due to contamination from large-separation AGN pairs that are not yet interacting. On the other hand, our results seem to suggest that AGN pairs with tidal features show enhanced recent star formation at separations as large as h kpc. Another possibility for this apparent enhancement at large separations is that AGN pairs with tidal features by construction are biased toward interacting systems with recent or more pronounced star formation because younger stellar streams have higher surface brightness.
In the tidal sample, we find no significant dependence of H () on , after excluding small values of ( km s-1) which are dominated by redshift measurement uncertainties. Spearman correlation tests show that the probability of null correlation between H () and is 0.72 (0.25). In the pair sample, we detect a weak dependence () of H () on , such that pairs with smaller velocity offsets exhibit stronger recent starburst activity and younger mean stellar ages.
A caveat is that H and are measured based on SDSS fiber spectra, which are subject to aperture bias due to the radial variation of star formation within galaxies (e.g., Brinchmann et al., 2004). At the smallest and largest redshifts of our sample ( and 0.16), the 3′′ fiber corresponds to 1.2 kpc and 8.3 kpc, respectively, in the assumed cosmology. However, the distribution at any fixed redshift after correction for spectroscopic incompleteness does not depend significantly on redshift over the range considered, and therefore our results on the dependence are robust against aperture bias. Repeating our analysis using SSFR estimates corrected for aperture bias (Brinchmann et al., 2004) provided in the MPA-JHU DR7 data product gives results consistent with those above555The correction is made by applying the SSFR distribution at any given and color to SDSS photometry outside the fiber (Brinchmann et al., 2004). We use these estimates for verification purposes only, and take the directly measured spectral indices (after subtracting emission lines) as our baseline values because they are less prone to population-dependent bias (e.g., Salim et al., 2007)..
We must caution that our results are limited to h kpc. Our sample is incomplete at h kpc (see Paper I for details), because pairs with angular separations smaller than will not be resolved by the deblending algorithm of SDSS photometry and therefore will not be included in our sample; at , i.e., the highest redshift bin of our sample, this corresponds to h kpc. We estimate that the incompleteness level due to this resolution limit at h kpc is –5% (due to the highest redshift bin around ), according to the number of smaller separations pairs (–5 h kpc) resolved at lower redshift in our sample assuming that the distribution around h kpc does not vary with redshift. This incompleteness level increases with decreasing , and it reaches % at h kpc (i.e., the physical scale corresponding to at , the lower redshift boundary of our sample).
3.1.2 Black Hole Accretion
We now address how galaxy tidal interactions affect BH accretion in the early stage of mergers in AGN pairs, and compare these effects with that of recent star formation to constrain their causal relationship. We adopt the [O III] 5007 emission-line luminosity and the inferred Eddington ratio () as indicators of BH accretion activity. We calculate based on fluxes provided in the MPA-JHU catalogue from Gaussian fits of continuum-subtracted emission-line spectra. The forbidden line [O III] 5007 arises from the narrow-line region666We have subtracted the contribution from star formation to based on the position on the BPT diagram (Baldwin et al., 1981; Veilleux & Osterbrock, 1987) which features the diagnostic emission-line ratios [O III] 5007/H and [N II] 6584/H, following the empirical method of Kauffmann & Heckman (2009). This approach constructs composite objects using a linear combination of the spectra of pure star-forming galaxies and pure AGNs. Templates of pure star-forming galaxies are made with objects located at the lower edge of the star-forming sequence, whereas pure AGNs are built using those located at the farthest ends of the Seyfert and LINER regimes. Trajectories on the diagnostic diagram are then produced from the constructed composites (Kauffmann & Heckman, 2009)., and its luminosity is correlated with broad-band continuum luminosities in unobscured AGNs (e.g., Kauffmann et al., 2003a; Reyes et al., 2008; Shen et al., 2011b), albeit with a significant scatter (e.g., 0.36 dex in the correlation with ; Reyes et al., 2008). Heckman et al. (2005) found that [O III] 5007 luminosity correlates well with the 3–20 keV luminosity with a dynamic range in luminosity of 4 dex in a sample of 47 hard X-ray selected local AGNs. To infer bolometric AGN luminosity , we use uncorrected for dust extinction and the appropriate bolometric correction factor (3500; Heckman et al., 2005; Liu et al., 2009; Shen et al., 2011b). We do not correct for dust extinction from the hosts in view of the uncertainties in the assumed reddening laws, which rely on over-simplified dust-screen models (e.g., Reyes et al., 2008). For the Eddington luminosity, we adopt a BH mass () inferred from the stellar velocity dispersion () measured from the SDSS spectrum, assuming the – relation observed in local inactive galaxies (e.g., Ferrarese & Merritt, 2000; Gebhardt et al., 2000) and calibrated by Tremaine et al. (2002). As we will discuss below, this is likely an overestimate of the true mass for small-separation AGN pairs due to the effects of tidal interactions on the internal kinematics of the host stellar populations.
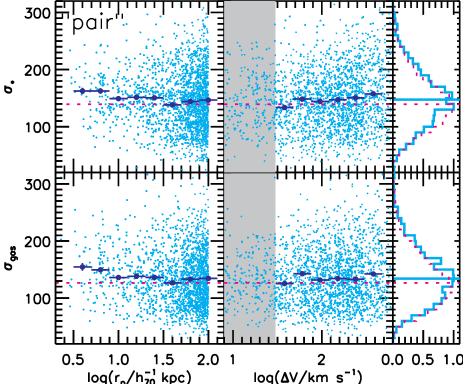
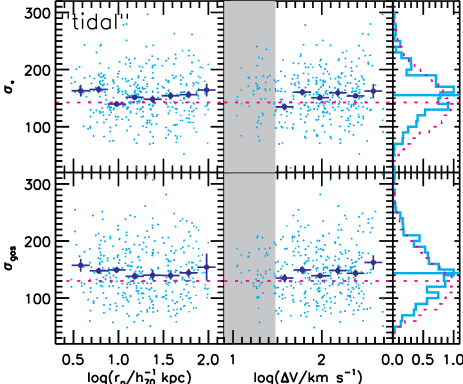
Figure 4 shows [O III] 5007 luminosity and Eddington ratio as functions of and . In the tidal sample, the strength of BH accretion activity increases with decreasing . There is also a similar dependence seen with after excluding small values ( km s-1) which are dominated by redshift measurement uncertainties. Spearman correlation tests show that the probability of null correlation between () and is (). These weak correlations are not as significant as those found between recent star formation indicators and . The enhancement in AGN activity is significant for objects with – h kpc (i.e., logh kpc) –). Objects with the smallest separation in our sample ( h kpc) have median log(/) and log() values and dex larger than the median values of the control AGNs. AGN pairs with tidal features on average exhibit accretion activity stronger by 0.2–0.3 dex than control AGNs matched in redshift and stellar mass distributions.
In the pair sample we detect a similar dependence of () on . This verifies that the -dependence result is robust against biases from our identification of tidal features. However, the differences in the median value and distribution of () between the pair and control samples are much smaller than those between the tidal and control samples. The dependences of and on are less prominent than that of recent star formation shown in Figure 3, and therefore can be more difficult to detect.
Figure 5 shows that at small (–30 h kpc) is on average larger than that of large separation pairs and the median value of control AGNs by km s-1 in both the pair and tidal samples. The stellar mass and effective radius are independent of . Therefore the larger cannot be due to deeper potentials; it is most likely the effect of the interactions with the transformation of orbital into internal energy. As a result, the inferred BH mass is likely overestimated by dex on average, and by extension, the enhancement of with decreasing is likely underestimated by dex in AGN pairs with the smallest separations in our samples. We see a similar enhancement in gas velocity dispersion (measured from Gaussian fits to the forbidden emission lines) as well (Figure 5).
Because the redshift distribution corrected for spectroscopic incompleteness at any fixed does not depend significantly on (Paper I), our results involving luminosities are robust against redshift-induced biases. Repeating our analysis using [O III] 5007 equivalent width (EW) as an indicator of BH accretion yields consistent results. Another caveat is that the [O III] 5007 fluxes are based on SDSS fiber spectra and could therefore be subject to aperture bias (see the discussion at the end of §3.1.1). The typical size of the narrow-line regions of lower-luminosity AGNs is several hundred parsecs, which is smaller than the aperture size of objects with the lowest redshift in the sample, and therefore the bulk of narrow-line region [O III] 5007 emission should be included in the fiber spectra of all objects in the sample. In addition, we have verified that the distribution of separations for h kpc at each redshift bin (after correction for spectroscopic incompleteness) does not vary significantly with redshift (over the range that we consider, i.e., ). Therefore, the correlations of the galaxy properties with are not affected by redshift dependent biases.
3.2. Dependence on Host-Galaxy Mass and Structure
We now address how host-galaxy internal properties regulate the effects of tidal interactions on recent star formation and AGN activity in AGN pairs. We examine the role of mass ratio in §3.2.1 and that of galaxy structure (as indicated by concentration index) in §3.2.2. We focus on the dependence of recent star formation and BH accretion as a function of .
3.2.1 Effect of Host-Galaxy Mass Ratio: Major versus Minor Mergers
Mergers and close interactions (hereafter mergers for short) of galaxy pairs with comparable masses (so called “major mergers”) as a driver for star formation and AGN activity have been the topic of extensive theoretical and observational research (e.g., see reviews by Barnes & Hernquist, 1992; Struck, 2006). It is generally accepted that major mergers of gas-rich spirals are responsible for the most luminous starburst galaxies, including the nearby ultra-luminous infrared galaxies (Sanders et al., 1988; Hernquist, 1989; Mihos & Hernquist, 1996) and sub-millimeter galaxies at higher redshifts (Blain et al., 2002; Conselice et al., 2003; Tacconi et al., 2008). Minor mergers are more frequent than major mergers. At there is evidence that minor mergers may play a dominant role in inducing moderate star formation in early-type galaxies (Kaviraj et al., 2011) and in driving the structural evolution of intermediate-mass galaxies (López-Sanjuan et al., 2010). It is still debated whether major or minor mergers or internal instabilities are the primary triggers for various AGN populations (for a review see Jogee, 2006).
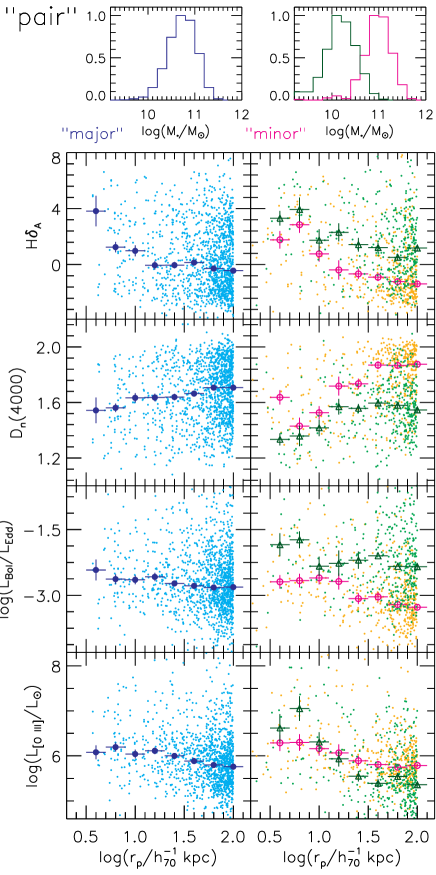
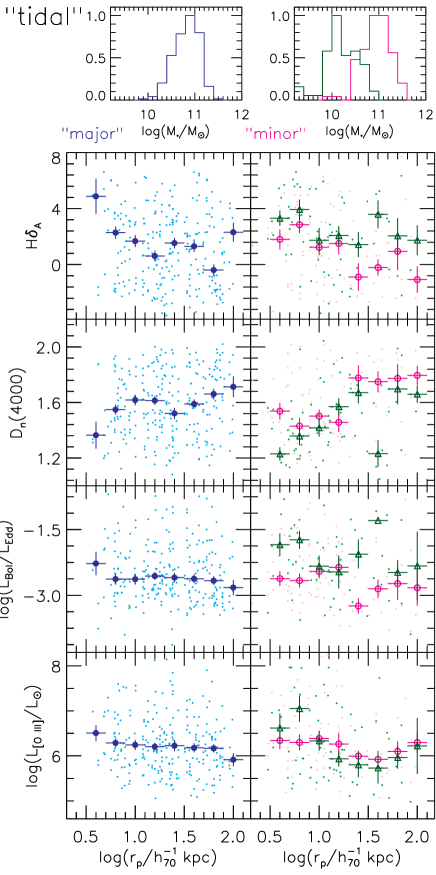
We divide the our AGN pair samples into major and minor mergers, i.e., with stellar mass ratios smaller and larger than , respectively. The stellar mass ratios of our sample span the range , where denotes the stellar mass of the primary and is that of the secondary galaxy. 38% of our AGN pairs have mass ratios smaller than 3. The sample is incomplete for pairs with mass ratios larger than 10, because of the limited dynamical range of the parent spectroscopic galaxy sample.
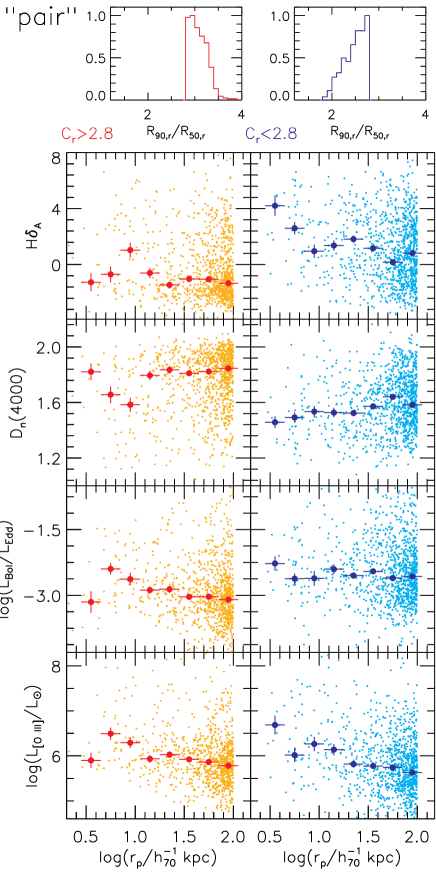
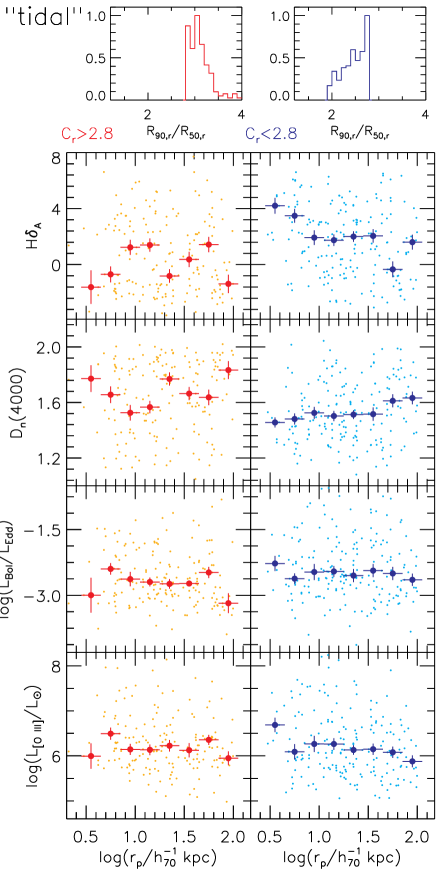
Figure 6 shows the recent star formation and AGN indicators as functions of for major and minor mergers for the pair and tidal samples. In the pair sample, galaxies in major mergers have median stellar masses of , whereas the primary and secondary of minor mergers have median stellar masses of and , respectively. We observe a dependence of host recent star formation and AGN activity on in both major and minor mergers. In minor mergers, we detect and enhancement of recent star formation and AGN activity indicators at small in both the primary and secondary galaxies. AGN pairs with separations of h kpc have median SSFRs that are larger than those with separations of h kpc (approaching the case of control samples of single AGNs) by , , and dex (with typical uncertainties of 0.2 dex) in major, minor-primary, and minor-secondary galaxies respectively, based on the SSFR- calibration of Brinchmann et al. (2004). The enhancement level of median () in AGN pairs from to h kpc is 0.4, 0.5, and 1.2 dex (0.4, 0.6, and 0.7 dex) for major, minor-primary, and minor-secondary galaxies, respectively, with typical uncertainties of 0.2, 0.4, and 0.3 dex. The most notable difference between the secondary and primary in minor mergers is that the enhancement level of median from to h kpc is significantly higher in the secondary than in the primary galaxy. The difference between the secondary and primary in the enhancement of is less significant, although we find that the enhancement of is larger in the secondary than in the primary which may cause to be more severely underestimated (see the discussion at the end of §3.1.2). In the tidal sample, we find similar results to those in the pair sample, except that there is a significantly larger enhancement of in the secondary than in the primary of minor mergers. We discuss the implications of these results in §4.
3.2.2 Effect of Host-Galaxy Structure: Bulge versus Disk Mergers
The distribution of mass within galaxies regulates when gravitational instabilities are induced in galaxy tidal interactions. Simulations of major mergers of disk galaxies show that a dynamically hot bulge component stabilizes a disk against bar instability, thus delaying merger-induced activity (Mihos & Hernquist, 1996). We address whether such an effect is present in AGN pairs. We use the -band concentration index, , as a measure of mass distribution. Strateva et al. (2001) have shown that correlates with galaxy morphological type albeit with a large scatter (see also Shimasaku et al., 2001); elliptical galaxies have larger than do spirals. for a pure de Vaucouleurs elliptical whereas for a pure exponential disk. In particular, Strateva et al. (2001) have found that a value of divides early- and late-type galaxies with a reliability of 83% for each and with completeness of 70% and 80%, respectively. As shown in Figure 7, the distribution of our AGN pair samples is close to being a Gaussian with a median value of , and lies in the intermediate region between early- and late-type galaxies. We divide the AGN pair galaxies into those with and those with (each component in a pair is treated separately).
We first examine how host-galaxy structure regulates the effects of tidal interactions on host star formation in AGN pairs. Figure 7 shows the dependence of recent star formation and AGN activity indicators on for early- and late-type galaxies in the pair and tidal samples, respectively. In both samples we find a clear dependence of host star formation indicators on in AGNs with late-type host galaxies. From to h kpc, the median SSFR values are enhanced by dex in AGNs with late-type hosts, according to the SSFR- calibration of Brinchmann et al. (2004). In AGNs with early-type hosts, however, the trend is much less prominent. In the pair sample, neither H and show much dependence on until h kpc, whereas the dependence becomes prominent starting at h kpc in late-type hosts. In the tidal sample, there is little dependence of H and on . Our comparison between the early- and late-type hosts of AGN pairs suggest that tidally enhanced star formation happens earlier and more prominent in late- than in early-type hosts of AGN pairs.
We now assess how host-galaxy structure regulates the effects of tidal interactions on BH accretion in AGN pairs. As shown in Figure 7, the median () value increases with decreasing in AGNs with both early- and late-type host galaxies in both the pair and tidal samples. In the pair sample, the median value increases from to h kpc by 0.70.1 dex (1.00.1 dex) of AGNs with early-type (late-type) hosts, respectively (here we neglect the smallest bin in early-type hosts to focus on the overall trend). The increase of the median value seems less prominent: 0.70.1 dex (0.40.1 dex) for AGNs in early-type (late-type) hosts. However, the enhancement of could be underestimated because , and by extension , is likely overestimated for AGN pairs with small separations (Figure 5); late-type hosts show more enhancement. We detect similar trends in the tidal sample. The different levels of median enhancement in AGNs with early- and late-type hosts suggest that AGNs with late-type hosts are more subject to tidally enhanced BH accretion than those with early-type hosts.
We have verified that the trend we see in the early and late-type hosts of AGN pairs in indeed due to the difference in their concentration rather than a mass selection effect. First, we compared the stellar masses of the and the samples (here we quote the numbers for the pair sample) and found that they defer by only 0.2 dex on average; their stellar mass distributions are consistent with being Gaussian distributions, with the sample having a median mass of 10.81 (in units of log) and a standard deviation of 0.34, and the sample having a median stellar mass of 10.62 and a standard deviation of 0.43. This 0.2 dex difference is much smaller than that between the primaries and secondaries ( dex) in minor merger pairs (§3.2.1). While the sample has on average larger stellar masses than the sample (as expected due to the mass-concentration correlation), the stellar mass difference seems to be too small to be the dominant factor of the trend we see. Second, to test whether the effect of this small mass difference is indeed minor, we redid our analysis using subsets of the and the samples matched in stellar mass distribution. The trend was still present, verifying that it was indeed due to concentration effect rather than a mass selection effect.
3.3. Correlations between the Interacting Components in an AGN Pair
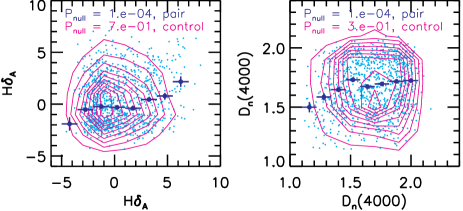
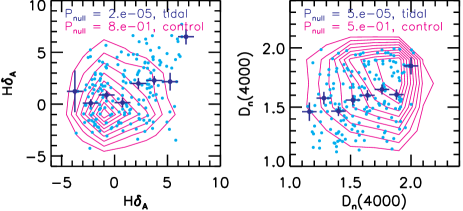
In this section we examine the correlations between the two interacting components in each AGN pair. The statistical sample of AGN pairs presented in Paper I allows us to address whether there is a correlation in the strength of BH accretion between the interacting components. We show in Figure 8 the correlations in indicators of recent star formation between the interacting components for the pair and tidal samples. We plot H () of one component (randomly pulled from the two) against that of the other component in an interacting pair. Also shown for comparison are density contours from control AGNs. We draw control samples of AGNs for both components, each of which is matched in redshift and stellar mass distributions to one component of the AGN pairs. The two control samples are then randomly “paired” with the requirement that each control “pair” has a LOS velocity offset smaller than 600 km s-1, although our results remain the same without this constraint. As shown in Figure 8, there is no correlation between the two components in the control sample; Spearman null probabilities are close to 1. We have run 1000 Monte Carlo simulations for the control sample and verified that the Spearman correlation probabilities shown in Figure 8 are typical. For the pair and tidal samples, on the other hand, we detect a statistically significant correlation between the recent star formation indicators of the interacting galaxies. Spearman tests show the probability of null correlation is () in H () for the pair sample; the null probability is even smaller for the tidal sample, () in H (). There is a substantial scatter in the correlations though. The correlations seen in Figure 8 for AGN pairs are reminiscent of the color correlation seen between inactive galaxy pairs (the Holmberg effect; e.g., Holmberg, 1958; Madore, 1986; Kennicutt et al., 1987), which is generally accepted as evidence for merger-induced star formation (e.g., Laurikainen & Moles, 1989).
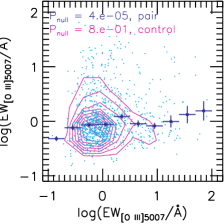
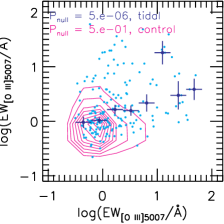
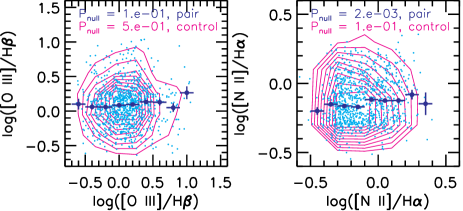
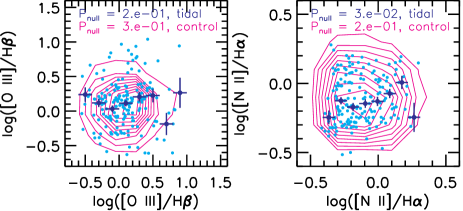
We now address whether there is an effect in BH accretion activity similar to that observed in recent star formation. To avoid selection bias due to the common distance moduli in a pair in a flux-limited sample, here we adopt the rest-frame [O III] 5007 equivalent width (EW) as an indicator of BH accretion, instead of [O III] 5007 luminosity or Eddington ratio. Figure 9 shows the [O III] 5007 EW of one component (randomly pulled from each AGN pair) as a function of that of the other component in the pair for the pair and tidal samples. In the pair sample, we detect a statistically significant correlation in the [O III] 5007 EW, although the scatter is significant ( dex); the Spearman null probability is . The correlation in the tidal sample is even stronger, with a null probability of . We find no correlation between [O III] 5007 EWs of the two components in the control samples; the Spearman null probabilities are close to 1. The correlation of AGN activity between the two components in an AGN pair suggests that there is tidally enhanced AGN activity in both components. Alternatively, a single active SMBH ionizing both galaxies could also produce such a correlation, at least for the subset of AGN pairs with separations smaller than galaxy sizes. The latter scenario is unlikely, however, as we find no significant correlation777There is a tentative correlation of [N II]/H in both the pair and tidal samples, which could be due to the tidal effect on the gas-phase metallicity observed in inactive galaxy pairs (e.g., Ellison et al., 2008). in the diagnostic emission-line ratios [O III]/H 888The [O [O III]/H ratios have not been corrected for contributions from star formation. The results show no significant change when [O III] is corrected for star formation. between the interacting components as shown in Figure 10, suggesting that the two components are not powered by the same central engine.
3.4. Correlations between Recent Star Formation and Black Hole Accretion
AGN luminosity is correlated with H and in the host galaxies of AGNs, in the sense that the hosts of higher-luminosity AGNs have younger stellar populations and higher starburst fractions in the last 0.1-1 Gyr (e.g., Kauffmann et al., 2003a; Netzer, 2009; Liu, 2010). Here we address whether AGN luminosity is correlated with recent star formation in hosts in AGN pairs, and how such a correlation, if present, compares to that in ordinary AGNs.
Figure 11 displays and as a function of H and for the pair and tidal samples. Also shown for comparison are contours from control AGN samples matched in redshift and stellar mass distributions. There is a correlation between and H () when H () for the pair sample and when H () for the tidal sample, respectively. is also correlated with H and for both samples, although at least part of the correlation is driven by the mass dependence of both (and by extension ) and H (). The relation between AGN luminosity and H () of the pair sample is almost identical to that of the control AGN sample. While the tidal sample occupies a similar scaling relation between AGN luminosity and H () to that of the control sample, it is skewed towards higher AGN luminosities and larger starburst fractions (younger mean stellar ages).
4. Discussion
We discuss implications of our results on tidally enhanced star formation and BH accretion. We compare our results with previous observations of inactive galaxy pairs and of single AGNs in galaxy pairs in §4.1, and to predictions from galaxy merger simulations in §4.2.
4.1. Comparison with Observations of Galaxy Interactions
4.1.1 Tidally Enhanced Star Formation
We have detected a correlation between H (and ) and projected separation in AGN pairs; systems with smaller separations have larger H and smaller indicative of higher SSFRs, with the enhancement becoming significant for – h kpc (Figure 3). We also find a weak correlation between H (and ) and in both our tidal and pair samples, after excluding small values of which are dominated by redshift measurement errors. These results are in broad agreement with previous findings based on statistical samples of inactive galaxy pairs (Barton et al., 2000; Lambas et al., 2003; Alonso et al., 2004; Nikolic et al., 2004; Ellison et al., 2008; Li et al., 2008a; Darg et al., 2010a). For example, in a volume-limited sample of 12,492 main galaxies from the SDSS DR1 (Abazajian et al., 2003) selected to have photometric companions within 300 kpc, Nikolic et al. (2004) used SFRs inferred from H luminosities to find that the mean SSFR is significantly enhanced for h kpc. These authors also find a weak anti-correlation between SSFR and recessional velocity difference (see also Lambas et al., 2003). Similarly, Ellison et al. (2008) found an enhancement in the star formation rates of galaxy pairs at 30–40 h kpc in a study of 1716 emission-line galaxies selected from the SDSS DR4 (Adelman-McCarthy et al., 2006) with companions within km s-1, h kpc, and stellar mass ratios smaller than 10.
The average SSFR enhancement level we observe in AGN pairs is – dex from to h kpc. This is comparable to some previous estimates based on inactive galaxy pairs (e.g., factors of 1.5–4 from to kpc; Li et al., 2008a), but seems to be larger than others taken at face value (e.g., Alonso et al. 2004 and Darg et al. 2010a found an enhancement of a factor of 2). The variation in the observed enhancement levels may be due to differences in the galaxy samples studied. For example, the Alonso et al. (2004) results are based on galaxy pairs selected in galaxy groups or clusters with virial masses in the rage of – and therefore may be biased towards early-type galaxies. Indeed, we find tentative evidence that the star formation enhancement is more prominent and occurs at larger separations in late-type than in early-type galaxies (Figure 7). The variation in the observed enhancement levels may also be due to differences in the interaction stages examined. For example, the factor of 2 difference inferred by Darg et al. (2010a) refers to the average difference between their merger sample (including various separations hence interaction stages) and the control sample, which may be much smaller than the difference observed for small separation pairs. Other factors that may affect the observed level of enhancement include how control samples are defined and the contamination from closely separated galaxy pairs that are not tidally interacting.
We find that the enhancement level of recent star formation in AGN pairs with host stellar mass ratios (minor mergers or interactions) is comparable to (if not slightly smaller than) that in those with stellar mass ratios (major mergers or interactions), at least when the two galaxies are separated by more than h kpc. In addition, the relative enhancement level is similar in both the primaries and the secondaries in AGN pairs with stellar mass ratios . Similarly, Ellison et al. (2008) detected SFR enhancement in their sample of inactive galaxy pairs drawn from the SDSS whose stellar masses are within a factor of 10 of each other. On the other hand, based on 167 galaxy pairs drawn from the CfA2 Redshift Survey (Huchra et al., 1990, 1995), Woods et al. (2006) suggest that galaxies in major interactions are more likely to show enhanced star formation activity than those in minor interactions with absolute magnitude differences larger than 2. In a sample of 1204 galaxies in spectroscopic pairs and compact groups selected from the SDSS DR5 (Adelman-McCarthy et al., 2007), Woods & Geller (2007) find that in minor mergers the secondary, but not the primary shows tidally triggered star formation. On the other hand, in a study of 1258 spectroscopic galaxy pairs drawn from the 2dF survey (Colless et al., 2001), Lambas et al. (2003) find that in minor mergers the bright components are more likely to show tidally-enhanced star formation than the faint components. We speculate that these contradictory results could be due to difference in the galaxy samples studied, variation in their sample sizes, and criteria to define major and minor mergers. For example, we adopt stellar mass ratio in the current study (see also Ellison et al., 2008), whereas Lambas et al. (2003), Woods et al. (2006), and Woods & Geller (2007) employed the ratio of galaxy luminosities in their studies.
We caution that our conclusion, that recent star formation is enhanced in AGN pairs during the early merger stages, may not hold for all types of galaxies, given the inherent limitations of our sample selection. Low-redshift optical AGNs reside in galaxies with stellar mass, galaxy structure, and star formation properties intermediate between young disk-dominated and old bulge-dominated galaxies (e.g., Kauffmann et al., 2003a, c; Heckman et al., 2004). Whether tidal encounters enhance star formation in galaxies with all ranges of galaxy mass and structure is beyond the scope of this paper, although there is mounting evidence that the specific levels of star formation enhancement depend on interaction and/or progenitor properties (e.g., Bushouse, 1986; Bushouse et al., 1988; Bergvall et al., 2003; Brosch et al., 2004; Woods et al., 2006; Rogers et al., 2009).
4.1.2 Tidally Enhanced Black Hole Accretion
Previous statistical studies of galaxy pairs found evidence for a higher fraction of AGNs in paired than in isolated galaxies (Kennicutt et al., 1987; Alonso et al., 2007; Woods & Geller, 2007; Rogers et al., 2009; Ellison et al., 2011) whereas others detected no significant difference (Barton et al., 2000; Ellison et al., 2008; Li et al., 2008b; Darg et al., 2010a). We have found a correlation between [O III] 5007 luminosity (and Eddington ratio) and projected separation in AGN pairs; systems with smaller separations host more powerful AGNs and the enhancement becomes significant for – h kpc (Figure 4), although the enhancement is only moderate, which is –0.3 dex on average in luminosity/Eddington ratio relative to control samples and rises to –0.7 dex for the closest pairs in our sample ( h kpc). We find that the relative enhancement in AGN luminosity from to h kpc is higher in the secondary than in the primary in AGN pairs with stellar mass ratios . Such a difference may be driven by the fact that less massive galaxies on average have higher gas fractions, or that they are more prone to gravitational instabilities. The offset Seyfert 2 nucleus in the minor merger system NGC 3341 discovered by Barth et al. (2008) may be a manifestation of the same effect, where the BH in the secondary is experiencing much more accretion than that in the primary.
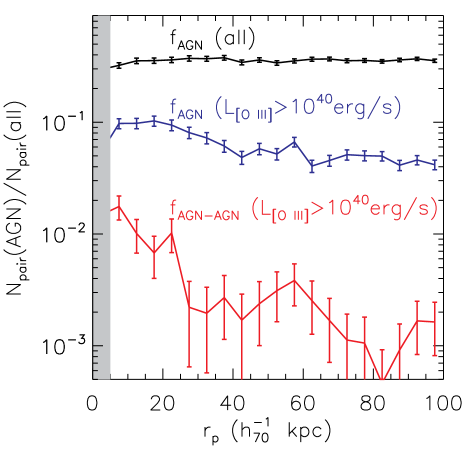
We discuss several reasons why the causal link between galaxy interactions and AGN activity has been controversial. First, the merger-AGN connection seems to depend sensitively on AGN luminosity. For example, Serber et al. (2006) analyzed close neighbors of SDSS quasars at with median erg s-1 and found that they reside in higher local ( kpc) over-density regions than do normal galaxies. In a much lower AGN luminosity regime (median erg s-1), Li et al. (2006) studied cross correlations of narrow-line AGNs with galaxies at from the SDSS DR4 (Adelman-McCarthy et al., 2006), and found that on scales kpc, AGNs cluster marginally more strongly than control samples of inactive galaxies matched in redshift, stellar mass, concentration, velocity dispersion, and mean stellar age, whereas they cluster more weakly than inactive galaxies on 0.1–1 Mpc scales, and cluster similarly on scales larger than a few Mpc. The AGN luminosity regime we are probing here is similar to that of Li et al. (2006). As we show in Figure 12, the fraction of galaxy pairs hosting either single or double AGNs999To make a fair comparison with the Li et al. (2006) clustering results, we adopt the same AGN diagnostic criteria here, i.e., AGNs according to the Kauffmann et al. (2003a) empirical curve with all four emission lines detected with S/N. among all galaxy pairs shows no significant dependence on from h kpc to h kpc for all AGNs. This is consistent with the clustering results of Li et al. (2006). On the other hand, if we consider only the stronger AGNs (e.g., erg s-1 corresponding to erg s-1), rises prominently with decreasing for h kpc, with a factor of () increase from h kpc to h kpc for those hosting either single or double (those hosting double) AGNs. This comparison suggests that the overall increase we have detected in AGN luminosity/Eddington ratio in close AGN pairs is a result of tidally enhanced BH accretion events on top of a background of weak AGN events driven by secular processes not associated with interactions.
Second, the correlation we detect for AGN luminosity is not as prominent and significant as for indicators for recent star formation. Therefore we speculate that small samples of AGN pairs with tens of objects or even fewer may simply be insufficient to reveal such a weak correlation. In addition, the difference between the overall distributions of AGN indicators in the pair and control samples is smaller than that in the tidal sample (Figure 4). Thus, the effects of tidal interactions on AGN activity may be underestimated due to contamination by closely separated galaxy pairs that are not undergoing tidal interactions. Furthermore, we have drawn control samples with identical redshift and stellar mass distributions. Because galaxy interactions also enhance star formation activity, their effects on AGN activity may be underestimated if control samples are matched in color or in stellar age, as was done in the clustering analysis of Li et al. (2006). Finally, the enhancement in AGN activity we observe becomes prominent only when studied as a function of separation and when is sufficiently small (–30 h kpc). As a result, the effect will not be detectable in samples of galaxy pairs dominated by larger-separation systems. For example, Darg et al. (2010a) find tentative evidence for a slightly higher AGN fraction in mergers identified for tidal features using SDSS images at later stages (32% at kpc) than at earlier stages (23% at kpc), even though these authors find little overall evidence for increased AGN activity in galaxy mergers.
We caution that the correlation between AGN luminosity and projected separation and that of [O III] EW between the interacting components in an AGN pair support the hypothesis that galaxy tidal interactions enhance AGN activity, but do not directly test whether all AGNs are triggered in or associated with galaxy interactions. Galaxy interactions may not be a necessary condition to trigger AGNs – secular processes may suffice at least for low-luminosity AGNs; nor is it a sufficient condition – there are internal conditions that need to be fulfilled such as the presence of ample quantities of gas. Whether galaxy interactions enhance AGN activity, and whether it is a sufficient condition to trigger AGNs are two separate issues.
4.1.3 Is There A Time Delay between the Tidally-induced AGN and Star Formation Activity?
To reconcile the elusive link between AGN activity and galaxy interactions found by some authors with the definitive connection between star formation and interactions, it has been suggested that there is a considerable time delay (–1 Gyr) between the interaction-induced star formation and AGN activity (e.g., Sanders et al., 1988; Li et al., 2008b; Ellison et al., 2008; Schawinski et al., 2010). For our AGN pairs, the values of below which the enhanced AGN and recent star-formation activity becomes significant are similar, –30 h kpc. This suggests that there is no significant time delay between the onset of interaction-enhanced AGN and star formation activity. However, as our sample does not probe the peak epoch of interaction-induced activity, which is likely at later stages with much smaller nuclear separations than is probed by our sample, we cannot rule out a considerable time delay between the peak or overall average epochs of tidally induced star formation and AGN activity. A statistical sample of AGN pairs with smaller separations is needed to better understand the tidal effects close to the peak epoch of the induced activity. A complementary approach to identifying AGN pairs (Liu et al., 2010a; Shen et al., 2011a; McGurk et al., 2011; Fu et al., 2011) based on the selection of AGNs with double-peaked narrow emission lines (e.g., Heckman et al., 1981; Zhou et al., 2004; Comerford et al., 2009; Wang et al., 2009; Liu et al., 2010b; Smith et al., 2010) combined with follow-up spatially resolved near-IR (NIR) imaging and optical/NIR spectroscopy is more sensitive to smaller separation pairs ( a few kpc).
4.2. Comparison with Simulations of Galaxy Mergers
Our results are in broad agreement with the picture in which galaxy-galaxy interactions induce substantial gas inflows which in turn promote star formation and AGN activity (e.g., Noguchi & Ishibashi, 1986; Hernquist, 1989; Mihos & Hernquist, 1996; Perez et al., 2006), although our sample only probes the low-luminosity regime. Current simulations cannot resolve the scales relevant for star formation, AGN feeding, and stellar feedback, and thus employ simplified recipes and assumptions to model star formation and the radiated AGN luminosity using galaxy properties on larger scales. Nevertheless, simulations suggest that, depending on progenitor properties and orbital parameters, the enhancement of star formation activity due to tidal effects may vary from levels as low as about twice the isolated case to values typical of starburst galaxies (20–60 times the isolated case) and the peak occurs during the interpenetrating phases (e.g., Di Matteo et al., 2007). The enhancement of recent star formation activity we observe (0.7–0.9 dex from to h kpc) is at the upper end of simulation predictions at the first close passage (1 to 4–5 times the isolated case; Di Matteo et al., 2007). The enhancement in AGN luminosity we observe ( dex in from to h kpc; Figure 4) is comparable to the prediction from numerical simulations (e.g., dex higher in SMBH accretion rate just after the first passage than the isolated case; Springel et al., 2005b).
Numerical simulations of disk galaxies accreting dwarf satellites suggest that the primary disk galaxy develops a strong two-armed spiral pattern due to tidal perturbation from the infalling satellite, which drives substantial gas into the center and may fuel starburst activity (Mihos & Hernquist, 1994; Hernquist & Mihos, 1995). On the other hand, Cox et al. (2008) find very little, if any, induced star formation for disk mergers with mass ratios larger than , especially for galaxies with significant bulge components. The host galaxies in our samples of AGN pairs typically contain substantial bulge components, so our detection of enhanced recent star formation activity in AGN pairs with stellar mass ratios is in mild conflict with the prediction of Cox et al. (2008). This discrepancy could be due to differences in the host-galaxy properties such as mass and structure and interaction orbital properties. Our results are based on a special subset of all galaxy pairs, i.e., those in which both galaxies are AGNs. The simulations are not examing this subset exclusively, so that it is not a fair comparison. Alternatively it could point to the importance of physical processes neglected in simulations (e.g., recycled gas from stellar winds and supernovae; Ciotti & Ostriker, 2007). Simulations with more tailored host-galaxy and interaction parameters may provide useful clues to discriminate between these possibilities.
Simulations of disk galaxies with comparable masses suggest that the presence of dense central bulges delays the onset of gravitational instability, and gaseous inflows are weaker and occur earlier in bulgeless galaxies (Mihos & Hernquist, 1996). Our result, that the star-formation enhancement is larger and becomes significant earlier (i.e., at larger ) in late-type than in early-type hosts of AGN pairs, broadly supports this hypothesis. The observed difference is small, however, probably due to the limited range of interaction phases spanned in our sample. Again, a statistical sample of AGN pairs with smaller separations is needed to enlarge the dynamic range probed in separation.
5. Summary and Conclusions
We have studied recent star formation and BH accretion properties in the host galaxies of 1286 AGN pairs at and the subset of 256 pairs with unambiguous morphological tidal features, selected from the SDSS DR7 as described in Paper I. We have examined the effects of galaxy tidal interactions on AGN pairs calibrated against control samples of isolated AGNs matched in redshift and stellar mass. We have investigated the correlations between recent star formation and AGN activity and interaction parameters, the dependence of these correlations on host-galaxy properties, the correlation of star formation and AGN activity between the interacting components in each AGN pair, and the correlation between recent star formation and AGN activity in AGN pairs as compared to that observed in ordinary AGNs. Our main findings are summarized as follows.
-
1.
We have found that the strengths of the 4000 Å break and H absorption in the host galaxies depend on the projected separation in AGN pairs with tidal features. They also depend weakly on LOS velocity offset . AGN pairs with smaller () have smaller and larger H, which indicate younger mean stellar ages and a higher fraction of post-starburst populations in the past 0.1 Gyr. Assuming the SSFR- calibration of Brinchmann et al. (2004), the inferred median enhancement of specific star formation rates is 0.7– dex from to h kpc. The enhancement of recent star formation becomes significant ( above the isolated case) at – h kpc.
-
2.
We have found that the [O III] 5007 emission-line luminosity and the Eddington ratio (using to infer bolometric luminosity and adopting stellar velocity dispersion as an indicator for black hole mass assuming the calibration of Tremaine et al. 2002) depend on in AGN pairs with tidal features, although the significance is smaller and with the trend being less prominent than that seen for recent star formation. A weak dependence on is also detected. AGN pairs with smaller () on average have larger and higher Eddington ratios, and the median enhancement of (Eddington ratio) is dex ( dex) from to h kpc. The enhancement of AGN activity becomes significant at – h kpc. This moderate overall increase we have detected in AGN luminosity/Eddington ratio in close AGN pairs is a result of tidally enhanced BH accretion events on top of a background of weak AGN events driven by secular processes not associated with interactions.
-
3.
We have compared how the effects of tidal interactions on AGN pairs vary when we are restricted to pairs with tidal features or not. We have found that the dependence of recent star-formation/AGN activity on is present in AGN pairs in both cases. On the other hand, the difference between the pair and control AGN samples in their distributions of the examined BH accretion and host star formation properties is much smaller than that observed between the tidal and control samples. The discrepancy may be explained by contamination from closely separated pairs that are not tidally interacting; In addition, some AGN pairs without tidal features may indeed be interacting but are less affected by tidal effects, such as mergers involving more spheroidal components or those on retrograde orbits. Nevertheless, our results suggest that the effects of galaxy tidal interactions will be underestimated using overall properties of galaxy pairs selected solely based on projected separation and velocity offsets, in particular if the adopted pair separation threshold is substantially larger than – h kpc.
-
4.
We have explored how host-galaxy mass ratio and structure regulate the effects of tidal interactions in AGN pairs. We have found that, at h kpc, the relative enhancement level of star-formation activity in interacting AGN pairs with stellar mass ratios is comparable to those with comparable stellar masses () in both components. While the enhancement of AGN activity is observed in AGN pairs of stellar mass ratios as high as 10, the relative enhancement on average is more prominent in the secondary than in the primary AGN (e.g., dex compared to dex in the median value of , or dex compared to dex in the median value of Eddington ratio). We have detected no significant difference in the tidally enhanced activity when we divide the host galaxies according to their -band concentration index as a proxy for morphology, but there is a marginally larger enhancement for late-type hosts. In addition, there is tentative evidence that the threshold value below which the recent star-formation enhancement becomes significant is larger in late- than in early-type hosts. These results may reflect the stabilization effect of bulges as predicted by the Mihos & Hernquist (1996) galaxy merger simulations.
-
5.
We have observed a statistically significant correlation of recent star formation (indicated by H and ) between the interacting components in an AGN pair (albeit with a large scatter), similar to the color correlation known in inactive galaxy pairs. Similarly, we have detected a statistically significant correlation of AGN activity as indicated by [O III] 5007 rest-frame equivalent width between the two components in an AGN pair, although the scatter is significant.
-
6.
We have found a correlation between recent star formation and AGN luminosity in AGN pairs similar to that observed in control samples of ordinary AGNs. While AGN pairs follow the same scaling relation of control AGNs, their host galaxies exhibit younger mean stellar ages, higher starburst fractions, and host more powerful AGNs.
In this paper, we have examined the properties of AGN pairs and compared them with control samples of single AGNs to characterize the effects of tidal interactions. The effects that we have found are based on a special population of galaxy pairs in which the two central SMBHs are both active at the same time. More generally, galaxy pairs often host single or no AGNs. Are galaxy pairs hosting double AGNs intrinsically different from those hosting single or no AGNs (e.g., in terms of host galaxy, BH properties, and/or local or large-scale environments), or is the double-AGN phase universal to all galaxy tidal interactions? Is the triggering of both AGNs preferential to certain merger configurations, or are the two BHs just being turned on and off stochastically? In a subsequent paper, we will compare AGN pairs with galaxy pairs hosting single or no AGNs to answer these questions.
The analysis of AGN pairs as a function of separation or velocity offset as a proxy for merger stage presented here also needs to be extended to smaller pair separations (i.e., more advanced stages) and to higher redshifts, where the effects of mergers and close interactions are predicted to be even more dramatic. Recently there has been an increasing number of AGN pairs with a few kpc identified based on the selection of AGNs with double-peaked narrow emission lines (e.g., Heckman et al., 1981; Zhou et al., 2004; Comerford et al., 2009; Wang et al., 2009; Liu et al., 2010b; Smith et al., 2010) combined with follow-up spatially resolved near-IR (NIR) imaging and optical/NIR spectroscopy (Liu et al., 2010a; Shen et al., 2011a; McGurk et al., 2011; Fu et al., 2011) to discriminate between double AGNs and single AGNs with complex gas kinematics. This approach in principle can identify AGN pairs with separations as small as pc, i.e., down to the limit set by the intrinsic size of narrow line regions around single AGNs. At , i.e., close to the peak AGN epoch (e.g., Marconi et al., 2004; Hasinger et al., 2005), there have been studies on the local environments of single AGNs (e.g., Georgakakis et al., 2008; Montero-Dorta et al., 2009; Coil et al., 2009; Silverman et al., 2009, 2011) in the DEEP2 survey (Davis et al., 2003) or the zCOSMOS survey (Lilly et al., 2007; Scoville et al., 2007) using X-ray identification of AGNs based on Chandra observations in the AEGIS (Davis et al., 2007) or C-COSMOS (Elvis et al., 2009) field, although a statistical study of AGN pairs similar to the analysis present in this paper is still hampered by small galaxy sample size combined with the difficulty of resolving close pairs and of identifying tidal disturbance features. Future multi-object NIR spectrograph such as the MOSFIRE/Keck (McLean et al., 2008) combined with high resolution and deep imaging capability such as offered by the HST or ground-based adaptive optics facilities will enable observations of galaxy samples with sufficient statistical power, resolution, and sensitivity to perform a similar study of AGN pairs at .
References
- Abazajian et al. (2003) Abazajian, K., et al. 2003, AJ, 126, 2081
- Abazajian et al. (2009) Abazajian, K. N., et al. 2009, ApJS, 182, 543
- Adelman-McCarthy et al. (2008) Adelman-McCarthy, J. K., et al. 2008, ApJS, 175, 297
- Adelman-McCarthy et al. (2007) —. 2007, ApJS, 172, 634
- Adelman-McCarthy et al. (2006) —. 2006, ApJS, 162, 38
- Aihara et al. (2011) Aihara, H., et al. 2011, ApJS, 193, 29
- Alonso et al. (2007) Alonso, M. S., Lambas, D. G., Tissera, P., & Coldwell, G. 2007, MNRAS, 375, 1017
- Alonso et al. (2004) Alonso, M. S., Tissera, P. B., Coldwell, G., & Lambas, D. G. 2004, MNRAS, 352, 1081
- Bahcall et al. (1997) Bahcall, J. N., Kirhakos, S., Saxe, D. H., & Schneider, D. P. 1997, ApJ, 479, 642
- Baldwin et al. (1981) Baldwin, J. A., Phillips, M. M., & Terlevich, R. 1981, PASP, 93, 5
- Balogh et al. (1999) Balogh, M. L., Morris, S. L., Yee, H. K. C., Carlberg, R. G., & Ellingson, E. 1999, ApJ, 527, 54
- Barnes & Hernquist (1992) Barnes, J. E., & Hernquist, L. 1992, ARA&A, 30, 705
- Barth et al. (2008) Barth, A. J., Bentz, M. C., Greene, J. E., & Ho, L. C. 2008, ApJ, 683, L119
- Barton et al. (2000) Barton, E. J., Geller, M. J., & Kenyon, S. J. 2000, ApJ, 530, 660
- Bergvall et al. (2003) Bergvall, N., Laurikainen, E., & Aalto, S. 2003, A&A, 405, 31
- Blain et al. (2002) Blain, A. W., Smail, I., Ivison, R. J., Kneib, J., & Frayer, D. T. 2002, Phys. Rep., 369, 111
- Blanton et al. (2003) Blanton, M. R., Lin, H., Lupton, R. H., Maley, F. M., Young, N., Zehavi, I., & Loveday, J. 2003, AJ, 125, 2276
- Blanton et al. (2005) Blanton, M. R., et al. 2005, AJ, 129, 2562
- Brinchmann et al. (2004) Brinchmann, J., Charlot, S., White, S. D. M., Tremonti, C., Kauffmann, G., Heckman, T., & Brinkmann, J. 2004, MNRAS, 351, 1151
- Brinchmann & Ellis (2000) Brinchmann, J., & Ellis, R. S. 2000, ApJ, 536, L77
- Brosch et al. (2004) Brosch, N., Almoznino, E., & Heller, A. B. 2004, MNRAS, 349, 357
- Bruzual (1983) Bruzual, G. 1983, ApJ, 273, 105
- Bruzual & Charlot (2003) Bruzual, G., & Charlot, S. 2003, MNRAS, 344, 1000
- Bushouse (1986) Bushouse, H. A. 1986, AJ, 91, 255
- Bushouse et al. (1988) Bushouse, H. A., Werner, M. W., & Lamb, S. A. 1988, ApJ, 335, 74
- Ciotti & Ostriker (2007) Ciotti, L., & Ostriker, J. P. 2007, ApJ, 665, 1038
- Ciotti et al. (2010) Ciotti, L., Ostriker, J. P., & Proga, D. 2010, ApJ, 717, 708
- Coil et al. (2009) Coil, A. L., et al. 2009, ApJ, 701, 1484
- Cole et al. (1994) Cole, S., Aragon-Salamanca, A., Frenk, C. S., Navarro, J. F., & Zepf, S. E. 1994, MNRAS, 271, 781
- Colless et al. (2001) Colless, M., et al. 2001, MNRAS, 328, 1039
- Comerford et al. (2009) Comerford, J. M., et al. 2009, ApJ, 698, 956
- Conselice et al. (2003) Conselice, C. J., Chapman, S. C., & Windhorst, R. A. 2003, ApJ, 596, L5
- Conselice et al. (2009) Conselice, C. J., Yang, C., & Bluck, A. F. L. 2009, MNRAS, 394, 1956
- Cox et al. (2008) Cox, T. J., Jonsson, P., Somerville, R. S., Primack, J. R., & Dekel, A. 2008, MNRAS, 384, 386
- Daddi et al. (2010) Daddi, E., et al. 2010, ApJ, 714, L118
- Dahari (1984) Dahari, O. 1984, AJ, 89, 966
- Dahari (1985) —. 1985, ApJS, 57, 643
- Darg et al. (2010a) Darg, D. W., et al. 2010a, MNRAS, 401, 1552
- Darg et al. (2010b) —. 2010b, MNRAS, 401, 1043
- Davis et al. (2003) Davis, M., et al. 2003, in Society of Photo-Optical Instrumentation Engineers (SPIE) Conference Series, ed. P. Guhathakurta, Vol. 4834, 161–172
- Davis et al. (2007) Davis, M., et al. 2007, ApJ, 660, L1
- Di Matteo et al. (2007) Di Matteo, P., Combes, F., Melchior, A., & Semelin, B. 2007, A&A, 468, 61
- Di Matteo et al. (2005) Di Matteo, T., Springel, V., & Hernquist, L. 2005, Nature, 433, 604
- Djorgovski (1991) Djorgovski, S. 1991, in Astronomical Society of the Pacific Conference Series, Vol. 21, The Space Distribution of Quasars, ed. D. Crampton, 349–353
- Drory et al. (2004) Drory, N., Bender, R., & Hopp, U. 2004, ApJ, 616, L103
- Ellison et al. (2011) Ellison, S. L., Patton, D. R., Mendel, J. T., & Scudder, J. M. 2011, MNRAS, 1541
- Ellison et al. (2008) Ellison, S. L., Patton, D. R., Simard, L., & McConnachie, A. W. 2008, AJ, 135, 1877
- Elmegreen et al. (1993) Elmegreen, B. G., Kaufman, M., & Thomasson, M. 1993, ApJ, 412, 90
- Elvis et al. (2009) Elvis, M., et al. 2009, ApJS, 184, 158
- Faber et al. (1997) Faber, S. M., et al. 1997, AJ, 114, 1771
- Ferrarese & Merritt (2000) Ferrarese, L., & Merritt, D. 2000, ApJ, 539, L9
- Förster Schreiber et al. (2009) Förster Schreiber, N. M., et al. 2009, ApJ, 706, 1364
- Fu et al. (2011) Fu, H., Yan, L., Myers, A. D., Stockton, A., Djorgovski, S. G., Aldering, G., & Rich, J. A. 2011, ArXiv e-prints 1107.3564
- Gebhardt et al. (2000) Gebhardt, K., et al. 2000, ApJ, 539, L13
- Georgakakis et al. (2008) Georgakakis, A., Gerke, B. F., Nandra, K., Laird, E. S., Coil, A. L., Cooper, M. C., & Newman, J. A. 2008, MNRAS, 391, 183
- Graham (2004) Graham, A. W. 2004, ApJ, 613, L33
- Grogin et al. (2005) Grogin, N. A., et al. 2005, ApJ, 627, L97
- Hao et al. (2005) Hao, L., et al. 2005, AJ, 129, 1783
- Hasinger et al. (2005) Hasinger, G., Miyaji, T., & Schmidt, M. 2005, A&A, 441, 417
- Heckman et al. (2004) Heckman, T. M., Kauffmann, G., Brinchmann, J., Charlot, S., Tremonti, C., & White, S. D. M. 2004, ApJ, 613, 109
- Heckman et al. (1981) Heckman, T. M., Miley, G. K., van Breugel, W. J. M., & Butcher, H. R. 1981, ApJ, 247, 403
- Heckman et al. (2005) Heckman, T. M., Ptak, A., Hornschemeier, A., & Kauffmann, G. 2005, ApJ, 634, 161
- Hennawi et al. (2010) Hennawi, J. F., et al. 2010, ApJ, 719, 1672
- Hennawi et al. (2006) —. 2006, AJ, 131, 1
- Hernquist (1989) Hernquist, L. 1989, Nature, 340, 687
- Hernquist & Mihos (1995) Hernquist, L., & Mihos, J. C. 1995, ApJ, 448, 41
- Ho (2008) Ho, L. C. 2008, ARA&A, 46, 475
- Ho et al. (1997) Ho, L. C., Filippenko, A. V., & Sargent, W. L. W. 1997, ApJS, 112, 315
- Holmberg (1958) Holmberg, E. 1958, Meddelanden fran Lunds Astronomiska Observatorium Serie II, 136, 1
- Hopkins et al. (2006) Hopkins, P. F., Hernquist, L., Cox, T. J., Di Matteo, T., Robertson, B., & Springel, V. 2006, ApJS, 163, 1
- Hopkins et al. (2008) Hopkins, P. F., Hernquist, L., Cox, T. J., & Kereš, D. 2008, ApJS, 175, 356
- Huchra et al. (1995) Huchra, J. P., Geller, M. J., & Corwin, Jr., H. G. 1995, ApJS, 99, 391
- Huchra et al. (1990) Huchra, J. P., Geller, M. J., de Lapparent, V., & Corwin, Jr., H. G. 1990, ApJS, 72, 433
- Hutchings & Campbell (1983) Hutchings, J. B., & Campbell, B. 1983, Nature, 303, 584
- Jogee (2006) Jogee, S. 2006, in Lecture Notes in Physics, Berlin Springer Verlag, Vol. 693, Physics of Active Galactic Nuclei at all Scales, ed. D. Alloin, 143–+
- Kauffmann & Heckman (2009) Kauffmann, G., & Heckman, T. M. 2009, MNRAS, 397, 135
- Kauffmann et al. (2003a) Kauffmann, G., et al. 2003a, MNRAS, 346, 1055
- Kauffmann et al. (2003b) —. 2003b, MNRAS, 341, 33
- Kauffmann et al. (2003c) —. 2003c, MNRAS, 341, 54
- Kauffmann et al. (1993) Kauffmann, G., White, S. D. M., & Guiderdoni, B. 1993, MNRAS, 264, 201
- Kaviraj et al. (2011) Kaviraj, S., Tan, K., Ellis, R. S., & Silk, J. 2011, MNRAS, 84
- Keel et al. (1985) Keel, W. C., Kennicutt, Jr., R. C., Hummel, E., & van der Hulst, J. M. 1985, AJ, 90, 708
- Kennicutt & Keel (1984) Kennicutt, Jr., R. C., & Keel, W. C. 1984, ApJ, 279, L5
- Kennicutt et al. (1987) Kennicutt, Jr., R. C., Roettiger, K. A., Keel, W. C., van der Hulst, J. M., & Hummel, E. 1987, AJ, 93, 1011
- Kewley et al. (2001) Kewley, L. J., Dopita, M. A., Sutherland, R. S., Heisler, C. A., & Trevena, J. 2001, ApJ, 556, 121
- Khachikian (1987) Khachikian, E. Y. 1987, in IAU Symposium, Vol. 121, Observational Evidence of Activity in Galaxies, ed. E. E. Khachikian, K. J. Fricke, & J. Melnick, 65–+
- Kochanek et al. (1999) Kochanek, C. S., Falco, E. E., & Muñoz, J. A. 1999, ApJ, 510, 590
- Kormendy & Bender (2009) Kormendy, J., & Bender, R. 2009, ApJ, 691, L142
- Koss et al. (2010) Koss, M., Mushotzky, R., Veilleux, S., & Winter, L. 2010, ApJ, 716, L125
- Lambas et al. (2003) Lambas, D. G., Tissera, P. B., Alonso, M. S., & Coldwell, G. 2003, MNRAS, 346, 1189
- Lauer et al. (2005) Lauer, T. R., et al. 2005, AJ, 129, 2138
- Laurikainen & Moles (1989) Laurikainen, E., & Moles, M. 1989, ApJ, 345, 176
- Li et al. (2008a) Li, C., Kauffmann, G., Heckman, T. M., Jing, Y. P., & White, S. D. M. 2008a, MNRAS, 385, 1903
- Li et al. (2008b) Li, C., Kauffmann, G., Heckman, T. M., White, S. D. M., & Jing, Y. P. 2008b, MNRAS, 385, 1915
- Li et al. (2006) Li, C., Kauffmann, G., Wang, L., White, S. D. M., Heckman, T. M., & Jing, Y. P. 2006, MNRAS, 373, 457
- Lilly et al. (2007) Lilly, S. J., et al. 2007, ApJS, 172, 70
- Liu (2010) Liu, X. 2010, MNRAS, 406, L40
- Liu et al. (2010a) Liu, X., Greene, J. E., Shen, Y., & Strauss, M. A. 2010a, ApJ, 715, L30
- Liu et al. (2010b) Liu, X., Shen, Y., Strauss, M. A., & Greene, J. E. 2010b, ApJ, 708, 427
- Liu et al. (2011) Liu, X., Shen, Y., Strauss, M. A., & Hao, L. 2011, ApJ, 737, 101
- Liu et al. (2009) Liu, X., Zakamska, N. L., Greene, J. E., Strauss, M. A., Krolik, J. H., & Heckman, T. M. 2009, ApJ, 702, 1098
- López-Sanjuan et al. (2010) López-Sanjuan, C., Balcells, M., Pérez-González, P. G., Barro, G., García-Dabó, C. E., Gallego, J., & Zamorano, J. 2010, ApJ, 710, 1170
- Lotz et al. (2008) Lotz, J. M., et al. 2008, ApJ, 672, 177
- Lotz et al. (2011) Lotz, J. M., Jonsson, P., Cox, T. J., Croton, D., Primack, J. R., Somerville, R. S., & Stewart, K. 2011, ApJ accepted; ArXiv e-prints 1108.2508
- Madore (1986) Madore, B. F. 1986, in Astrophysics and Space Science Library, Vol. 122, Spectral Evolution of Galaxies, ed. C. Chiosi & A. Renzini, 97–101
- Marconi et al. (2004) Marconi, A., Risaliti, G., Gilli, R., Hunt, L. K., Maiolino, R., & Salvati, M. 2004, MNRAS, 351, 169
- McGurk et al. (2011) McGurk, R. C., Max, C. E., Rosario, D. J., Shields, G. A., Smith, K. L., & Wright, S. A. 2011, ApJ, 738, L2+
- McLean et al. (2008) McLean, I. S., Steidel, C. C., Matthews, K., Epps, H., & Adkins, S. M. 2008, in Society of Photo-Optical Instrumentation Engineers (SPIE) Conference Series, Vol. 7014, Society of Photo-Optical Instrumentation Engineers (SPIE) Conference Series
- Merritt et al. (2004) Merritt, D., Milosavljević, M., Favata, M., Hughes, S. A., & Holz, D. E. 2004, ApJ, 607, L9
- Mihos & Hernquist (1994) Mihos, J. C., & Hernquist, L. 1994, ApJ, 425, L13
- Mihos & Hernquist (1996) —. 1996, ApJ, 464, 641
- Mihos et al. (1992) Mihos, J. C., Richstone, D. O., & Bothun, G. D. 1992, ApJ, 400, 153
- Miller et al. (2003) Miller, C. J., Nichol, R. C., Gómez, P. L., Hopkins, A. M., & Bernardi, M. 2003, ApJ, 597, 142
- Montero-Dorta et al. (2009) Montero-Dorta, A. D., et al. 2009, MNRAS, 392, 125
- Moore et al. (1996) Moore, B., Katz, N., Lake, G., Dressler, A., & Oemler, A. 1996, Nature, 379, 613
- Mortlock et al. (1999) Mortlock, D. J., Webster, R. L., & Francis, P. J. 1999, MNRAS, 309, 836
- Myers et al. (2007) Myers, A. D., Brunner, R. J., Richards, G. T., Nichol, R. C., Schneider, D. P., & Bahcall, N. A. 2007, ApJ, 658, 99
- Netzer (2009) Netzer, H. 2009, MNRAS, 399, 1907
- Nikolic et al. (2004) Nikolic, B., Cullen, H., & Alexander, P. 2004, MNRAS, 355, 874
- Noguchi & Ishibashi (1986) Noguchi, M., & Ishibashi, S. 1986, MNRAS, 219, 305
- Norman & Scoville (1988) Norman, C., & Scoville, N. 1988, ApJ, 332, 124
- O’Donnell (1994) O’Donnell, J. E. 1994, ApJ, 422, 158
- Padmanabhan et al. (2004) Padmanabhan, N., et al. 2004, New Astronomy, 9, 329
- Perez et al. (2006) Perez, M. J., Tissera, P. B., Lambas, D. G., & Scannapieco, C. 2006, A&A, 449, 23
- Petrosian (1982) Petrosian, A. R. 1982, Astrofizika, 18, 548
- Reyes et al. (2008) Reyes, R., et al. 2008, AJ, 136, 2373
- Rogers et al. (2009) Rogers, B., Ferreras, I., Kaviraj, S., Pasquali, A., & Sarzi, M. 2009, MNRAS, 399, 2172
- Salim et al. (2007) Salim, S., et al. 2007, ApJS, 173, 267
- Sanders et al. (1988) Sanders, D. B., Soifer, B. T., Elias, J. H., Madore, B. F., Matthews, K., Neugebauer, G., & Scoville, N. Z. 1988, ApJ, 325, 74
- Schawinski et al. (2010) Schawinski, K., Dowlin, N., Thomas, D., Urry, C. M., & Edmondson, E. 2010, ApJ, 714, L108
- Schlegel et al. (1998) Schlegel, D. J., Finkbeiner, D. P., & Davis, M. 1998, ApJ, 500, 525
- Schmitt (2001) Schmitt, H. R. 2001, AJ, 122, 2243
- Scoville et al. (2007) Scoville, N., et al. 2007, ApJS, 172, 1
- Serber et al. (2006) Serber, W., Bahcall, N., Ménard, B., & Richards, G. 2006, ApJ, 643, 68
- Shen et al. (2011a) Shen, Y., Liu, X., Greene, J. E., & Strauss, M. A. 2011a, ApJ, 735, 48
- Shen et al. (2011b) Shen, Y., et al. 2011b, ApJS, 194, 45
- Shimasaku et al. (2001) Shimasaku, K., et al. 2001, AJ, 122, 1238
- Silverman et al. (2011) Silverman, J. D., et al. 2011, ApJ accepted; ArXiv e-prints 1109.1292
- Silverman et al. (2009) —. 2009, ApJ, 695, 171
- Smith et al. (2010) Smith, K. L., Shields, G. A., Bonning, E. W., McMullen, C. C., Rosario, D. J., & Salviander, S. 2010, ApJ, 716, 866
- Springel et al. (2005a) Springel, V., Di Matteo, T., & Hernquist, L. 2005a, ApJ, 620, L79
- Springel et al. (2005b) —. 2005b, MNRAS, 361, 776
- Springel & Hernquist (2003) Springel, V., & Hernquist, L. 2003, MNRAS, 339, 289
- Strateva et al. (2001) Strateva, I., et al. 2001, AJ, 122, 1861
- Strauss et al. (2002) Strauss, M. A., et al. 2002, AJ, 124, 1810
- Struck (2006) Struck, C. 2006, Galaxy Collisions - Dawn of a New Era, ed. Mason, J. W. (Springer Verlag), 115–+
- Tacconi et al. (2008) Tacconi, L. J., et al. 2008, ApJ, 680, 246
- Toomre & Toomre (1972) Toomre, A., & Toomre, J. 1972, ApJ, 178, 623
- Tremaine et al. (2002) Tremaine, S., et al. 2002, ApJ, 574, 740
- Tremonti et al. (2004) Tremonti, C. A., et al. 2004, ApJ, 613, 898
- Veilleux & Osterbrock (1987) Veilleux, S., & Osterbrock, D. E. 1987, ApJS, 63, 295
- Vorontsov-Velyaminov (1959) Vorontsov-Velyaminov, B. A. 1959, in Atlas and catalog of interacting galaxies (1959), 0–+
- Wang et al. (2009) Wang, J., Chen, Y., Hu, C., Mao, W., Zhang, S., & Bian, W. 2009, ApJ, 705, L76
- Waskett et al. (2005) Waskett, T. J., Eales, S. A., Gear, W. K., McCracken, H. J., Lilly, S., & Brodwin, M. 2005, MNRAS, 363, 801
- Woods & Geller (2007) Woods, D. F., & Geller, M. J. 2007, AJ, 134, 527
- Woods et al. (2006) Woods, D. F., Geller, M. J., & Barton, E. J. 2006, AJ, 132, 197
- Worthey & Ottaviani (1997) Worthey, G., & Ottaviani, D. L. 1997, ApJS, 111, 377
- York et al. (2000) York, D. G., et al. 2000, AJ, 120, 1579
- Zhou et al. (2004) Zhou, H., Wang, T., Zhang, X., Dong, X., & Li, C. 2004, ApJ, 604, L33
- Zwicky (1956) Zwicky, F. 1956, Ergebnisse der exakten Naturwissenschaften, 29, 344