Shock acceleration of relativistic particles in galaxy-galaxy collisions
Abstract:
All galaxies without a radio-loud AGN follow a tight correlation between their global FIR and radio synchrotron luminosities, which is believed to be ultimately the result of the formation of massive stars. Two face-on colliding pairs of galaxies, UGC12914/5 and UGC 813/6 deviate from this correlation and show an excess of radio emission which in both cases originates to a large extent in a gas bridge connecting the two galactic disks. The radio synchrotron emission expected from the bridge region is calculated, assuming that the kinetic energy liberated in the predominantly gas dynamic interaction of the respective interstellar media (ISM) has produced shock waves that efficiently accelerate nuclei and electrons to relativistic energies. A simple model for the acceleration of relativistic particles in these shocks is presented together with a calculation of the resulting radio emission, its spectral index and the expected high-energy gamma-ray emission. This process is not related to star formation. It is found that the nonthermal energy produced in the collision is large enough to explain the radio emission from the bridge between the two galaxies. The calculated spectral index at the present time also agrees with the observed value. The expected gamma-ray emission, on the other hand, is too low by a factor of several to be detectable even with foreseeable instruments like CTA.
1 Introduction
The universal, tight correlation between the spatially integrated far-infrared (FIR) luminosities and the monochromatic radio continuum emissions from late type galaxies without a bright, radio-loud AGN (de Jong et al. 1985, Helou et al. 1985) has been known for a long time. It is believed to be ultimately a result of the formation of massive stars and also holds for most interacting galaxies. It is therefore quite unusual that Condon et al. (1993), hereafter referred to as CHS, and Condon et al. (2002) found two clear exceptions to this rule. This concerns two face-on colliding spiral galaxy systems where at the present time, presumably some 30 Myr after the interaction, the respective pairs of galaxy disks are again well separated from each other optically, but are connected by a radio continuum-bright “bridge” of gas, suggested to be stripped from the interpenetrating disks. The two systems show overall a significant excess, by a factor of about two, of the radio continuum emission relative to the FIR-radio continuum ratio expected from the FIR-radio correlation for single galaxies. CHS interpreted the finding as the result of general electron escape from galaxies, in this case into the bridge connecting the pair.
In the present paper the dynamical effects of such galaxy-galaxy collisions on the interstellar gas are investigated. It is argued that the interstellar media of the respective galaxies will undergo a largely gas dynamic interaction, where the low-density parts exchange momentum and energy through the formation of large-scale shock waves in the supersonic collision. A simple model for the acceleration of relativistic particles is presented and the synchrotron emission from the relativistic electron component is calculated, as well as the expected gamma-ray emission from relativistic nuclei and electrons. The model is shown to be able to explain the radio continuum emission observed from the bridge between the galaxies. For details, see Lisenfeld & Völk (2010), hereafter referred to as LV.
2 Further properties of the colliding systems
The spectral index of the radio emission between 1.49 and 4.9 GHz steepens gradually from the stellar disks with values of 0.7–0.8 to values of 1.3–1.4 in the middle of the connecting gas bridge. This steep spectral index will be argued to be indicative of dominant synchrotron and inverse Compton losses suffered by the relativistic electrons. Apart from the sychrotron emitting electrons the bridge in the system UGC 12914/5 contains also large amounts of atomic (CHS) and molecular (Braine et al. 2003) gas, where practically no star formation is taking place. This is interpreted as an essentially complete hydrodynamic removal of the more diffuse atomic and molecular gas from the galaxies. Most likely, only the dense cloud cores – capable of forming stars – have remained within the stellar disks together with the stars. The other system, UGC 813/6, was described in the later paper by Condon et al. (2002). Since it is very similar, the discussion here will be limited to UGC 12914/5.
3 Acceleration model
In a face-on collision the stellar disks interpenetrate each other without being too much altered. However, the diffuse gas and part of the gas clouds interact hydrodynamically and exchange energy and momentum.
If one assumes that half of the gas, which is now present in the bridge, was previously in one galaxy, and the other half in the other galaxy, then the total energy liberated in a fully inelastic interaction is the kinetic energy of the gas mass:
| (1) |
where is the total gas mass in the bridge and denotes the velocity difference of the gas at collision. The factor 1/2 converts this velocity to the velocity difference in the center of mass system (assuming that both gas disks are equally massive). The relative velocity between the galaxies, km/s, in the case of UGC 12914/5 has been derived by CHS from a analysis of the HI line and of the galaxy masses. and are estimated as and therefore erg, respectively.
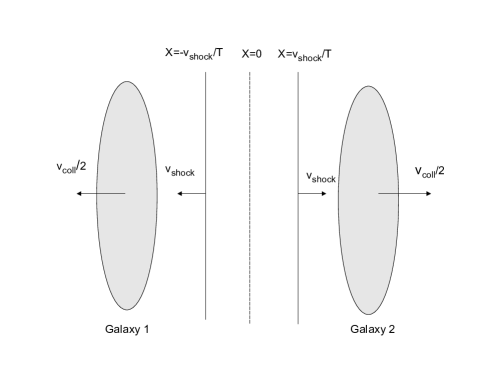
At the collision of the two ISM, a tangential discontinuity will form and two strong shocks will propagate in opposite directions with velocities , communicating the interaction to larger and larger fractions of the colliding interstellar gas masses. The space in between these shocks is filled with post-shock gas. Fig. 1 shows the idealized picture of this interaction, the basis of the present model, in the reference frame of the motion normal to this tangential discontinuity, which is also the center of mass system. In this frame, the post-shock normal velocity vanishes and the preshock normal velocity of the gas is . The contact discontinuity is stationary and situated in the middle between the galaxies (at in Fig. 1). In a strong, but approximately unmodified, adiabatic gas shock, the normal component of the velocity difference between the shock in the pre- and postshock gas follows the relation: . With , this yields . The shock velocity , relative to the unperturbed ISM gas, is then = 400 km/sec. From Fig. 1 in CHS one can estimate that the shocks are at present close to the galaxy disks so that practically the entire bridge is expected to be filled with post-shock gas.
The Mach number of the shocks produced in this collision is like in middle-aged supernova remnants in the Sedov phase. Roughly speaking, the particle acceleration efficiency of such shocks will therefore be similar to that of a supernova remnant, i.e. of the order of (e.g. Berezhko & Völk 1997). This is a basic assumption for the present paper.
The source function , i.e. the number of relativistic particles produced by the shock per energy and time interval is given by: , where is the area covered by the shock (roughly the area of the galaxy disks). The factor 2 is due to the fact that the shocks propagate into two, opposite directions. is the downstream, uniform number of relativistic particles of rest mass , produced per volume and energy interval at the shocks:
| (2) |
Here, is the spectral index of the differential relativistic particle source spectrum, taken to be (Drury et al. 1994, Berezhko & Völk 1997). For the nuclear particles, essentially protons, the constant can be determined by requiring that the total energy converted into relativistic particles during the entire duration of the interaction, , is equal to , where :
for . Here, is the minimum energy of relativistic protons of mass accelerated, taken as GeV (Drury et al. 1994). This gives
| (3) |
In the Galactic cosmic rays, at a given energy, the number of relativistic electrons is about 1% of that of the protons at GeV energies, and the source spectra for electrons and protons are probably similar (Müller 2001). Assuming that this electron-to-proton ratio is also representative for the source spectra in the galaxies considered here, implying that the electron and proton source spectra are the same, for the source function of the relativistic electrons is adopted, which means that their source distribution is , with .
4 Relativistic electron density and synchrotron emission
In order to calculate the synchrotron emission from the bridge the time-dependent propagation equation for the electron particle density is solved. Due to the spatial symmetry of the situation, a one-dimensional approximation is appropriate, where is the coordinate in the direction along which the galaxies separate (see Fig. 1). In addition, the diffusion of relativistic electrons is neglected because the typical spatial scales which are relevant on the time-scales discussed here, yr, are kpc, whereas the width of the bridge is 10 kpc. Then one can write:
| (4) |
where
| (5) |
is the local source strength (in units of relativistic electrons produced per energy interval per time and per volume). This source strength describes two shocks that start at at and propagate into opposite directions with velocity . Eq.(4.1) takes into account the electron acceleration in the shocks together with the radiative energy losses of these CR electrons due to Inverse Compton and synchrotron losses; up to the present epoch, adiabatic losses can be disregarded. Then:
| (6) |
where is approximated by the Thompson scattering cross section, the magnetic field strength, its energy density and is the energy density of the radiation field. Neglecting adiabatic losses is consistent with the fact that the distribution of the synchrotron spectral index , between 1.49 and 4.86 GHz, has an integrated value in the bridge region (CHS), indicative of dominant Inverse Compton and synchrotron losses.
The magnetic field can be estimated from the minimum energy requirement to be about 7 G in the bridge of UGC 12914/5 (CHS), which implies eV cm-3. The total radiation field density from (in essentially equal amounts) the blue magnitude, the FIR, and the Cosmic Microwave Background (CMB) amounts to eV cm-3 (LV).
The solution of eq. (4.1) is:
| (7) | |||
and
| (8) |
with being the life-time of a relativistic electron against radiative energy losses.
This expression can also be integrated over the volume of the bridge to obtain the total number of relativistic electrons in the bridge . The result is:
| (9) |
and
| (10) |
The synchrotron spectrum is obtained by convolving , respectively , with the synchrotron emission spectrum of a single electron.
This solution allows a theoretical prediction for the total radio flux density specifically at GHz and of the radio spectral index between and GHz. Both values are in satisfactory agreement with the observations (LV). Clearly also the radio spectral index increases towards the center of the bridge. The model calculations therefore show that acceleration by large-scale shocks caused by the galaxy-galaxy interaction is indeed able to explain the radio emission from the bridge both in intensity and spectral morphology.
The two interacting galaxy pairs studied here, are possibly examples of what might have happened much more frequently at early stages of structure formation, when primordial galaxies had already developed magnetic fields as a consequence of early star formation, but when they were still likely to interact strongly with neighboring structures of a similar character.
5 High-energy gamma-ray emission
Although not the primary topic of this paper, it is clear that the interaction of galaxies considered here will also lead to the acceleration of gamma-ray producing very high-energy particles, both nuclei and electrons, in the form of the distribution , cf. eq. (3.2). The visibility of the acceleration process also in high-energy gamma rays would be an independent argument for the model presented. In the following a rough estimate will be given.
The shock system which characterizes the face-on interaction of the two spiral galaxies can to first approximation be considered as plane parallel, with constant speed shocks; the energetic particles remain confined in the growing interaction region until the interaction is completed. Assuming the diffusion coefficient to be as low as the Bohm diffusion coefficient (e.g Kang 2007) one can approximately calculate the maximum proton energy achieved at the present epoch as eV. This very high energy is the result of the long life-time ( yrs) of the shocks, inspite of their comparatively moderate speed of km sec-1. The situation is rather different for the energetic electrons because of their radiative losses. Even disregarding any magnetic field amplification at the shocks due to the accelerating particles, the maximum electron energy is only TeV. For the IC gamma-ray emission in the sub-TeV region mainly the CMB counts. In contrast to the great majority of the radio electrons, however, all gamma-ray emitting electrons are “old” as a result of postshock radiative losses. As a consequence their energy spectrum is softened with a correspondingly reduced IC gamma-ray emission.
When the shocks have gone through the interacting ISM of the two galaxies, which is the case at about the present epoch, the kinetic energy erg has been transformed into thermal and nonthermal particle energy. This corresponds to erg, predominantly in relativistic nuclei, which is roughly times more energy than available from a single supernova remnant.
The bridge volume is reasonably estimated as , where the disk radius kpc (CHS). This implies a mean gas density of cm-3, which is an order of magnitude smaller than the typical density in the plane of spiral galaxies and more than three orders of magnitude smaller than the density in the starburst nucleus of e.g. the galaxy NGC 253.
An analytical estimate for the integral hadronic gamma-ray emission, from -production by collisions of energetic protons with gas nuclei and subsequent decay into two gamma rays, is given in Eq. (9) of Drury et al. (1994) for gamma energies large compared to 100 MeV:
Inserting the values erg, , , and cm-3 results in
| (11) |
approximately independent of energy up to about eV.
For the IC emission of the electrons at high gamma-ray energies the distribution for in eq. 4.7 is relevant. For the spectral energy flux density is roughly energy independent with a value .
Thus the IC gamma-ray energy flux is of the same order as the hadronic gamma-ray energy flux in the region of energy overlap, even for the radiatively cooled electrons. This is a consequence of the low mean gas density in the bridge. On the other hand, the lowest TeV photon flux from an astrophysical source detected until now was . For a flat spectral energy density this corresponds to . The measurement was made with the H.E.S.S. telescope system for the nearby starburst galaxy NGC253 (Acero 2009). Taking this result as a yard stick, the expected hadronic flux from UGC 12914/5 at gamma-ray energies above 1 TeV is still two orders of magnitude below this minimum flux. The expected minimum detectable energy flux for the future Cherenkov Telescope Array (CTA) is as low as erg cm-2 s-1 in the TeV region, and at least one order of magnitude higher at 50 GeV (CTA 2010). Therefore the gamma-ray flux is also below the detection capabilities of CTA. To this extent the more optimistic expectation by LV is corrected here. This flux is also expected to be too low for the detection capabilities with the LAT instrument on Fermi at lower gamma-ray energies. The same source at the distance of NGC 253 would be detectable even for present Northern Hemisphere ground-based TeV gamma-ray instruments like VERITAS and MAGIC, and at GeV energies for Fermi. Ultimately the reason for the low gamma-ray fluxes from these distant interacting systems is their low gas density and their comparatively high age, despite the large overall nonthermal energy they contain.
References
- [1] Acero, F., et al. (H.E.S.S. Collaboration) 2009, Science 326, 1080
- [2] Berezhko, E.G., & Völk, H.J., 1997, Astropart. Phys., 7, 183
- [3] The CTA Consortium: Concepts for the Cherenkov Telescope Array CTA, 2010, [arXiv:1008.3703v2]
- [4] Braine, J., Davoust, E., Zhu, M., et al., 2003, A&A, 408, L13
- [5] Condon, J.J., Helou,G., Sanders, et. al., 1993, AJ, 105, 1730 (CHS)
- [6] Condon, J.J., Helou, G., Jarrett, T.H., 2002, AJ, 123, 1881
- [7] de Jong, T., Klein, U., Wielebinski, R., et al., 1985, A&A, 147, L6
- [8] Drury, L.O’C., Aharonian, F.A., & Völk, H.J., 1994, A&A, 287, 959
- [9] Helou, G., Soifer, B.T., Rowan-Robinson, M., 1985, ApJ, 298, L7
- [10] Kang, H., Jones, T.W., 2007, Astropart. Phys., 28, 232
- [11] Lisenfeld, U., Völk, H. J. 2010, A&A, 524, A27 (LV)
- [12] Müller, D., 2001, Adv. Space Res., 27, 659