XMM-Newton first X-ray detection of the LoBAL quasar PG 1700+518
Abstract
We report the first high-energy detection of PG 1700+518, a well-known low-ionization broad absorption line quasar (QSO). Due to previous X-ray non-detection, it was classified as soft X-ray weak QSO. We observed PG 1700+518 with XMM-Newton for about ksec divided in three exposures. The spectrum below keV is very steep, , while at higher energies the extremely flat emission (photon index , when modelled with a power law) suggests the presence of strong absorption (, fixed to ), or a reflection-dominated continuum. The broad-band flux is consistent with previous non-detection. Simultaneous EPIC and OM data confirm its X-ray weakness (observed ). The level of obscuration derived from the X-ray spectra of PG 1700+518 cannot explain its soft X-ray nuclear weakness unless a column density of is present.
keywords:
galaxies: active – quasars: individual: PG 1700+518 – X-rays: galaxies1 Introduction
The so-called “soft X-ray weak QSOs” (SXWQs, X-ray–to–optical spectral index , Laor et al. 1997; % of nearby PG QSOs, Brandt, Laor, & Wills 2000) are active galactic nuclei (AGN) notably faint in X-rays relative to their optical/UV fluxes. Recently, Gibson, Brandt, & Schneider (2008), studying the frequency of intrinsically SXWQs in optically selected samples, found that [excluding Broad Absorption Line (BAL)] % SDSS QSOs are genuinely X-ray weak.
Several possible explanations of this weakness have been proposed over the past years, all related to the X-ray band (the optical-UV flux in the SXWQs is not strongly variable and, therefore, it is difficult to ascribe the X-ray weakness to a temporary high emission state at these wavelengths). The presence of absorbers (neutral or partially ionized) can reduce in a considerable way the observed high-energy emission (Gallagher et al. 2001, 2005; Piconcelli et al. 2005; see e.g. Q1246-057 and SBS1542+541, Grupe, Mathur, & Elvis 2003; Mrk 304, Piconcelli et al. 2004; WPVS 007, Grupe et al. 2007; Grupe, Leighly, & Komossa 2008; Mrk 335, Grupe et al. 2008; PG 1535+547, Ballo et al. 2008). Strong UV absorption features of SXWQs classified as BAL sources are known to be related to warm absorbers (Crenshaw, Kraemer, & George, 2003). Significant correlations have also been found between the degree of X-ray weakness (i.e., how the differ from that expected for a typical QSO having the same ; e.g., Gibson, Brandt, & Schneider, 2008, and references therein) and acceleration-dependent BAL properties in the BAL QSOs belonging to the SDSS (Gibson et al., 2009). A strong variability of the intrinsic X-ray continuum can be another reason of weakness at high energies. In this case, the classification as SXWQ is based on observations performed during a low emission state of the source (see e.g. PG 0844+349, Gallo et al. 2011, and references therein; 1H 0419-577, Pounds et al. 2004; Mrk 335, Grupe, Komossa, & Gallo 2007). In this scenario, a reflection-dominated continuum originating in the accretion disc (caused by strong light bending) can also play an important role (see Schartel et al., 2007, 2010; Gallo et al., 2011). Finally, the observed weakness can be an intrinsic property, due to a fundamentally distinct emission mechanism (Risaliti et al. 2003; see also the case of PG 1254+047, Sabra & Hamann 2001; PHL 1811, Leighly et al. 2007). This last hypothesis implies different scenarios for the accretion disc. Higher accretion rates can produce a steeper if the X-ray photons are emitted in a more central region than the UV-optical photons (Zdziarski & Gierliński, 2004), or via the so-called “photon-trapping” (Begelman & Rees, 1978; Kawaguchi, 2003). Another possibility is that the corona is radiatively inefficient (e.g., Bechtold et al., 2003; Proga, 2005). The most likely explanation for the dramatic steepening of reported by Miniutti et al. (2009) for PHL 1092 seems to be a transient dramatic weakening or disruption of the X-ray corona.
PG 1700+518 (; Schmidt & Green, 1983) is the most luminous radio-quiet QSO in the optically selected PG sample (absolute magnitude ; Véron-Cetty & Véron, 2010). The source resides in a system composed by two apparently interacting galaxies, with widely separated nuclei (, corresponding to kpc at the source redshift; e.g., Guyon, Sanders, & Stockton, 2006). Observational evidences are consistent with the companion being a collisional ring galaxy, possibly produced by a near head-on collision with the QSO host. The IR luminosity (estimated from IRAS, ISO, and Spitzer data; Evans et al., 2009) implies for the whole system a classification as Ultra-Luminous Infrared Galaxy. A rough indication for the bolometric luminosity, , was obtained by Evans et al. (2009) from this (adopting a ratio ; Guyon, Sanders, & Stockton, 2006); given the black hole mass of (Peterson et al., 2004), this implies a quite large Eddington ratios, , as expected for this kind of sources. Assuming that the luminosity in the far-IR corresponds to the luminosity of the starburst (SB), a star formation rate for the QSO host of yr-1 is estimated (Evans et al., 2009). Millimetre-wave CO(10) observations allow the authors to derive for the system a molecular gas mass of (mainly associated with the QSO host), converting it into one of the most molecular gas-rich PG QSO host systems. Moreover, PG 1700+518 belongs to the rare class of low-ionization broad absorption line (loBAL) QSOs, a very rare subclass (%) of BAL QSOs showing absorption from both low- and high-ionization species.
At high energies, ROSAT and ASCA non-detections are the only X-ray information collected so far (Green & Mathur, 1996; Gallagher et al., 1999; Brandt, Laor, & Wills, 2000; George et al., 2000). A power-law (PL) model with implies an ASCA (George et al., 2000). From the upper limit to the ROSAT rate (counts s-1, up to keV), Green & Mathur (1996) estimated an index . With optical spectropolarimetric studies of the broad Balmer and emission lines, Young et al. (2007) demonstrate the presence of a wind launched from a relatively narrow annulus within the accretion disc of PG 1700+518. The two-zones wind model adopted by the authors to interpret the observations can explain observed properties such as BALs and X-ray absorbers. Indeed, it requires the presence of an inner self-shielding region, opaque to X-rays. On the other hand, the BALs should be formed in a part of the wind different from the X-ray-absorbing zone, arising in the shielded outer wind. This wind can be responsible for the extinction of an intrinsically normal X-ray emission.
In this paper we present the analysis of our XMM-Newton observation of PG 1700+518, providing the first X-ray detection of this SXWQ. In our analysis, we assume a cosmology with , , and =km s-1 Mpc-1, implying a luminosity distance of Mpc. All literature measurements have been converted to this cosmology.
2 Observation and data reduction
XMM-Newton (Jansen et al., 2001) observed PG 1700+518 (RA, Dec) in December 2009/January 2010, for about ksec divided in three exposures, the first separated by about two weeks from the others (Obs. ID , , and ; hereafter, , , and , respectively). The observations were performed with the European Photon Imaging Camera (EPIC; pn, Strüder et al. 2001; MOS, Turner et al. 2001), the Optical Monitor (OM; Mason et al., 2001) and the Reflection Grating Spectrometer; the source is not detected with the last instrument. The three EPIC cameras were operating in full frame mode, with the thin filter applied. OM performed observations with the UVW1 (Å) and UVM2 (Å) filters in the optical light path; all OM exposures were performed in the default image mode.
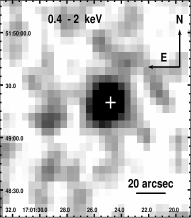
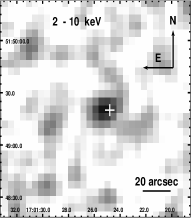
The data have been processed following the standard procedures, using the Science Analysis Software (SAS version 10.0.2) with calibration from July 2010. EPIC event files have been filtered for high-background time intervals, following the standard method consisting in rejecting periods of high count rate at energies keV. The net exposure times at the source position after data cleaning are , , and ks (MOS1), , , and ks (MOS2), and , , and ks (pn). Figure 1 shows the EPIC images obtained combining event files from all cameras for the three exposures in the keV (left panel) and keV (right panel) energy ranges (the white cross marks the optical position of PG 1700+518). The source is detected with a keV EPIC detection likelihood above in all the observations (according to the results of the SAS task edetect_chain applied to the cleaned data); above keV, there is no detection in the observation (as well as in the MOS1 data of the ), while the source is marginally detected in the three cameras during the observation , and in the pn and MOS2 data of the (see Table 1).
We extracted source counts from a circular region of radius, enclosing both the QSO host and the galaxy companion; background counts were extracted from a source-free circular region in the same chip of radius. In Table 1 we report the net count rates and signal-to-noise ratios () in the keV and keV observed energy ranges, corresponding to keV and keV in the frame of the source. No statistically significant variability has been detected during each observation. In Table 2 we compare the observed variance, as evaluated from the data scatter, to the variance expected from a constant source, as evaluated from the errors in the count rates. This is done for background-subtracted data in bins of sec each. Given the relatively high black hole mass of PG 1700+518, we note that even the longer exposure (after cleaning) is less than times the crossing time sec. Therefore, we do not expect variability in a single observation.
| Obs. ID | Instr. | Net exp. time | Net Count Rates | ||||
|---|---|---|---|---|---|---|---|
| [sec] | [counts/sec] | ||||||
| keV | keV | ||||||
| MOS1 | |||||||
| 101 | MOS2 | ||||||
| pn | |||||||
| MOS1 | |||||||
| 201 | MOS2 | ||||||
| pn | |||||||
| MOS1 | |||||||
| 301 | MOS2 | ||||||
| pn | |||||||
| Obs. ID | Instr. | Obs. / Exp. Variance | |||
|---|---|---|---|---|---|
| [(counts/sec)2] | |||||
| keV | keV | ||||
| MOS1 | / | / | |||
| 101 | MOS2 | / | / | ||
| pn | / | / | |||
| MOS1 | / | / | |||
| 201 | MOS2 | / | / | ||
| pn | / | / | |||
| MOS1 | / | / | |||
| 301 | MOS2 | / | / | ||
| pn | / | / | |||
For each observation, we obtained two images for each OM filter. The count rate information was averaged; the resulting AB magnitudes are: in the UVM2 filter, , , and ; in the UVW1 filter, , , and (for observations , , and , respectively).
3 X-ray spectral analysis
EPIC spectra have been analysed using standard software packages (FTOOLS version 6.10; XSPEC version 12.6.0q, Arnaud, 1996). All the models discussed assume Galactic absorption with a column density of (Kalberla et al., 2005). Unless otherwise stated, the quoted luminosities are corrected for both Galactic and intrinsic absorption. Because of the small number of counts in our spectra, we decided to use the Cash-statistic (Cash, 1979, cstat command in XSPEC, now allowing fits to data for which background spectra are considered), binning the spectra to have at least count in each channel111See https://astrophysics.gsfc.nasa.gov/XSPECwiki/low_count_spectra, section “Use a modified cstat”.
We created a combined MOS spectrum and response matrix for each observation, to improve the ratio. The , , and spectra present the same spectral shape and intensity (see the hardness ratios in the last column of Table 1). We therefore combined the pn [MOS] data, fitting the spectra simultaneously between and keV (for a total of bin); the relative normalizations, left free during the fit, are consistent within a few percent.
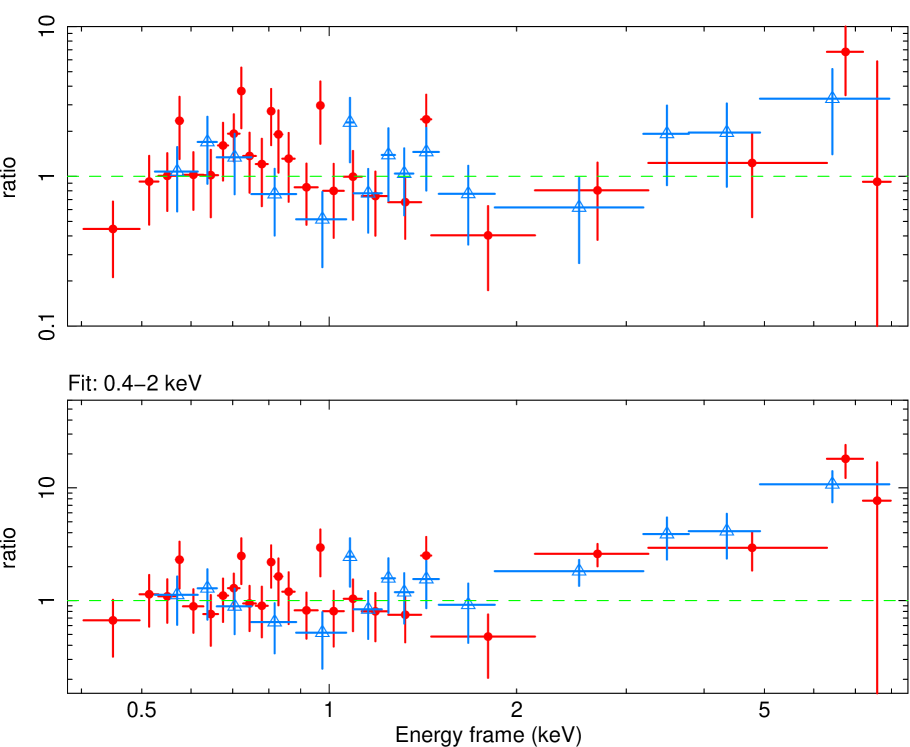
A simple power-law model plus Galactic absorption (, for d.o.f.) leaves positive residuals both below keV (more pronounced in the pn than in the MOS data) and above keV, while a trough characterizes the emission between and keV (see Fig. 2, upper panel). This simple model implies a rather low luminosity, .
Limiting to keV, where most of the flux is emitted, confirms this result: the spectra are well described ( for bins) by an absorbed power-law model with a photon index and a column density ; the addition of the intrinsic absorption implies a change in the statistics = for d.o.f. less, with respect to a single power law (). In low-quality data, a steep power law can mimic the large-scale scattered/reprocessed emission observed in obscured Seyfert 2 spectra (see e.g. Guainazzi & Bianchi, 2007), characterized (in higher resolution data) by soft X-ray emission lines, and likely associated with the Narrow Line Region (Bianchi, Guainazzi, & Chiaberge, 2006).
On the other hand, in the soft X-ray band we expect a thermal contribution associated with the strong SB observed in this source. Fitting the data below keV with a mekal model (describing in XSPEC a collisionally ionized plasma emission component) with H density fixed to and metal abundance fixed to the solar one, we obtain an implausibly high temperature (keV; ); a more typical temperature, keV, is obtained with the addition of intrinsic absorption, (= for d.o.f. less). Left free to vary, the metal abundance is rather low and poorly constrained, , with a statistical upper limit consistent with typical results for SB galaxies (, e.g., Ptak et al., 1999).
The soft X-ray luminosity associated to this component, , is about times higher than expected from a yr-1, (as estimated by Evans et al. 2009 assuming that is the SB luminosity). According to Ranalli, Comastri, & Setti (2003), the soft X-ray luminosity corresponding to this SFR is indeed . A contribution from the AGN is likely present at the mid-IR/FIR wavelengths which are used in the estimate of the SFR; therefore, this value can be assumed as an upper limit to the soft X-ray luminosity expected from the SB. The present data do not allow to disentangle the SB-related from the AGN-related X-ray emission leaving free to vary all the parameters of interest; however, we can investigate the relative contribution of AGN and SB by fixing the intensity of the latter to the expected upper limit. Residuals are well modelled by a power law flatter than previously found but still consistent, given the large associated uncertainties, , with a luminosity ; the parameters are poorly constrained, with and keV ().
When extended to the whole energy range, strong residuals at high energy are clearly evident (see Fig. 2, lower panel). A simple power law fitted to the data above keV results to be extremely flat, , leaving a strong soft excess below keV.
Such an extremely flat power law suggests the presence of absorption, or it can be interpreted as a reflection component. We tested both hypotheses (i.e., transmission vs. reflection-dominated scenarios), adopting for the latter the pexrav model in XSPEC (Magdziarz & Zdziarski, 1995). The statistic quality of the data above keV is too low to constrain at the same time all the spectral parameters for the reflection component or the high-energy absorbed power law; in the following, we fix the photon index of the intrinsic nuclear emission to a typical value for unabsorbed AGN, (e.g., Piconcelli et al., 2005; Mateos et al., 2010). Both the adopted models are adequate to describe the overall broad-band shape, with values for the common model parameter, the soft-component photon index, consistent within the errors: and , when a reflection-dominated continuum or a transmission scenario are assumed, respectively. A fit with an absorbed power law implies a high column density of . Furthermore, an additional absorption of and , depending on the continuum model, covering both spectral components, is also required. From a statistical point of view, at high energy a transmission or a reflection-dominated model are indistinguishable ( for d.o.f. vs. for d.o.f.); the low prevents us from completely ruling out any possibility.
When the expected soft contribution from SB is included in the model, , we found a flatter soft AGN-related power law, and for the transmission or the reflection-dominated scenario, respectively. In the former case, the absorber covering the intrinsic nuclear power law has a column density . The additional absorption covering the all the spectral components is no longer required (= and ); the two scenarios are still indistinguishable ( for d.o.f. vs. for d.o.f.).
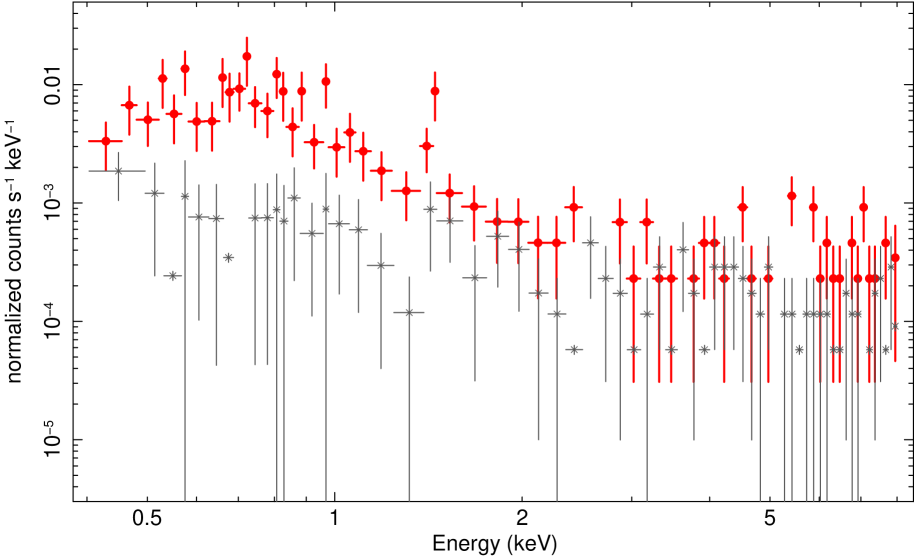
In principle, the equivalent width of the line can help in discriminating between a transmission or a reflection-dominated origin of the high-energy emission, but this feature is not detected. No meaningful upper limit for the line equivalent width can be obtained, due to the high background, dominating above keV (see Fig. 3).
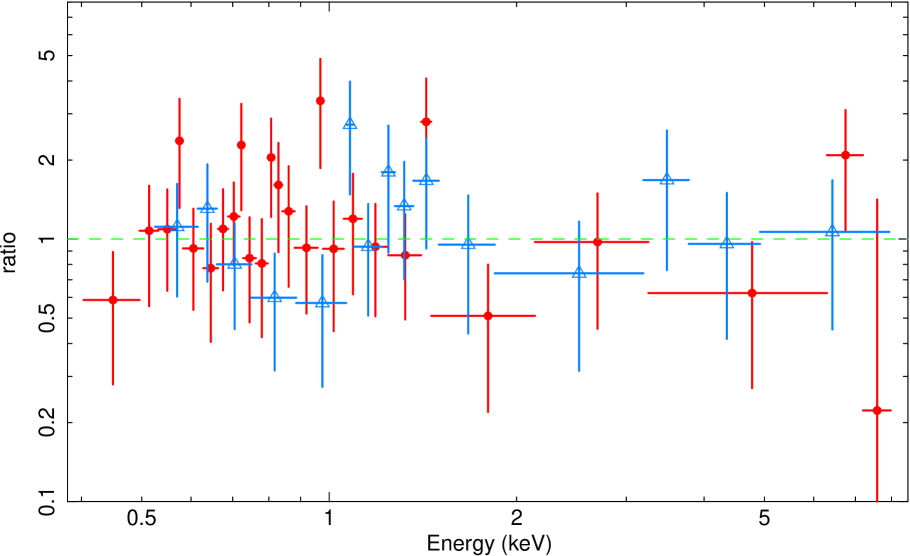
For an high-energy absorbed power-law model, we measure a total keV [keV] flux (corrected for Galactic absorption) of []. The total luminosity in the hard band is . When the SB contribution is included, as a thermal component with , the hard X-ray luminosity associated with the obscured power-law continuum, representing the primary AGN emission in the transmission scenario, is . Data-to-model ratio for this spectral fit is shown in Figure 4.
Finally, the total observed keV flux measured with XMM-Newton, , is consistent with the upper limit in the keV ASCA SIS0 counts reported by George et al. (2000), i.e. counts s-1: assuming the steep power lawabsorbed power law model best fitting the XMM-Newton data, WebSpec222See http://heasarc.gsfc.nasa.gov/webspec/webspec.html predicts an ASCA SIS0 count rate between and keV of counts s-1.
4 Discussion and conclusions
We have presented the first X-ray detection of the loBAL SXWQ PG 1700+518, obtained from our XMM-Newton observations. Most of the flux is emitted below keV; above this energy, the signal is weak (see Fig. 3). The observed flux is consistent with previous ASCA non-detection in this source.
The soft emission is well described by a steep power law with , or assuming a thermal component with keV. However, the luminosity derived for this component is a factor of higher than expected from the SFR, and suggests that the emission is mainly due to reprocessing of the AGN emission (e.g., Guainazzi & Bianchi, 2007), with a contribution due to the SB activity. When the thermal emission is rescaled to the upper limit estimated on the basis of the SFR, the lower limit to the AGN contribution to the soft X-ray emission, represented by a power law with , is . Above keV, the extremely flat power law ascribed to the AGN can be due to both an high-absorbed power law (, fixed to ) in a transmission scenario, or to a reflection-dominated continuum. While a strong absorption is not unexpected due to the loBAL nature of PG 1700+518, the quality of the data is too low to discriminate between these possibilities, or to constrain more physical models: e.g., to test the ionization state of the absorbing gas (taking into account the BAL nature of this QSO), or to investigate where the hypothetical reflection could take place: distant obscuring matter, implying a Compton-thick nature, or the accretion disk, possibly contributing to the observed soft excess (as in the case of PG 2112+059, Schartel et al. 2007, 2010, or PG 0844+349, Gallo et al. 2011).
No conclusive result is obtained considering the AGN-dominated mid-IR continuum, that can provide an absorption-independent measure of the intrinsic luminosity even for Compton-thick sources. Assuming the reported by Shi et al. (2007), the absorption-corrected for the power-law component would be consistent (taking into account the strong uncertainties) with both Compton-thin and Compton-thick nature (see e.g. fig. 4 in Alexander et al., 2008). Note that, at face value, from the low luminosity obtained considering a simple power-law model, , PG 1700+518 would lie in the region where Compton-thick sources are expected, in the same diagnostic diagram, thus reinforcing the hypothesis of strong obscuration. Insight into AGN energetics can be obtained from mid-IR emission-line diagnostics. The low ratio between high- and low-ionization line observed in PG 1700+518, (Evans et al., 2009), typical of energetically weak AGN, is similar to the value observed in the loBAL QSO Mrk 231 (, Armus et al. 2007), where a Compton-thick absorber (Braito et al., 2004) is able to block the majority of the [\textNe v] line. Non-detection of polycyclic aromatic hydrocarbon (PAH) features in the Spitzer IRS spectrum (Shi et al., 2007) of PG 1700+518 can be due to a combination of a mid-IR AGN emission partially sweeping away the PAH, and a not strong contribution from star formation activity: note that Mrk 231, where aromatic features, although weak, are observed (Armus et al., 2007), has a yr-1 (Farrah et al., 2003), twice the value found for PG 1700+518. Summarizing, mid-IR data are not able to distinguish between an absorbed AGN and a Compton-thick AGN scenarios.
We can use the OM observations with the UV filters to characterize the low-energy emission and to construct a broad-band spectral energy distribution (SED) of PG 1700+518 from simultaneous UV and X-ray data (in principle, variability can change the classification as SXWQ). The OM flux is compatible, within the errors, with previous observations: in Figure 5 the OM data (red squares) are overplotted to HST-FOS333See http://archive.stsci.edu/. and IUE444See http://sdc.laeff.inta.es/ines/index2.html spectra (dotted lines). At higher energies, the EPIC pn data (red open circles) are plotted. From the OM and EPIC data (corrected for Galactic absorption, following the extinction curve provided by Cardelli, Clayton, & Mathis, 1989), we compute an observed . From the relations between the broad-band spectral index and the optical luminosities obtained for samples of optically-selected AGN (e.g., Gibson, Brandt, & Schneider, 2008, and references therein), we would expect from the of PG 1700+518 a value of (where the uncertainty represents the dispersion in the relation); this would imply the X-ray emission marked with the dotted line in Figure 5. This supports the hypothesis of soft X-ray weakness for PG 1700+518.
The observed is typical of optically-selected BAL QSOs (, Gallagher et al., 2006; Green & Mathur, 1996), while it is more negative than the values found by Giustini, Cappi, & Vignali (2008) for a sample of X-ray selected BAL QSOs (consistent, within the errors, with the index expected from the correlation with ). We obtain a low value, i.e. , even if we consider the absorption-corrected value of the AGN-related luminosity at keV (dashed line in Fig. 5). This means that, although the strong absorption observed in the source (typical of both SXWQs and BAL QSOs) can be partially responsible of the observed low , its effect is not enough to completely explain the soft X-ray weakness of the source. A similar result was found for PG 1254+047, that is not only an intrinsically X-ray weak BAL QSO, like PG 1700+518, but also heavily X-ray absorbed, with a ionized absorber (Sabra & Hamann, 2001). On the other hand, the column density required to obtain the expected (after correcting for absorption) is consistent with a Compton-thick scenario, .
PG 1700+518 is therefore a very peculiar source, thanks to the simultaneous presence of outflowing wind produced in the innermost regions (Young et al., 2007), high nuclear obscuration, and strong star formation activity. These properties make this system similar to Mrk 231, for which Feruglio et al. (2010) provided direct observational evidence of QSO-driven feedback on the host-galaxy gas content. The host galaxy of PG 1700+518 is part of a collisionally interacting system, that is also one of the most molecular gas-rich PG QSO hosts observed to date. This could suggests that also in PG 1700+518 we are observing an early dust-enshrouded phase in the QSO evolution, predicted by the theoretical models of QSO activation by galaxy interactions (Di Matteo, Springel, & Hernquist, 2005). Deeper X-ray observations are needed, to properly describe the observed emission, to determine the physical origin of the different components, and to weight the contribution of AGN and SB. Moreover, information on possible variability in spectral shape and/or intensity is fundamental to investigate the nature of the X-ray weakness of PG 1700+518.
Acknowledgments
We warmly thank the referee, for her/his constructive comments that significantly improved the paper. Based on observations obtained with XMM-Newton (an ESA science mission with instruments and contributions directly funded by ESA Member States and the USA, NASA). LB acknowledges support from the Spanish Ministry of Science and Innovation through a “Juan de la Cierva” fellowship. Financial support for this work was provided by the Spanish Ministry of Science and Innovation, through research grant AYA2009-08059. Support from the Italian Space Agency is acknowledged by EP (contract ASI/INAF I/088/06/0) and CV (contracts I/088/06/0 and I/009/10/0).
References
- Alexander et al. (2008) Alexander D. M., et al., 2008, ApJ, 687, 835
- Armus et al. (2007) Armus L., et al., 2007, ApJ, 656, 148
- Arnaud (1996) Arnaud K. A., 1996, ASPC, 101, 17
- Ballo et al. (2008) Ballo L., Giustini M., Schartel N., Cappi M., Jiménez-Bailón E., Piconcelli E., Santos-Lleó M., Vignali C., 2008, A&A, 483, 137
- Bechtold et al. (2003) Bechtold J., et al., 2003, ApJ, 588, 119
- Begelman & Rees (1978) Begelman M. C., Rees M. J., 1978, MNRAS, 185, 847
- Bianchi, Guainazzi, & Chiaberge (2006) Bianchi S., Guainazzi M., Chiaberge M., 2006, A&A, 448, 499
- Braito et al. (2004) Braito V., et al., 2004, A&A, 420, 79
- Brandt, Laor, & Wills (2000) Brandt W. N., Laor A., Wills B. J., 2000, ApJ, 528, 637
- Cardelli, Clayton, & Mathis (1989) Cardelli J. A., Clayton G. C., Mathis J. S., 1989, ApJ, 345, 245
- Cash (1979) Cash W., 1979, ApJ, 228, 939
- Crenshaw, Kraemer, & George (2003) Crenshaw D. M., Kraemer S. B., George I. M., 2003, ARA&A, 41, 117
- Di Matteo, Springel, & Hernquist (2005) Di Matteo T., Springel V., Hernquist L., 2005, Natur, 433, 604
- Evans et al. (2009) Evans A. S., et al., 2009, AJ, 138, 262
- Farrah et al. (2003) Farrah D., Afonso J., Efstathiou A., Rowan-Robinson M., Fox M., Clements D., 2003, MNRAS, 343, 585
- Feruglio et al. (2010) Feruglio C., Maiolino R., Piconcelli E., Menci N., Aussel H., Lamastra A., Fiore F., 2010, A&A, 518, L155
- Gallagher et al. (1999) Gallagher S. C., Brandt W. N., Sambruna R. M., Mathur S., Yamasaki N., 1999, ApJ, 519, 549
- Gallagher et al. (2001) Gallagher S. C., Brandt W. N., Laor A., Elvis M., Mathur S., Wills B. J., Iyomoto N., 2001, ApJ, 546, 795
- Gallagher et al. (2005) Gallagher S. C., Schmidt G. D., Smith P. S., Brandt W. N., Chartas G., Hylton S., Hines D. C., Brotherton M. S., 2005, ApJ, 633, 71
- Gallagher et al. (2006) Gallagher S. C., Brandt W. N., Chartas G., Priddey R., Garmire G. P., Sambruna R. M., 2006, ApJ, 644, 709
- Gallo et al. (2011) Gallo L. C., Grupe D., Schartel N., Komossa S., Miniutti G., Fabian A. C., Santos-Lleo M., 2011, MNRAS, 412, 161
- George et al. (2000) George I. M., Turner T. J., Yaqoob T., Netzer H., Laor A., Mushotzky R. F., Nandra K., Takahashi T., 2000, ApJ, 531, 52
- Gibson, Brandt, & Schneider (2008) Gibson R. R., Brandt W. N., Schneider D. P., 2008, ApJ, 685, 773
- Gibson et al. (2009) Gibson R. R., et al., 2009, ApJ, 692, 758
- Giustini, Cappi, & Vignali (2008) Giustini M., Cappi M., Vignali C., 2008, A&A, 491, 425
- Green & Mathur (1996) Green P. J., Mathur S., 1996, ApJ, 462, 637
- Grupe, Mathur, & Elvis (2003) Grupe D., Mathur S., Elvis M., 2003, AJ, 126, 1159
- Grupe et al. (2007) Grupe D., Schady P., Leighly K. M., Komossa S., O’Brien P. T., Nousek J. A., 2007a, AJ, 133, 1988
- Grupe, Komossa, & Gallo (2007) Grupe D., Komossa S., Gallo L. C., 2007b, ApJ, 668, L111
- Grupe et al. (2008) Grupe D., Komossa S., Gallo L. C., Fabian A. C., Larsson J., Pradhan A. K., Xu D., Miniutti G., 2008, ApJ, 681, 982
- Grupe, Leighly, & Komossa (2008) Grupe D., Leighly K. M., Komossa S., 2008, AJ, 136, 2343
- Guainazzi & Bianchi (2007) Guainazzi M., Bianchi S., 2007, MNRAS, 374, 1290
- Guyon, Sanders, & Stockton (2006) Guyon O., Sanders D. B., Stockton A., 2006, ApJS, 166, 89
- Jansen et al. (2001) Jansen F., et al., 2001, A&A, 365, L1
- Kalberla et al. (2005) Kalberla P. M. W., Burton W. B., Hartmann D., Arnal E. M., Bajaja E., Morras R., Pöppel W. G. L., 2005, A&A, 440, 775
- Kawaguchi (2003) Kawaguchi T., 2003, ApJ, 593, 69
- Laor et al. (1997) Laor A., Fiore F., Elvis M., Wilkes B. J., McDowell J. C., 1997, ApJ, 477,
- Leighly et al. (2007) Leighly K. M., Halpern J. P., Jenkins E. B., Grupe D., Choi J., Prescott K. B., 2007, ApJ, 663, 103
- Magdziarz & Zdziarski (1995) Magdziarz P., Zdziarski A. A., 1995, MNRAS, 273, 837
- Mason et al. (2001) Mason K. O., et al., 2001, A&A, 365, L36
- Mateos et al. (2010) Mateos S., et al., 2010, A&A, 510, A35
- Miniutti et al. (2009) Miniutti G., Fabian A. C., Brandt W. N., Gallo L. C., Boller T., 2009, MNRAS, 396, L85
- Peterson et al. (2004) Peterson B. M., et al., 2004, ApJ, 613, 682
- Piconcelli et al. (2004) Piconcelli E., Jimenez-Bailón E., Guainazzi M., Schartel N., Rodríguez-Pascual P. M., Santos-Lleó M., 2004, MNRAS, 351, 161
- Piconcelli et al. (2005) Piconcelli E., Jimenez-Bailón E., Guainazzi M., Schartel N., Rodríguez-Pascual P. M., Santos-Lleó M., 2005, A&A, 432, 15
- Pounds et al. (2004) Pounds K. A., Reeves J. N., Page K. L., O’Brien P. T., 2004, ApJ, 605, 670
- Proga (2005) Proga D., 2005, ApJ, 630, L9
- Ptak et al. (1999) Ptak A., Serlemitsos P., Yaqoob T., Mushotzky R., 1999, ApJS, 120, 179
- Ranalli, Comastri, & Setti (2003) Ranalli P., Comastri A., Setti G., 2003, A&A, 399, 39
- Reeves et al. (2008) Reeves J., Done C., Pounds K., Terashima Y., Hayashida K., Anabuki N., Uchino M., Turner M., 2008, MNRAS, 385, L108
- Risaliti et al. (2003) Risaliti G., Elvis M., Gilli R., Salvati M., 2003, ApJ, 587, L9
- Sabra & Hamann (2001) Sabra B. M., Hamann F., 2001, ApJ, 563, 555
- Schartel et al. (2007) Schartel N., Rodríguez-Pascual P. M., Santos-Lleó M., Ballo L., Clavel J., Guainazzi M., Jiménez-Bailón E., Piconcelli E., 2007, A&A, 474, 431 (S07)
- Schartel et al. (2010) Schartel N., Rodríguez-Pascual P. M., Santos-Lleó M., Jiménez-Bailón E., Ballo L., Piconcelli E., 2010, A&A, 512, A75
- Schmidt & Green (1983) Schmidt M., Green R. F., 1983, ApJ, 269, 352
- Shi et al. (2007) Shi Y., et al., 2007, ApJ, 669, 841
- Strüder et al. (2001) Strüder L., et al., 2001, A&A, 365, L18
- Turner et al. (2001) Turner M. J. L., et al., 2001, A&A, 365, L27
- Véron-Cetty & Véron (2010) Véron-Cetty M.-P., Véron P., 2010, A&A, 518, A10
- Young et al. (2007) Young S., Axon D. J., Robinson A., Hough J. H., Smith J. E., 2007, Natur, 450, 74
- Zdziarski & Gierliński (2004) Zdziarski A. A., Gierliński M., 2004, PThPS, 155, 99