Department of Physics, Renmin University of China, Beijing 100872, China
National Laboratory of Solid State Microstructures and Department of Physics, Nanjing University, Nanjing 210093, China
Pairing symmetries (other than s-wave) Ternary, quaternary, and multinary compounds (including Chevrel phases, borocarbides, etc.) Magnetic properties including vortex structures and related phenomena (for vortices, magnetic bubbles, and magnetic domain structure
Intrinsic Percolative Superconductivity in KxFe2-ySe2 Single Crystals
Abstract
Magnetic field penetration and magnetization hysteresis loops (MHLs) have been measured in KxFe2-ySe2 single crystals. The magnetic field penetration shows a two-step feature with a very small full-magnetic-penetration field ( 300 Oe at 2 K), and accordingly the MHL exhibits an abnormal vanishing of the central peak near zero field below 13 K. The width of the MHL in KxFe2-ySe2 at the same temperature is in general much smaller than that measured in the relatives Ba0.6K0.4Fe2As2 and Ba(Fe0.92Co0.08)2As2, and the MHLs in the latter two samples show the normal central peak near zero field. All these anomalies found in KxFe2-ySe2 can be understood in the picture that the sample is percolative with weakly coupled superconducting islands.
pacs:
74.25.Rppacs:
74.70.Ddpacs:
74.25.Ha1 Introduction
The high temperature superconductivity discovered in the iron pnictides is a surprise since they contain iron elements which are normally believed to have strong magnetic moment and thus detrimental to superconductivity. The important issue concerning the superconductivity is the pairing mechanism. Experimentally it was found that the superconducting state is at the vicinity of a long range antiferromagnetic (AF) order[1], and the superconducting state is recovered when the AF state is suppressed. Further experiments have proved that the AF spin fluctuation[2] and the multi-band effect[3] are two key factors for driving the system into superconductive. These give partial support, although not the complete, to the picture that the pairing may be established via inter-pocket scattering of electrons between the hole pockets (around point) and electron pockets (around M point), leading to the pairing manner of an isotropic gap on each pocket but with opposite signs between them (the so-called S±).[4, 5] Recently a new Fe-based superconducting system (A= alkaline metals, x1, y) were discovered with the transition temperature above 30 K.[6] The interests to this system have been stimulated quickly since both the band structure calculations[7, 8] and the preliminary angle resolved photo-emission spectroscopy (ARPES) measurements[9, 10, 11] indicate that the band near the -point seems diving far below the Fermi energy, leading to the absence of the hole pockets which are prerequisites for the pairing model mentioned above. On the other hand, based on the simple charge counting, it was speculated that there must be Fe vacancies in the sample,[12] which may or may not order in the superconducting state.[13, 14] If the Fe vacancies are ordered, band structure calculations would predict that[7] there is probably a small band gap, which may interpret the insulating behavior of the so-called parent phase. Some preliminary experiments using transmission electron microscopy (TEM)[15]indicate that the Fe vacancies indeed form some kind of orders. Given the easy mobility of the Fe vacancies and probably also the potassium, cautions are required to draw any conclusions about the ordering form of Fe vacancies, especially when the samples are needed to be pre-treated for some measurements. Due to the uncertainties about the ordering of Fe vacancies, it is curious to know whether the superconducting state is uniform. In this Letter we report the measurements on the penetration of magnetic field into the single crystal sample. Our results clearly illustrate an abnormal magnetic field penetration in the single crystals, which can be easily explained as due to the percolative superconductivity.
2 Sample preparation and experiment
The KxFe2-ySe2 single crystals were synthesized by the Bridgeman method[16]. The typical dimensions of the samples for the magnetization measurements were 220.5 mm3. The magnetization measurements were done with the vibrating sample magnetometer based on the Quantum Design instrument physical property measurement system (PPMS) with the temperature down to 2 K and magnetic field up to 9 T. For investigating the magnetic field penetration, we have used a special power supply for the magnet, which can sweep the magnetic field in a rate as low as 0.4 Oe/s and the data were collected densely during the field sweeping process. All the magnetization measurements were done with the magnetic field parallel to c-axis. The resistive measurements were also measured leading to the determination of the upper magnetic fields H (Hc). The dc magnetization measurements were done with a superconducting quantum interference device (SQUID) of Quantum Design.
3 Results and discussion
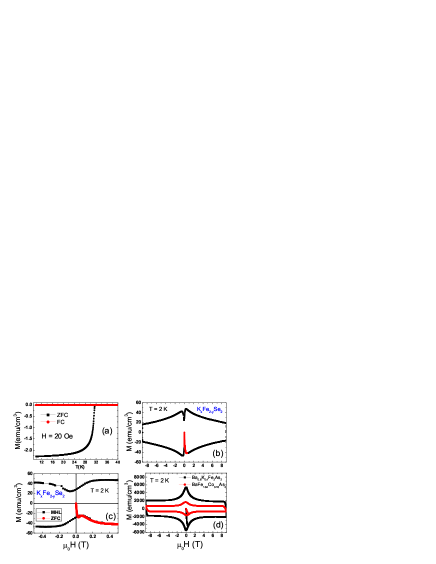
The temperature dependence of dc magnetization at H = 20 Oe for KxFe2-ySe2 and the magnetic hysteresis loops (MHL) for different iron-based superconductors are presented in Fig. 1. The large difference between zero-field cooling (ZFC) and field-cooling (FC) magnetizations indicates a strong magnetization hysteresis in the sample at a low field. A rough estimate on the diamagnetic signal indicates that the Meissner screening at H = 20 Oe is about 100 , this however does not suggest that the sample has a full superconducting volume. We will further illustrate this point below. The MHL measured at 2 K is presented in Fig. 1(b). One can easily see an abnormal minimum of magnetization near the zero field. From an enlarged view in the low field region during the magnetic penetration, as shown in Fig. 1(c), a feature of two-step penetration with a very small full-magnetic-penetration field ( 300 Oe at 2 K) is found in the initial part of the magnetic penetration curve which is corresponding to the abnormal minimum magnetization, the dip, in MHL when the field is reduced back to zero. After the initial dropping down at Hp1, the magnetization rises up again and reaches a maximum at about Hp2 = 0.5 T, as shown in Fig. 1(b) and (c). This unique two-step magnetic penetration is abnormal in a common sense to all other uniform type-II superconductors, but was observed in some overdoped cuprate superconductors in which the phase separation may occur.[17] In other iron-based superconductors such as Ba1-xKxFe2As2 (BaK122), Ba(Fe1-xCox)2As2 (BaFeCo122) and so on, a sharp magnetization peak can be observed near zero field (shown in Fig. 1(d)),[19, 20] and just one magnetic penetration peak near about H = 0.5 T can be found in the MHL. In additional to the abnormal minimum of magnetization near zero field and the two-step penetration on the MHL curve below about 13 K, when compared to BaK122 and BaFeCo122, the width of the MHL for KxFe2-ySe2 at the same temperature is about 50 to 100 times smaller, which suggests a low superconducting critical current density in the present system.
In the superconducting state of a uniform type-II superconductor, the condensate of the superconducting electrons will expel the external magnetic field. When the external field H is higher than the lower critical field Hc1 at the edge, the quantized magnetic vortices will be formed and penetrate into the interior of the sample. The spatial distribution of the density of these vortices, also called as flux profile, is illustrated in the inset of Fig. 2(b). The curve of M vs. H will deviate from the linear relation M = -H/4 (Meissner screening) at Hc1 for a cylinder sample (assuming that the Bean-Livingston barrier and the geometrical barrier of the flux penetration is negligible). The magnetization M will continue to grow until the flux fronts of both side meet at the center of the sample (H = Hp). By further increasing the external field, more magnetic vortices will creep into the sample, and the magnetization will start to drop because the slope of dH/dx becomes smaller. Therefore, for any uniform superconductor, a central magnetization peak will appear near zero field due to the penetration of magnetic flux. Based on the simple Bean critical state model, one can estimate the full penetration magnetic field as with the critical current density. Taking = 10 and based on the Bean critical state model, we have across a sample area of 1 mm. Normally this value will be reduced because of the demagnetization effect. As an example, in Fig. 1 (d) we show MHLs measured at 2 K for optimally doped BaK122 and BaFeCo122 single crystals. A clear penetration peak can be observed at about 0.5 T here for both samples. When the field is reduced down from a high value (from both the positive and the negative side), a central magnetization peak will appear near zero field due to the establishing of a large superconducting current.
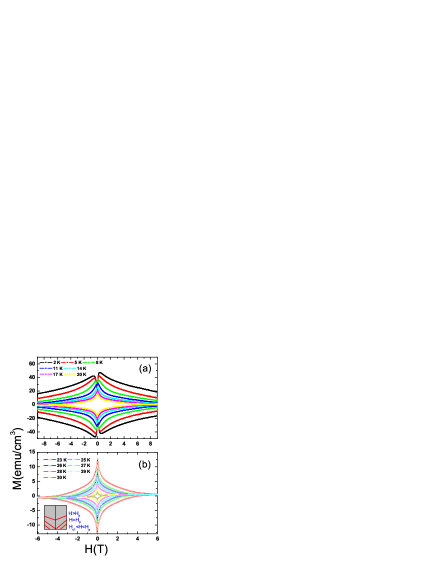
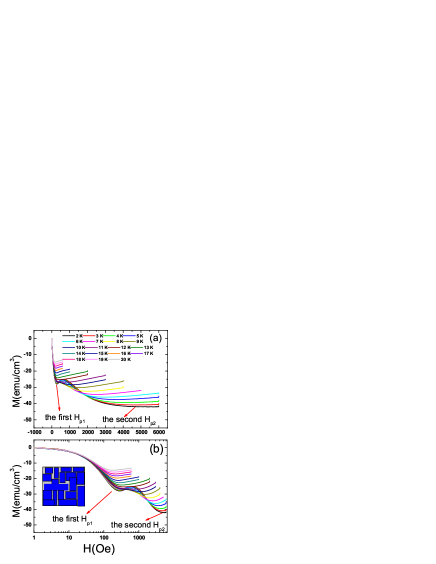
Magnetic hysteresis loops of the KxFe2-ySe2 samples measured at different temperatures (from 2 K to 30 K) are presented in Fig. 2. When the temperature is below about 13 K, the MHLs exhibit the abnormal magnetic penetration effect, with a two-step structure. A similar phenomena was observed in the same system with the samples synthesized in a different way.[18]. While at high temperatures, the MHL becomes ”normal” with only one central peak, instead of the dip near zero magnetic field. As mentioned above, in other iron-based superconductors, such as optimally doped BaK122 and BaFeCo122, a sharp central magnetization peak was observed near zero field even at the lowest temperature. This central peak can be understood in the following way: when the external field is swept back to zero, because of the small absolute value of H(x) near the edge, the slope of H(x) and thus the critical current density near the edge is much larger than that in the interior part and then a much enhanced magnetization will appear. In order to investigate the abnormal dip near zero field, we measured the magnetic penetration from 2 K to 20 K in a very detailed way with a very slow magnetic field sweeping rate (dH/dt = 5 Oe/s). Fig.3 shows the magnetization vs. field curves in the initial penetration period. The two-step feature with a small full penetration can be observed below 13 K. The first-step magnetic penetration field (Hp1) is very small( 300 Oe at 2 K), which is corresponding to the abnormal dip of the MHL when the field is swept continuously through the zero field. This first penetration peak is followed by a second one at about 0.5 T at 2 K. With the temperature increasing, the first-step penetration magnetization decreases gradually while the position of Hp1 changes little. The second-step penetration magnetic field() shifts to a lower field with the temperature increasing and finally converge with the first-step penetration field on the MHL curve measured at 13 K.
The two-step penetration and the abnormal dip near zero field on the MHL for KxFe2-ySe2 can be understood with the picture that the sample is percolative with weakly coupled superconducting islands. In low field region, the magnetic flux will penetrate into the center of the sample easily through the non-superconducting channels and it is difficult to establish a high critical current density near zero field. So the flux fronts can quickly meet at the center of the sample with a very weak full penetration field (H 300 Oe). For the same reason, the central peak of MHL cannot be observed since the large critical current density cannot be established. When the field is further increased, the flux which already reaches the center of the sample will penetrate the individual superconducting islands again. This leads to the observation of the second penetration peak at Hp2. In samples with poorer transitions, we found that the two-step magnetic transition and the dip of the MHL at zero field cannot be observed, since the islands are far apart each other and the magnetic field penetrate the individual grains directly. We should emphasize that the abnormal magnetic penetration in our samples cannot be simply attributed to the second peak (or called as the fish-tail) effect of magnetization because of the following two reasons. Firstly, the magnetic fields for the two maxima on the MHL of KxFe2-ySe2 are too small to compare with those in BaK122 and BaFeCo122. In the latter two cases, the magnetic penetration field is about 0.5 T and the second peak of the magnetization locates at a very high field (above 9 T at 2 K).[19, 20] Secondly, as mentioned before, the width of the MHL is about 50 to 100 times smaller in KxFe2-ySe2 than in optimally doped BaK122 and BaFeCo122.
In KxFe2-ySe2 it becomes well known that there are Fe vacancies. It was proposed that the Fe vacancies may order in different structures when y = 0.5 or y = 0.4.[12] Some preliminary experiments using the electron transmission microscope (TEM) do find the order of Fe vacancies.[15] Our previous experiment indicates that the superconductivity can be recovered from an insulating parent phase just by post-annealing and fast quenching the sample, this may suggest that the random distribution of the Fe vacancies help to stabilize the superconducting phase.[14] Regarding the uncertain structural forms of these Fe vacancies, it is quite possible to have a phase separated state which contains the superconducting islands (with randomly distributed or low density[21] Fe vacancies) surrounded by the non-superconducting area (with ordered or high density Fe vacancies). These non-superconducting area may possess the insulating behavior. Regarding the sharpness of the magnetic transition and the perfect Meissner screening, our sample is among the best class reported so far. This allows us to speculate that almost all the superconducting samples reported so far in this family may have the same feature of phase separation. which is agreeable with other measurements results[22, 23, 24]. the global measurements of magnetization.
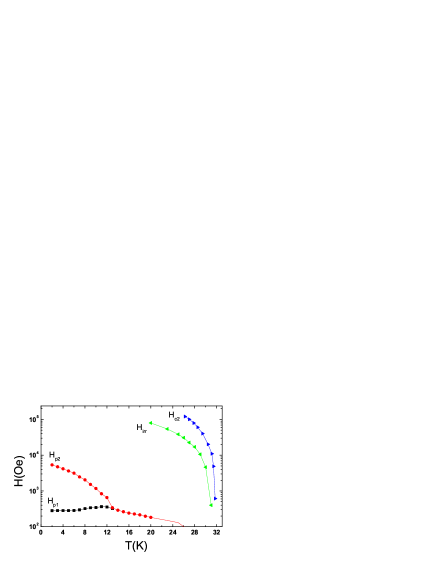
In Fig.4 we show the phase diagram of the KxFe2-ySe2 single crystals. Since the upper critical field Hc2 and the irreversibility field Hirr are determined by the superconducting islands here, therefore they can be treated as the intrinsic properties of the KxFe2-ySe2 system. One can see that both the Hc2(T) and Hirr(T) are very high and very close to their relatives BaK122 and BaFeCo122. The second penetration field Hp2 in our picture corresponds actually to the magnetic penetration of the superconducting islands. Above about 13 K, the first penetration and the second one merge, this is because the weak coupling between the superconducting islands in the high temperature region becomes very weak against the magnetic penetration. Our picture naturally explains why the residual resistivity is large and the normal state resistivity exhibits a hump-like temperature dependence. All these are induced by the composed contribution of metallic islands (superconducting at low-T) and the insulating surrounding areas. A direct proof to this picture would need a local scanning probe in the superconductng state.
4 Conclusion
In summary, we have measured the magnetic penetration and MHLs in KxFe2-ySe2 single crystals. An abnormal two-step magnetic penetration, a dip instead of a peak near zero field on the MHL and a much reduced magnitude of the MHL were observed. All these anomalous features can be understood with the phase separation picture, perhaps electronic in origin. Regarding the uncertain structural form of the Fe vacancies and their influence on the electronic properties, we argue that the sample has percolative superconductivity. This picture recalls local probe measurements in the superconducting state.
Acknowledgements.
We appreciate the useful discussions with Takashi Imai and Minghu Fang. This work is supported by the NSF of China, the Ministry of Science and Technology of China (973 projects: 2011CBA001000), and Chinese Academy of Sciences.References
- [1] \NameDe la Cruz C. et al. \REVIEWNature453 2008 899.
- [2] \NameNing F. L. et al. \REVIEWPhys. Rev. Lett 104 2010 037001.
- [3] \NameFang L. et al. \REVIEWPhys. Rev. B 80 2009 140508(R).
- [4] \NameMazin I. I. et al. \REVIEWPhys. Rev. Lett. 101 2008 057003.
- [5] \NameKuroki K. et al. \REVIEWPhys. Rev. Lett. 101 2008 087004.
- [6] \NameGuo J. et al. \REVIEWPhys. Rev. B 82 2010 180520(R).
- [7] \NameNebrasov I. A et al. \REVIEWJETP Letters 93 2011 166.
- [8] \NameYan X.-W.et al.arXiv:1012.5536 (2011)
- [9] \NameZhang Y. et al. \REVIEWNature Materials 10 2011 273.
- [10] \NameMou D. X. et al. \REVIEWPhys. Rev. Lett. 106 2011 107001.
- [11] \NameQian T. et al. \REVIEWPhys. Rev. Lett. 106 2011 187001.
- [12] \NameFang M. H. et al. \REVIEWEPL 94 2011 27009.
- [13] \NameBao W. et al. arXiv:1102.3674 (2011).
- [14] \NameHan H. et al. arXiv:1103.1347 (2011).
- [15] \NameLi J.Q et al. \REVIEWPhys. Rev. B 83 2011 140501(R).
- [16] \NameWang D. M. et al. \REVIEWPhys. Rev. B 83 2011 132502(R).
- [17] \NameWen H. H. et al. \REVIEWEPL 57 2002 260.
- [18] \NameGao Z. S. et al. arXiv:1103.2904 (2011).
- [19] \NameYang H. et al. \REVIEWAPL 93 2008 142506.
- [20] \NameShen B. et al. \REVIEWPhys. Rev. B 81 2010 014503.
- [21] \NameHu R. et al. \REVIEWSupercond. Sci. Technol. 24 2011 065006.
- [22] \NameYe. Z. R. et al. arXiv:1105.5242 (2011).
- [23] \NameLi. W. et al. arXiv:1108.0069 (2011).
- [24] \NamePark. J. T. et al. arXiv:1107.1703 (2011).