The Planetary Nebulae Population in the Central Regions of M32: the SAURON view
Abstract
Extragalactic Planetary Nebulae (PNe) are not only useful as distance signposts or as tracers of the dark-matter content of their host galaxies, but constitute also good indicators of the main properties of their parent stellar populations. Yet, so far, the properties of PNe in the optical regions of galaxies where stellar population gradients can be more extreme have remained largely unexplored, mainly because the detection of PNe with narrow-band imaging or slit-less spectroscopy is considerably hampered by the presence of a strong stellar background. Integral-field spectroscopy (IFS) can overcome this limitation, and here we present a study of the PN population in the nearby compact elliptical M32. Using SAURON data taken with just two 10-minutes-long pointings we have doubled the number of known PNe within the effective radius of M32, detecting PNe five times fainter than previously found in narrow-band images that collected nearly the same number of photons. We have carefully assessed the incompleteness limit of our survey, and accounting for it across the entire range of luminosity values spanned by our detected PNe, we could conclude despite having at our disposal only 15 sources that the central PNe population of M32 is consistent with the generally adopted shape for the PNe Luminosity Function and its typical normalization observed in early-type galaxies. Furthermore, owing to the proximity of M32 and to ultraviolet images taken with the Hubble Space Telescope, we could identify the most likely candidates for the central star of a subset of our detected PNe and conclude that these stars are affected by substantial amounts of circumstellar dust extinction, a finding that could reconcile the intriguing discrepancy previously reported in M32 between the model predictions and the observations for the later stages of stellar evolution. Considering the modest time investment on a 4m-class telescope that delivered these results, this study illustrates the potential of future IFS investigations for the central PNe population of early-type galaxies, either with existing SAURON data for many more, albeit more distant, objects, or from campaigns that will use the future generations of integral-field spectrographs that will be mounted on 8m-class telescopes, such as MUSE on the Very Large Telescope.
keywords:
galaxies: elliptical and lenticular – galaxies: stellar content – galaxies: individual: M32 – ISM: planetary nebulae: general – stars: AGB and post-AGB1 Introduction
In the field of extra-galactic astronomy, Planetary Nebulae (PNe) are perhaps regarded mostly either as useful indicators for the distance of their galactic hosts (Ciardullo et al., 1989; Jacoby, Ciardullo, & Ford, 1990; Jacoby et al., 1992), thanks to the almost universal – though not fully understood – shape of their luminosity function (PNLF, generally in the [O iii] emission), or as tracers of the gravitational potential in the outskirts of galaxies (Romanowsky et al., 2003; Douglas et al., 2007). Yet, as summarised in the review of Ciardullo (2006), PNe can also be used as probes of their parent stellar population. For the closest or brightest PNe, the detection of critical but weak diagnostic emission lines such as [O iii] allows to directly measure the temperature of the ionised-gas and thus the metallicity of PNe, which in turn makes it possible to constrain the chemical enrichment history of their host galaxy (e.g., Richer, Stasińka, & McCall, 1999; Jacoby & Ciardullo, 1999; Dopita et al., 1997). In more distant galaxies, it is still possible to place useful constraints on the Oxygen abundance of PNe by using brighter lines such a [O iii], H, [N ii], H or [S ii], or to investigate the star-formation history of a galaxy by studying the shape and normalisation of the PNLF (e.g., Marigo et al., 2004; Schönberner et al., 2007; Méndez et al., 2008). In fact, understanding the origin of the PNLF is a puzzle that, once solved, promises to reveal new clues on the late stages of stellar evolution and on the formation of PNe themselves (e.g., Ciardullo et al., 2005; Buzzoni, Arnaboldi, & Corradi, 2006).
In this context it is important to note that most known extra-galactic PNe have been found in the outskirts of their hosts, whereas the PNe population of the optical regions of galaxies remains largely unexplored. Most PNe studies have indeed been carried out through narrow-band imaging (e.g., Ciardullo et al., 1989) or slit-less spectroscopy (e.g., Douglas et al., 2007), where the detection of PNe is considerably hampered by the presence of a stellar background. Yet, it is in central regions of galaxies where stellar population gradients can be more extreme and where the stellar ages, metallicities and element abundances can be the most diverse between different galaxies. Integral-field spectroscopy can overcome the previous instrumental limitations since it allows for the careful modelling of a galaxy’s integrated stellar spectrum, and this paper aims to demonstrate the potential of IFS for studying the properties on PNe in the optical regions of galaxies using SAURON observations for the compact elliptical M32 (NGC221), our closest early-type galaxy.
This work is organized as follows. In §2, we briefly review the acquisition and reduction of the SAURON data for M32. In §3 we detail how we optimised the extraction of the nebular emission in the SAURON data and how we proceeded to identify and measure the [O iii] flux of the PNe in M32. In §4 we present our main results, assessing in particular whether our data are consistent with the generally adopted shape for PNLF and the value for its normalisation that is most commonly observed in early-type galaxies. In §5 we discuss these findings by linking them to the known properties of the stellar population of M32, and in particular to the apparent dearth of post-asymptotic giant branch stars that was reported by Brown et al. (2000). Finally, in §6 we draw our conclusions and consider some future prospects for more IFS studies of the PNe populations in the central regions of galaxies.
2 Observations and Data Reductions
M32 (NGC221) was one of the special objects that were observed over the course of the SAURON representative survey (de Zeeuw et al., 2002), and more specifically during the last run of that observing campaign at the 4m William Herschel Telescope and following the installation of a new volume phase-holographic grating (Emsellem et al., 2004). The central regions of M32 were observed with two offset pointings during 600s for each exposure, while using the low-resolution mode of SAURON that gives a field of view of fully sampled by square lenses (for more details on the instrument see Bacon et al., 2001). The data from each pointing were reduced similarly to the data obtained for the objects of the main SAURON sample (see Emsellem et al., 2004; Falcón-Barroso et al., 2006), and the resulting datacubes were merged and resampled in spatial elements each corresponding to spectra with a final spectral resolution of 4.2Å (FWHM).
The present SAURON data for M32 were already used to extract the stellar kinematics that was modeled by Cappellari et al. (2006) and the only difference with the data used in that work and other papers of the SAURON project is that here we did not perform any Voronoi spatial binning (Cappellari & Copin, 2003). This was done to avoid swamping the signal of the weaker PNe against an increased stellar background, and to allow for a more consistent analysis of the flux distribution from each of the unresolved PN that we may detect.
3 Data Analysis
3.1 Emission-line Measurements
In order to identify PNe in M32 and measure their flux in the [O iii] line we first need to separate as accurately as possible the stellar and nebular contribution to each of the SAURON spectra that sample the central regions of this galaxy. For this purpose we used the method of Sarzi et al. (2006, hereafter Paper V following the notation of the SAURON project) whereby a set of stellar templates and Gaussian emission lines are fitted simultaneously to the spectra111 In practice this is achieved by using the IDL code GANDALF (available at http://star-www.herts.ac.uk/sarzi) and the stellar kinematics extracted with the pixel-fitting IDL code pPXF (Cappellari & Emsellem, 2004, http://www-astro.ox.ac.uk/mxc/idl) , while following also the approach of Sarzi et al. (2010) to further improve the match to the stellar continuum and ensure that the ionised-gas emission is extracted from the subtraction of a physically motivated stellar model. This is achieved by using, instead of standard template libraries based on stellar spectra or single-age stellar population models, a more appropriate set of empirical templates that are constructed while matching a number of high-quality SAURON spectra extracted from regions in the target galaxy where no ionised-gas emission is found.
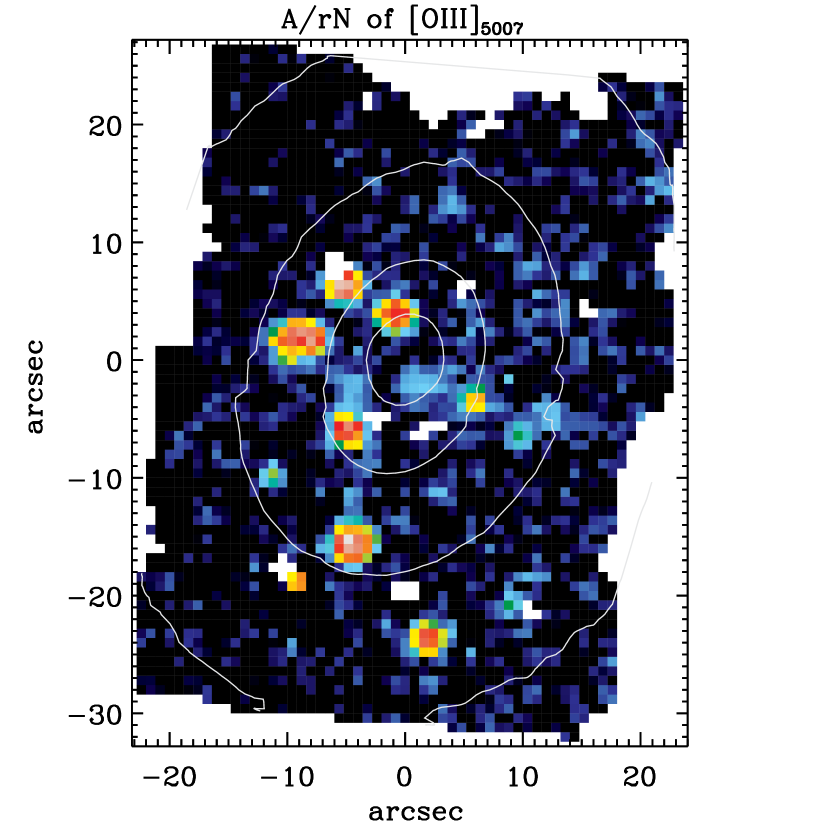
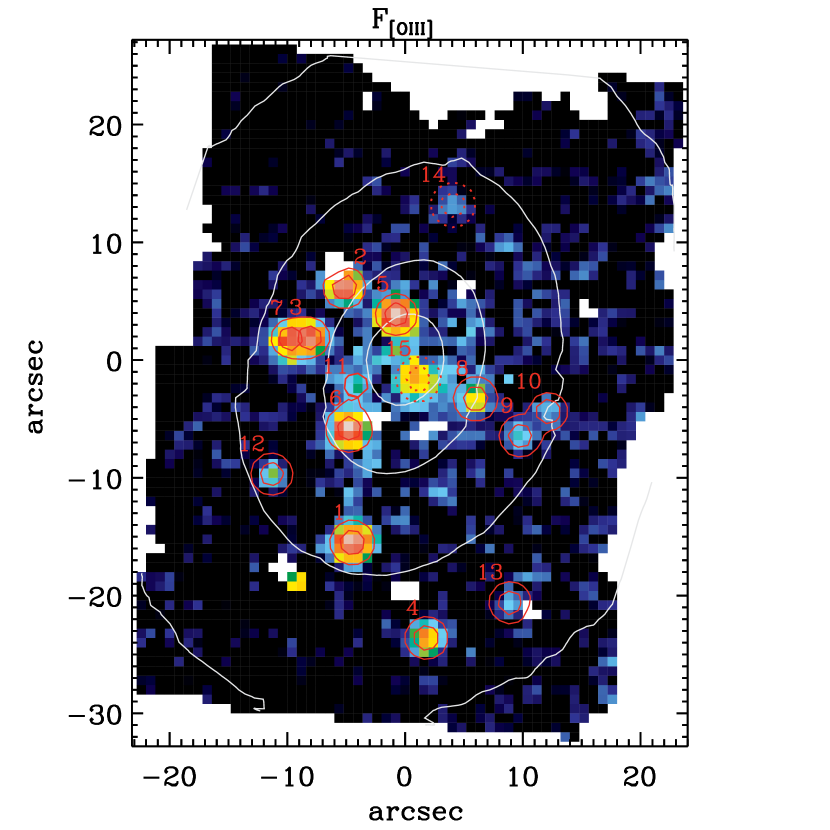
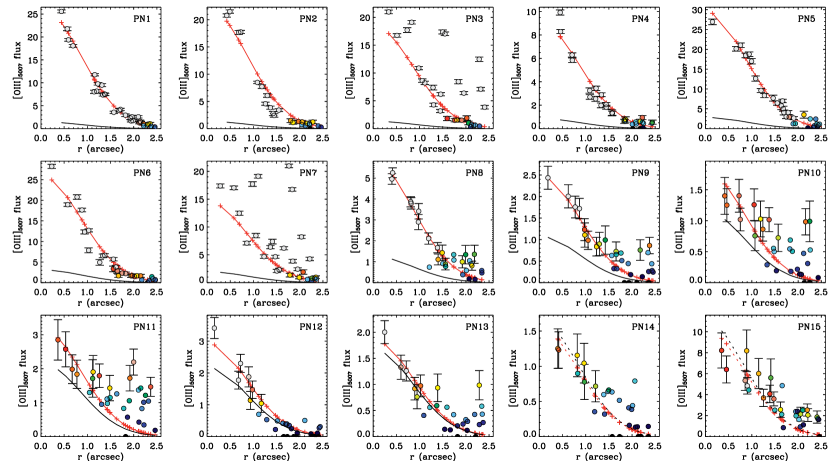
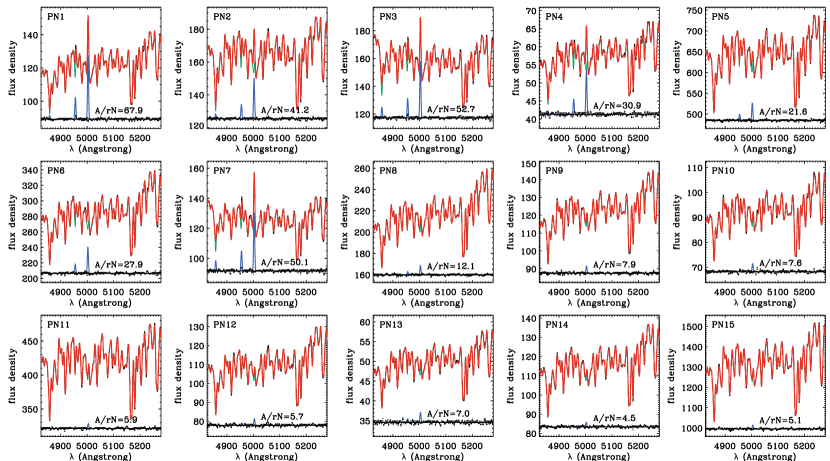
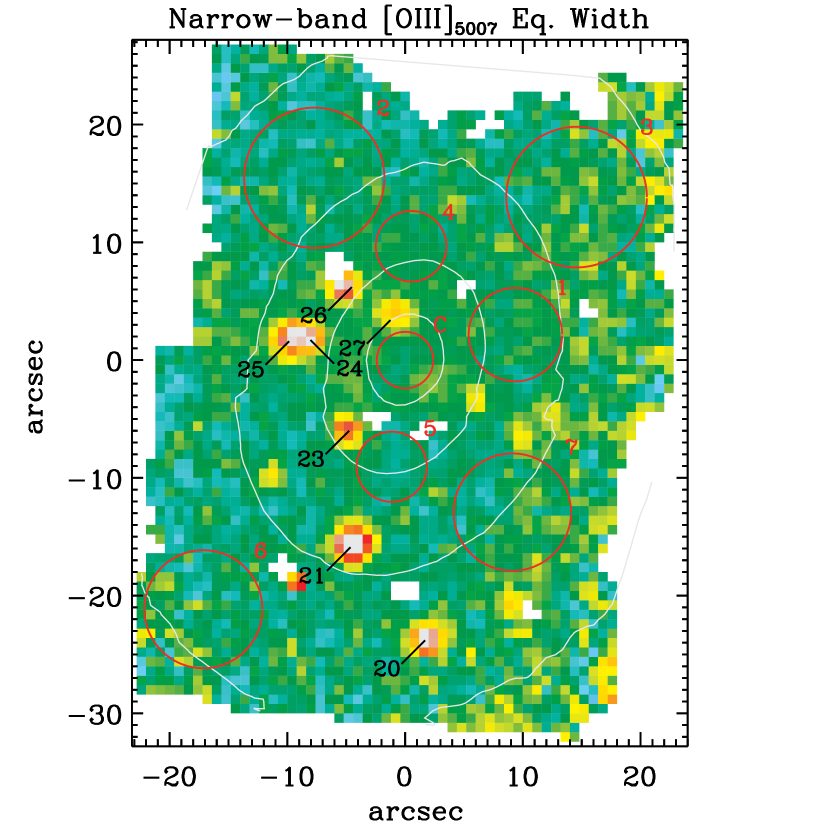
Fig. 1 shows how we identified such emission-line free regions in M32 using an [O iii] narrow-band image made from the SAURON data themselves (see the caption of Fig. 1 for details). Each of the spectra extracted from the circular apertures shown in Fig. 1 was fitted with the pixel-fitting code of Cappellari & Emsellem (2004), over the full wavelength range of the SAURON data and using the entire MILES template library of Sánchez-Blázquez et al. (2006). Both the quality of such aperture spectra and of our fit to them is very high, with values for the ratio between the median level of the spectra () and the average level of the fit residuals (residual noise, ) ranging from 100 to over 400, with on average. The weights assigned to the MILES stellar templates during each of these fits were then used to combine the MILES spectra into optimal templates that, owing to the excellent quality of our fit, can be in practice regarded as M32 spectra deconvolved from the line-of-sight kinematical broadening. Fig. 1 also illustrates how our emission-free apertures are evenly spread over the SAURON field of view, which ensures that their corresponding optimal templates can account for the presence of stellar population gradients (Rose et al., 2005) when they are used to match each of the single spectra sampling the central regions of M32.
Fig. 1 also locates the PNe found in the narrow-band survey of Ciardullo et al. (1989), and reveals already the presence of weaker and isolated peaks of 5007Å flux that may also originate from the unresolved [O iii] emission of PNe. If this is the case, then the nebular spectra observed where the flux of an unresolved PN is scattered by the atmospheric point-spread function (PSF) should be characterised by large values of the [O iii]/H ratio, virtually no [N i] emission, and by very narrow lines that would not be resolved in the SAURON spectra. The standard fitting strategy of Paper V, whereby the [O iii] doublet is fitted first and the H flux is subsequently extracted holding the H line profile to that of the [O iii] lines, is therefore appropriate for isolating the emission of PNe, and here we only further imposed a fixed width on the [O iii] lines, for an observed velocity dispersion of 108 that corresponds to the spectral resolution of the SAURON data (§ 2).
Fig. 2 shows the map of the ratio between the best-fitting Gaussian amplitude for the [O iii] line and the noise level in the fit residuals. In Paper V we concluded that a minimum value of was required to detect [O iii] emission, although this was while letting the width of the lines free to vary. Since instead here we have fixed the [O iii] line width, our fits involve one less free parameter and we can measure unbiased [O iii] fluxes also down to a threshold, similarly to the case of H line measurements of Paper V when the [O iii] line profile was imposed on the H line. With such a detection limit, Fig. 2 confirms the presence of several isolated weak patches of detected [O iii] emission beside the PNe of Ciardullo et al. (1989), and shows the absence of a diffuse ionised-gas component that is otherwise commonly found in early-type galaxies (Paper V).
3.2 PNe Detection and Flux Measurements
To measure the flux of any known or possible PNe in the SAURON field-of-view, and at the same time establish whether a weak patch of [O iii] emission is indeed consistent with the flux distribution expected from an unresolved PN, we fitted each of the [O iii] sources in Fig. 2 with a circular Gaussian function that is meant to represent the shape of the PSF of our observations. The full-width at half maximum (FWHM) of such a PSF was first measured by matching the most cleanly detected of our sources (corresponding to source 21 of Ciardullo et al., 1989), and subsequently held constant when measuring the flux of other known or candidate PNe. The Gaussian model was resampled in SAURON bins before comparing it to the data, and for close PN sources care was taken to deblend their fluxes by fitting simultaneously two or more Gaussian functions. Based on these fits, we deemed a given source of [O iii] emission a detected PN if within at least the FWHM of the Gaussian model. The model itself was then used to measure the [O iii] flux of the PN, by integrating the entire Gaussian function out to radii where otherwise the [O iii] emission generally would not be detected or could come from other nearby PNe.
According to the previous detection criterion we find 13 PNe in the central regions of M32 observed by SAURON, with two additional sources that barely miss the detection threshold due to just one value of being less then 3 within the FWHM of the models, which turned out to be 194 for a . Each of these sources is identified and labelled in Fig. 3, which maps the [O iii] flux observed in M32 and shows with red contours the best fitting Gaussian models to each of the detected PNe, including the questionable sources with dotted lines. The fit to the [O iii] flux distribution of these sources can be better appreciated in Fig. 4, where the radial profile for the [O iii] flux of each PN is plotted together with its best-fitting Gaussian model. In Fig. 4 the [O iii] data points are colour-coded according to the value of the ratio measured in each bin to illustrate that down to our [O iii] detection threshold of the [O iii] fluxes follow very well the PSF model, which provides an independent check of our detection criterion for the [O iii] emission.
Fig. 4 also shows how for each source we determine the minimum flux that we could have measured at the particular position of the PN. In fact, we can expect such detection limits to vary across the galaxy, and more specifically to increase towards the center where only the brightest PNe lead to [O iii] lines of sufficient strength to stick out above the higher level of statistical noise that comes with a brighter stellar continuum. Following our detection criterion for PNe, we set the detection limit at the location of each our PN sources as the flux of the Gaussian model (shown with a black line in Fig. 4) that would match the [O iii] fluxes if these, and the corresponding values of the [O iii] line amplitude , would be rescaled until the minimum value inside a FWHM reaches the threshold of . As expected, for the doubtful sources the detection limits exceed the observed flux of the best model, since the minimum value is already less than 3 and therefore the data have to be scaled up, instead of down (although by just 7% in both cases). The significance of the detection of our PNe sources determines the order in which the PNe are labelled in Figs. 3, 4 and subsequent figures.
To further illustrate the degree to which all the PNe shown in Fig. 3 are detected, for each source we added all the SAURON spectra within a radius from the center of the best-fitting Gaussian models (corresponding to all the bins plotted in the panels of Fig. 4), and fitted the resulting spectra with our standard procedure. Fig. 5 shows such aperture spectra and our best fit to both the nebular emission from each PN and to the stellar continuum observed along the line-of-sight towards them. We note that the values for the [O iii] emission measured in these spectra always indicate a detection, even within a aperture that is 6.5 times wider than the FWHM region where we decided to assess the detection of PNe and within which we might have expected the emission from the weakest of our PNe to be lost against a larger stellar background. That this is never the case, however, suggests that the two questionable sources might as well be regarded as marginal detections, which is why we will keep considering them in the remainder of the paper.
To conclude this section in Tab. 1 we list, for both firmly and barely detected PNe in M32, the position relative to the center of the galaxy, the total flux of the [O iii] emission with its corresponding detection limit, the velocity of each source, and, when the H line was also detected, the average value of the [O iii]/H ratio. The latter two measurements are based on fits to spectra similar to those presented in Fig. 5, but now extracted within a FWHM-wide aperture (rather than within a radius ) in order to maximise the emission-line signal and better isolate the kinematics of PNe that are close to each other in projection.
| ID | x-off | y-off | [O iii]/H | |||
|---|---|---|---|---|---|---|
| (1) | (2) | (3) | (4) | (5) | (6) | (7) |
| 1 | -4.48 | -15.50 | 136.7 | 7.6 | -214.2 | 11.5 |
| 2 | -5.16 | 6.18 | 101.5 | 6.1 | -240.9 | 13.8 |
| 3 | -8.13 | 1.91 | 96.3 | 6.9 | -190.2 | 6.3 |
| 4 | 1.81 | -23.60 | 46.5 | 4.4 | -216.1 | 7.8 |
| 5 | -0.74 | 3.86 | 152.3 | 14.5 | -260.0 | 13.3 |
| 6 | -4.75 | -5.83 | 132.9 | 15.9 | -240.4 | 16.8 |
| 7 | -9.75 | 1.84 | 76.2 | 10.2 | -225.6 | 7.7 |
| 8 | 5.99 | -3.29 | 29.9 | 6.4 | -188.9 | – |
| 9 | 9.78 | -6.45 | 13.1 | 5.6 | -188.1 | – |
| 10 | 12.18 | -4.38 | 9.4 | 6.0 | -147.5 | – |
| 11 | -4.20 | -2.09 | 16.7 | 11.3 | -155.6 | – |
| 12 | -11.33 | -9.69 | 15.1 | 11.2 | -133.6 | – |
| 13 | 8.92 | -20.59 | 9.1 | 8.2 | -189.1 | – |
| 14 | 4.08 | 13.19 | 7.9 | 8.5 | -231.6 | – |
| 15 | 1.15 | -1.62 | 52.6 | 56.6 | -148.1 | – |
Notes: (1) PN ID. (2)–(3) R.A. and Declination offset position, in arcseconds, from the center of M32. (4)–(5) Total [O iii] flux and detection limit, in . (6) Velocity in , as measured in spectra extracted within a FWHM wide aperture around the center of the best-fitting Gaussian models shown in Fig. 3. (7) [O iii]/H in the same spectra, when H is detected. As shown in Fig. 1 our sources 1 to 7 were already detected by Ciardullo et al. (1989) who, in the order, labelled them with the ID of 21, 26, 24, 20, 27, 23 and 25.
4 Results
The analysis described in the previous section has delivered the solid detection of 13 PNe within the optical regions of M32, with an additional 2 sources where the observed [O iii] flux distribution is only marginally consistent with the emission from an unresolved PN. Given the systemic velocity of M32 and its average stellar velocity dispersion within one effective radius (Cappellari et al., 2006), the velocities listed in Tab. 1 show that the observed PNe very likely belong to M32, rather than to the disk or halo of M31 where PNe move on average at a speed of (Merrett et al., 2006). In fact, the case for membership in M32 holds even at a local level, when the PNe velocity is compared with the mean stellar velocity and velocity dispersion measured along the line-of-sight towards their location. Using FWHM-wide aperture spectra to better separate the velocity of blended or close PNe and larger -wide apertures to extract robust and measurements also in the outskirts of M32, we found that only in 3 cases , even less often than what is normally expected for 15 sources. Tab. 1 also lists, when we could measure it, large values for the [O iii]/H ratio, thus showing that these are indeed high-ionisation sources most likely consistent with PN spectra. Finally, we note that for the PNe that were also detected by Ciardullo et al. (1989) our flux values agree fairly well, within a few percent, with the values reported in that work. For instance, for the brightest PN in our sample (source 5) we measure a flux that is only 8% fainter than what was found by Ciardullo et al. (1989, source 27 in their Tab. 7).
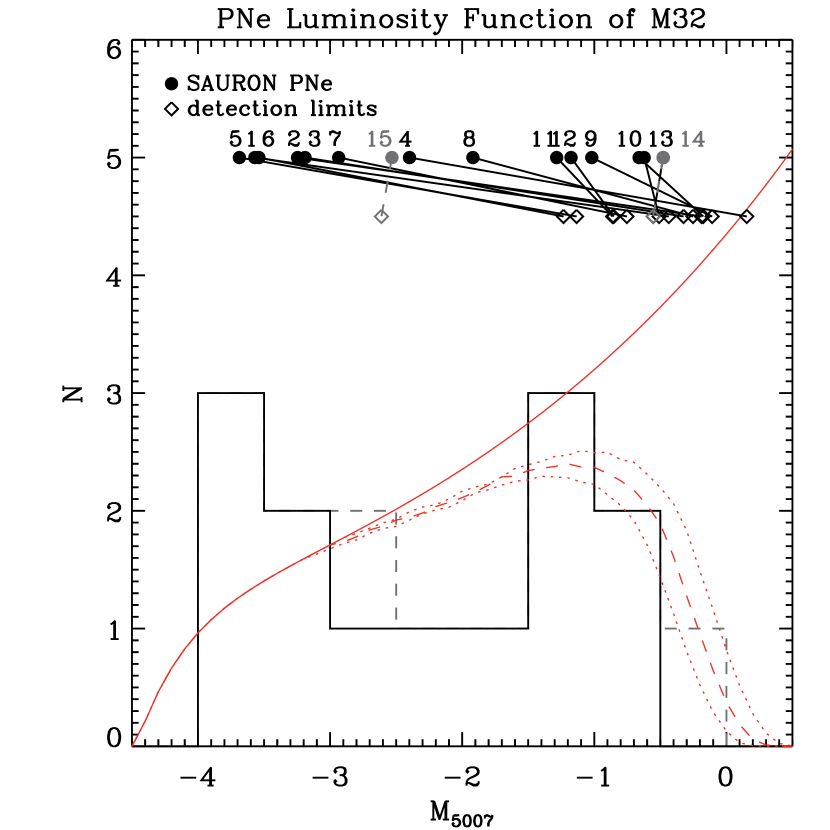
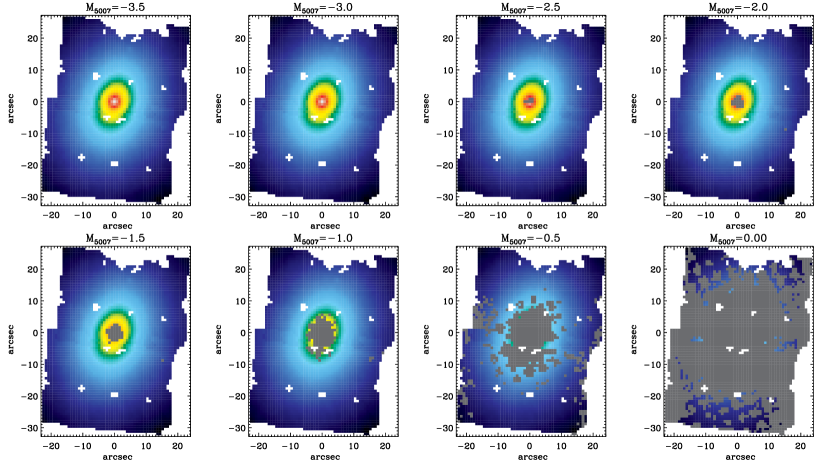
Fig. 6 presents the luminosity function of the PNe found in the optical regions of M32 by our SAURON observations, which essentially map this galaxy within its effective radius . To construct such a PNLF we followed the definition of Ciardullo et al. (1989) to compute the apparent V-band magnitude of our sources, and derived the values for the absolute magnitude that are shown in Fig. 6 by adopting a distance modulus of 24.49 magnitudes. This corresponds to a distance of 791 kpc, and it is the same value based on the surface-brightness fluctuation measurements of Tonry et al. (2001) that was used by Cappellari et al. (2006).
Fig. 6 also shows with a red line the expected form for the PNLF introduced by Ciardullo et al., who combined the simple Henize & Westerlund (1963) model for a population of slowly fading and expanding PN envelopes with a sharp exponential cutoff at the high-mass end. The shape of our observed PNLF is inconsistent with such a theoretical curve, but this is hardly surprising considering that at the faint end our PN number counts are affected by incompleteness. To a first approximation the onset of this bias can be appreciated by noticing in Fig. 6 how the values for the absolute magnitude corresponding to the detection limits of each of our sources (shown with open diamonds) pile up from a and brighter , corresponding to an apparent magnitude limit of . In general, while looking at bigger galaxies than M32 with a correspondingly larger number of PNe or at very close objects such as the large and small Magellanic clouds, other studies use the PNe that are found within the completeness limit in order to determine both the best normalisation for the theoretical PNLF and to test whether this could in fact be considered the parent distribution for the data. In the case of M32, however, there are simply not be enough PNe within the completeness limit (say for , taking a conservative guess from Fig. 6) to confidently carry out such a measurement and test. We therefore decided to first understand how our observational biases would affect the theoretical form of Ciardullo et al. for the PNLF, to then test whether all our data, over the entire range, could have been drawn from the corresponding completeness-corrected model PNLF, while also determining the best normalisation for it.
Fig. 7 presents simulations designed to show how we derive the completeness function of our observations, that is, the probability as a function of absolute magnitude that a PN of that brightness could be detected across the entire field-of-view of the SAURON observations for M32. Since at any given luminosity the number of expected PNe scales with the total number of stars, such a probability is just the fraction of the total stellar flux encompassed by our field-of-view that is observed within the area over which PNe of a given absolute magnitude could be detected. To then decide whether a PN of given could be detected at any given position, we generated a Gaussian PN model of total flux corresponding to the apparent magnitude and, using the values of obtained from our spectral fits across the entire field-of-view, simply checked whether within a FWHM of the Gaussian model. As Fig. 7 illustrates, starting from an absolute magnitude of () it becomes more and more difficult to detect PNe near the central region of the galaxy, with the area of non-detectability (shown with grey bins) quickly expanding outward for PNe fainter than (). More specifically, we are 100% complete down to , whereas we lose about 5% of PNe with an absolute magnitude of and nearly 26% of those with . Fig. 7 shows simulations for just eight values and while placing the Gaussian PN models at the center of each SAURON bin, but to derive the completeness function and the uncertainties associated with it we adopted a more refined grid of values and accounted for the impact of randomly placing the Gaussian models within the SAURON bins.
When the theoretical PNLF of Ciardullo et al. is multiplied by the completeness function that we have just derived, we finally obtain the completeness-corrected prediction for the expected number of PNe in M32 that is shown by the red dashed curve in Fig. 6, with the dotted red lines tracing the scatter in this correction due to the exact PNe position in the SAURON bins. A Kolgomorov-Smirnov test reveals that this corrected PNLF can be regarded as the parent distribution for our data, since there is a 82% probability that all of our 15 PNe could have been drawn from it, and a 52% probability when considering only the 13 secure PNe. By integrating the completeness-corrected luminosity function we obtain the total number of PNe that we would expect to detect, and by matching this value with the actual number of observed PNe, 15 including marginal detections, we obtain our best estimate for the normalisation of the PNe luminosity function of M32 within the region mapped by our SAURON observations. Such a normalisation is generally expressed in terms of the luminosity-specific number density of PNe, through the ratio between the total expected number of PNe in a stellar population and the total bolometric luminosity of the latter. Typically, the total number of PNe is estimated by integrating the normalised PNLF of Ciardullo et al. from the brightest observed absolute magnitude to 8 magnitudes fainter, which is the limit where Henize & Westerlund (1963) locate the faintest PNe. Yet, since the faint end of the PNLF has not been well constrained by observations, in some instances is provided only within the completeness limit and such an extrapolation is avoided. Most often in the literature this limit lies within 2.5 magnitudes of and the luminosity-specific number density parameter is therefore indicated as . Adopting our normalisation there should be 76 PNe in total within the central region of M32 mapped by SAURON and between 7 and 8 PNe (7.6) with . Given that our observations cover M32 within essentially its effective radius from I-band images, we are here encompassing nearly half of the total I-band luminosity, i.e. (see Cappellari et al., 2006, for and total luminosity I-band measurements). Adopting the reddening corrected colour of Buzzoni, Arnaboldi, & Corradi (2006) for M32, and using Bruzual & Charlot (2003) models for a Salpeter IMF and Solar metallicity, we then obtain a and thus a B-band luminosity of . Finally, following Buzzoni, Arnaboldi, & Corradi (2006) also for the bolometric correction to the B-band luminosity we arrive at a bolometric luminosity , which means that for the optical regions of M32, within , the luminosity-specific PN number density is , and a factor ten less for . Considering a 33% statistical error associated with our normalisation based on 15 points (for an intrinsic number of 25 PNe within our detection magnitude range), these values are remarkably consistent with thefindings of both Buzzoni, Arnaboldi, & Corradi (2006) and Ciardullo et al. (1989) who give and , respectively.
To conclude, we have detected 15 PNe in the optical regions of M32 that were mapped by our SAURON observations, and thanks to the integral-field nature of our data and by carefully accounting for the incompleteness of our observation we have been able not only to confirm kinematically that these sources belong to M32 but also that their observed luminosity function and their total number are consistent with the generally adopted shape of the PNLF (that of Ciardullo et al., 1989) and the typical values for the PNe number density in early-type galaxies (a few per , Buzzoni, Arnaboldi, & Corradi, 2006). Considering that our 600s-long SAURON observations at the 4m William Herchel Telescope collected nearly as many photons as the 3600s- and 1800s-long narrow-band observations of Ciardullo et al. (1989) at the 0.9m and 2.1m Kitt Peak telescopes, respectively, the fact that we more than doubled the number of known PNe in the central regions of M32 while reaching 5 times fainter [O iii] PNe fluxes (see Tab.1) illustrates well the power of integral-field spectroscopy to study PNe in the optical regions of galaxies.
5 Discussion
It is interesting to comment on our PN results in light of what is known about the central stellar population of M32 and the current explanations for both the shape and normalisation of the PNLF.
Rose et al. (2005) have shown that the luminosity-weighted mean stellar population of M32 at 1 is older by 3 Gyr and more metal-poor by about dex in [Fe/H] than the central value of 4 Gyr and [Fe/H], which are trends that conspire to produce the flat color profiles previously reported in this object (Peletier, 1993; Lauer et al., 1998). Episodes of star formation may enhance for a relative short period of time the bright-end of the PNe luminosity function of a galaxy, since massive main-sequence stars tend to produce also massive and bright central PNe stars (see e.g., the case of M33 in Ciardullo et al., 2004). For instance, Marigo et al. (2004) shows that stars with initial mass between 2.5 and 3.5 evolve to central PN stars of about that can power nebular fluxes corresponding to the typical PNLF cut-off magnitude of -4.47. Since massive stars are short-lived, however, such a PNLF enhancement would be pretty weak already 3 Gyr after star formation ceased, and it would no longer apply to the brightest PNe but to objects with (Marigo et al., 2004). It is thus not surprising, in particular given the small number of PNe at our disposal, that we do not see such a signature in our observed PNLF. If anything, there seems to be a lack of PNe around that intermediate value.
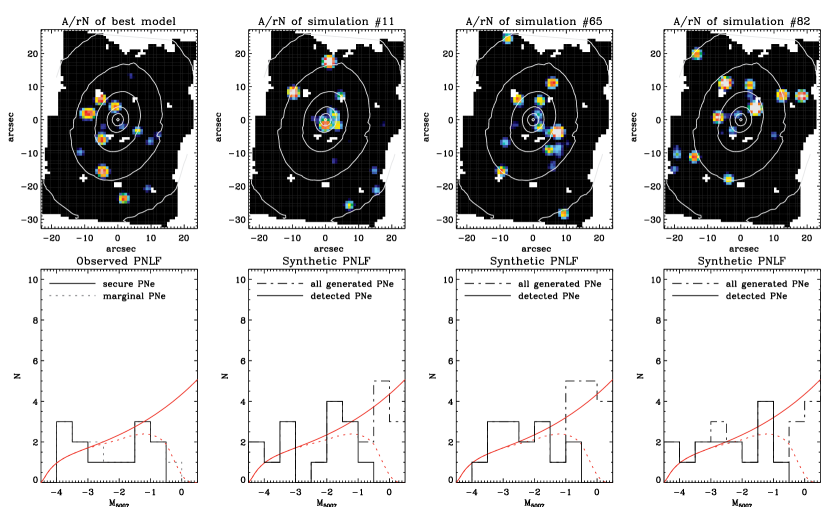
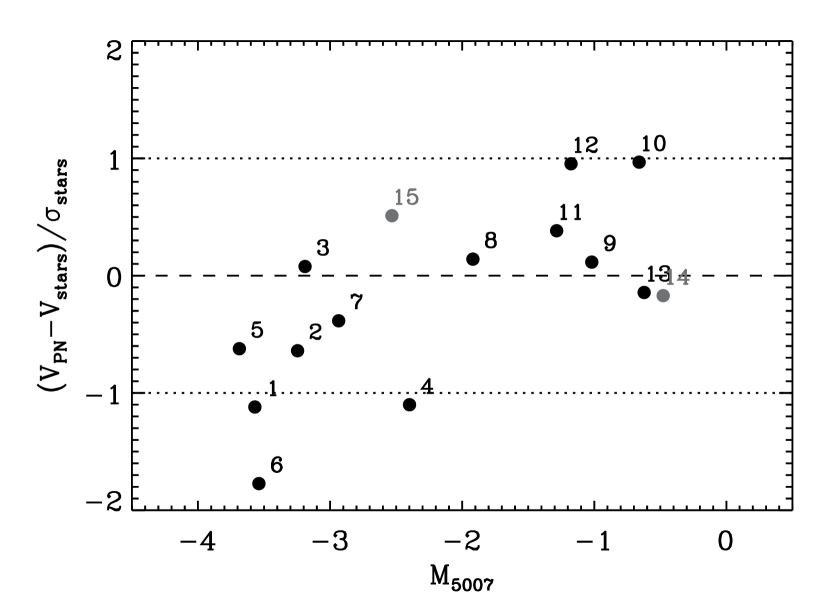
On the other hand, and like in other early-type galaxies with no evidence of recent (less than 1-Gyr-old) star formation, the presence in M32 of bright PNe at a time when the progeny of massive stars have long disappeared is a puzzle that has not yet been fully solved. In fact, the need for a massive central star in the brightest PNe, with mass above , is a result that still holds in the studies of Schönberner et al. (2007) and Méndez et al. (2008) that supersede the initial investigation of Marigo et al. (2004). One possible way to form the required high-mass PN cores, suggested by Ciardullo et al. (2005), involves the binary coalescence during their hydrogen burning phase of stars, a process that has been associated with the formation of blue-stragglers and which could be facilitated in early-type galaxies by the abundance of stars in old stellar systems. If such a second path to the formation of PNe exists, then we may also expect to find a PNLF characterised by a peak at high above an otherwise monothonically increasing PNLF, corresponding to a standard Henize & Westerlund population of PNe powered by only old central PN stars of relatively low mass. In light of this scenario, it would be tempting to see a bimodality in our observed PNLF (Fig. 6), which happens to show two peaks around -3.5 and -1 that correspond to parent stellar masses near 2 and 1, respectively. However, due to small number statistics we cannot read too much in the observed shape of the M32 PNLF, as it is instructive to see through simple simulations such as those presented in Fig. 8, which confirm the formal consistency indicated by a simple KS-test between our data and the completeness-corrected Ciardullo et al. form of the PNLF. Similarly, it would be difficult with our sample size to claim a significant difference in the kinematic behaviour of bright and faint PNe (as in NGC 4697, Sambhus, Gerhard & Mendez, 2006), which could occur for instance if the coalesced central stars of the PNe can form in globular clusters, as could be the case for X-ray binaries (Sarazin, Irwin & Bregman, 2000; White, Sarazin & Kulkarni, 2002) and where indeed blue-stragglers are often found. Alternatively, and consistent with the hypothesis of Marigo et al. (2004), a different kinematics for the brightest PNe may be a sign of recent accretion of a younger and smaller galaxy (Mamon, Dekel, & Stoehr, 2005). Yet, integral-field data allow for a direct comparison with the stellar kinematics as a function of , such as shown for M32 in Fig. 9, that would be interesting to apply to more massive systems hosting a larger number of PNe.
From a theoretical perspective, our best normalisaton of the PNLF in the optical regions of M32, with a value for the specific PN number density in line with that of other early-type galaxies, also poses a problem. Indeed, as long as the time-scale for PN visibility depends mostly on the lifetime of their post-AGB cores (pAGB), then since cores of lower mass spend more time in their high-temperature regime should increase with the stellar population age, whereas in fact quite the opposite is observed (see Buzzoni, Arnaboldi, & Corradi, 2006, for a comprehensive review of this discrepancy). A possible solution to this puzzle is to assume that a considerable fraction of the stellar population of early-type galaxies ends up in the extreme hot end of the helium-burning horizontal-branch (HB), and that when such stars of very small hydrogen-envelope mass subsequently leave the HB they not only skip entirely their AGB phase (thus the name of AGB-manqué) but they also fail to produce a PN. As the AGB-manqué evolution can effectively transfer some fraction of the pAGB energy budget to the integrated UV flux of the galaxy, this scenario could also explain the anticorrelation between the strength of the UV-upturn (as defined by Burnstein et al., 1988) and the luminosity-specific PN number density of early-type galaxies, which respectively increase and decrease with both galaxy mass and metallicity. In fact, it is in M32 that Brown et al. (2000) provided some support to this picture, finding with near-UV Hubble Space Telescope (HST) observations that the relative faint UV flux of M32 originates from hot HB stars and their AGB-manqué progeny rather than from their brighter post-AGB counterparts. Yet, given the relatively long UV-bright lifetime of stars leaving the hot end of the HB (yrs compared to yrs for stars leaving the HB red end) Brown et al. (2000) conclude that only a small fraction of HB stars in M32 live at its blue tip, so that in fact many more bright pAGB should be observed. The recent analysis of the UV colour-magnitude diagram (CMD) of M32 by Brown et al. (2008) further reinforces this result. The findings of Brown et al. (2000, 2008) not only contrast again with the notion that only hot and less massive HB stars should now form in the old stellar population of M32 (unless one considers binary coalescence), but also add an additional problem for the current models of the late evolution of stars.
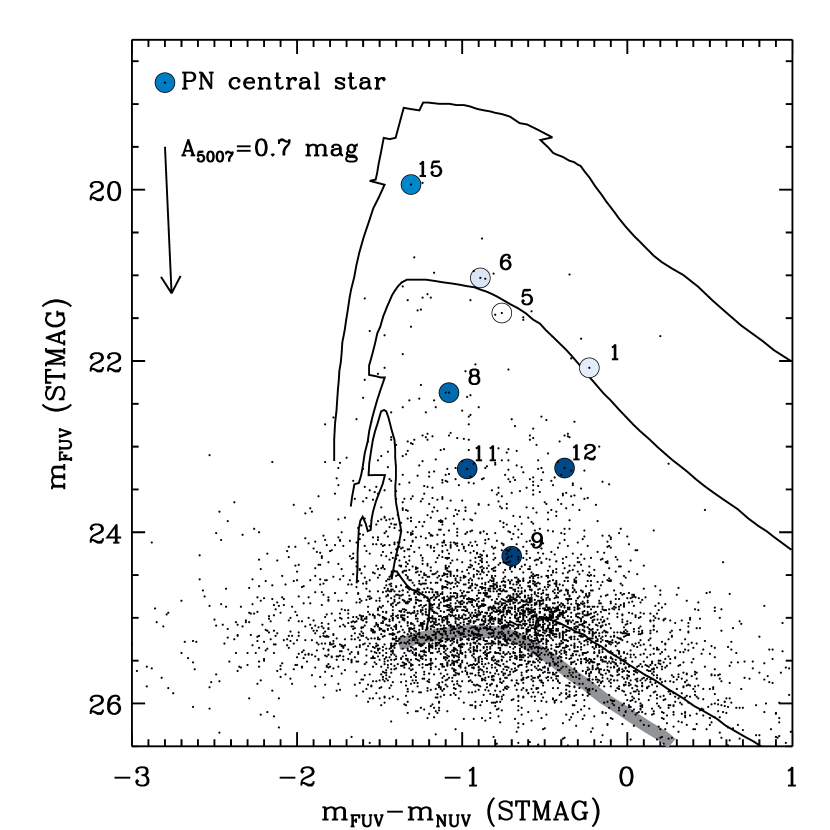
To explain such a dearth of pAGB stars, among other possibilities Brown et al. (2000) suggested that pAGB could be obscured by circumstellar material, in particular as they cross the UV CMD before reaching the region where they peak in temperature at around 60,000 K. This is an interesting possibility considering that PNe are themselves affected by dust extinction and given that, assuming a Cardelli, Clayton, & Mathis (1989) reddening law and R, the typical extinction of 0.7 magnitude at 5007Å for PNe in both star-forming and old galaxies (Herrmann & Ciardullo, 2009; Richer, Stasińka, & McCall, 1999; Jacoby & Ciardullo, 1999) would translate into considerable reddening values of 1.71 and 1.67 in the HST far- and near-UV passbands (FUV and NUV), respectively. To actually check the impact of reddening in the pAGB population of M32, or at least for the fraction that is presently powering a PN, we looked in the catalogue of Brown et al. (2008, kindly provided by T. Brown) for the best candidate central star for our PNe sources and plotted their position in the UV CMD shown in Fig. 10. The field-of-view of the Brown et al. HST observations falls entirely within the area covered by our SAURON data, being and only slightly offset from the center of M32, but unfortunately only 8 of our PNe end up within it. As we are looking to assess as conservatively as possible the impact of reddening on pAGB stars, in Fig. 10 we have located not only the closest but also the brightest of the UV stars near the location of our PNe. Except for PN 9, we could always find a pretty unique UV star within a radius of 097 (half a FWHM) with a far-UV magnitude that would stick out from the distribution of magnitude values of all stars within 25 () of our PN by at least 3 times the scatter in such values. Furthermore, except for PNe 12 and 15, such bright UV stars are always quite close to our PNe, within 025. For PN 15 the relative large distance of the candidate star (063) is less of a concern, given that admittedly our Gaussian model does not fully reproduce the [O iii] flux distribution of this source, but for PN 12 (085) it is possible that the central PN star lies elsewhere near the PN and therefore also in the CMD of Fig. 10. This is also most certainly the case of PN 9, for which the plotted position in Fig. 10 should be considered as upper limit for the far-UV brightness of its central star. It is important to note, however, that the central stars of even relatively faint PNe such as PN 9 and 12 should still be intrinsically fairly bright pAGB or early-post AGB stars (epAGB) and, in particular, that our PNe could not be powered by stars that have already reached the white-dwarf (WD) cooling curve. Indeed, the models of Marigo et al. (2004, see their Fig. 10) shows that at that stage it is possible to obtain only PNe of , which are much fainter than the PNe that we can detect in M32. On the other hand, even considering the uncertain position of PN 9 and possibly PN 12 in Fig. 10, we note that accounting for the typical reddening observed in PNe would bring back up and left the position of the central PN candidate stars of our brightest and faintest PNe near to the location in the UV CMD where pAGB and epAGB reach their peak temperature and spend most of their time, for FUV magnitudes around and , respectively, and a FUV-NUV colour . In fact, we note that PNe as bright as our PN 1, 5 and 6, with , can only be powered by central stars that came from main-sequence stars of masses between 1.6 and 2.5 and which would cross the UV CMD of Fig. 10 along the brightest pAGB tracks (again, see Marigo et al., 2004), which implies that these sources actually must be reddened.
We can double-check this result by using our integral-field data to estimate the position in the theoretical Hertzsprung-Russell (HR) diagram of the PNe for which we can also detect the H emission, and then compare their location to the evolutionary tracks of pAGB stars. Through the models of Dopita, Jacoby, & Vassiliadis (1992) it is indeed possible to estimate the temperature and luminosity of the PNe central star using the value for the [O iii]/H ratio and the H flux, respectively. These models predict a conversion efficiency between the bolometric luminosity of the central star and the H recombination flux from the PN that is rather constant and independent of the gas temperature or metallicity . On the other hand, since Oxygen is the main coolant of PNe, the [O iii] flux depends eavily on and and some knowledge of these quantities further helps constraining with the [O iii]/H ratio. The restricted wavelength range of our SAURON data does not grant us access to the weak [O iii] line that is normally used to measure , but we can use our spectroscopic data to measure the stellar metallicity along the line-of-sight of our PNe and thus gauge the metallicity of their central star, which in turn relates naturally to .
There are 7 PNe in the central regions of M32 for which we could measure the [O iii]/H ratio (Tab. 1), with values ranging from to just above 6 to almost 17. The SAURON aperture spectra around these objects (extracted within a radius , Fig. 5) indicate values for the H absorption line and the [MgFe50]’ index of Kuntschner et al. (2010) between 1.77 – 1.92 Å and 3.01 – 3.08 Å, respectively, which in turn yield an estimate for the stellar metallicity [Z/H] between -0.4 and -0.33 (see Fig. 3 of Kuntschner et al., 2010), depending on whether one adopts the models of Schiavon (2007) or of Thomas, Maraston, & Bender (2003). With this gauge for the central star metallicity we can infer from Fig. 3 of Dopita, Jacoby, & Vassiliadis a star temperature around 55,000 K for the PNe with low [O iii]/H values 6 – 8, and above 85,000 K for the PNe with [O iii]/H. From Fig. 1 of Dopita et al. this range of temperatures would then correspond to an average conversion efficiency around 0.7%, which translate our observed H fluxes into central star luminosities in the 3.0 – 3.2 range. These and values would place the 7 PNe with [O iii]/H measurements from our SAURON observations right below and to the right of the post-AGB evolutionary paths that are normaly used in the HR diagram to trace the luminosity evolution of PNe (see, e.g., Fig. 1 of Mendez et al. 2008 and Fig. 3 of Schonberner et al. 2010), too cold to be on the cooling track of white dwarves (which cannot power PNe) and too faint to be on par with the pAGB stars that normally produce PNe (which range in luminosity between 3.5 – 4.0). Assuming a Solar or nearly Solar metallicity for the central stellar population of M32, as found by Rose et al. (2005), would lead to an even more stringent result since in this case the central star of the highly-excited PNe would be better constrained to lower values by the models of Dopita et al. Thus, also for this second subsample of PNe it would seem necessary to invoke dust reddening in order to to reconcile our data with the model expectations, further supporting the possible role of circumstellar dust in producing the apparent dearth of pAGB stars in M32.
6 Conclusions and Future Prospects
Using SAURON data for the nearby elliptical M32 we have shown how, by means of a careful subtraction of the stellar background, integral-field spectroscopy (IFS) allows to detect the emission of single Planetary Nebulae (PNe) in the optical regions of early-type galaxies down to flux levels otherwise hardly accessible to standard narrow-band photometry. In turn, this makes it possible to trace the PNe luminosity function (PNLF) within a wider completeness limit and in galactic regions where stellar populations gradients can be the most extreme, and therefore where studying how the shape and normalization of the PNLF originate from the bulk of a galactic stellar population could be the most instructive. Moreover, we have shown that the incompleteness of a survey for PNe in the optical region of a galaxy can be very well understood when using IFS data, and that the possibility to extract also the stellar kinematics further allows to check the membership of PNe on a local basis, that is, along the line-of-sight towards a given PN. Such a local comparison between the PNe and stellar kinematics could be useful to identify subpopulations of PNe of different origins. Finally, although with the SAURON data we could only confirm the high-ionisation nature of nearly half of our sources, on a longer wavelength range IFS has a great potential to study the nebular spectrum of extragalactic PNe, as already illustrated in the pioneering work of Roth et al. (2004).
In the specific case of M32, with just two 10-minutes-long SAURON pointings, we have doubled the number of known PNe within the effective radius of this galaxy and detected PNe five times fainter than previously found with narrow-band imaging by Ciardullo et al. (1989), while collecting slightly less the same number of photons. Furthermore, accounting for the incompleteness of our survey across the entire luminosity range spanned by our detected PNe, we have concluded that the central PNe population of M32 is consistent with the generally adopted shape for the PNLF (that of Ciardullo et al.) and its typical normalization observed in early-type galaxies (i.e. with a PNe number density of a few per ). Finally, thanks to exquisite HST data and to the proximity of M32 we were able to combine our PNe measurements with images for the resolved UV-bright stellar population of M32 and conclude that the PNe central stars may be considerably reddened by dust, a result that we could double-check thanks to the IFS nature of our data by estimating the temperature and luminosity for the central star of the PNe with [O iii]/H measurements. This finding would support the suggestion by Brown et al. that circumnstellar dust extinction could explain the apparent dearth of pAGB stars in M32, a problem that may also apply to the halo of the Milky Way (Weston, Napiwotzki, & Catalán, 2010).
Given the intrinsically small number of PNe that is expected in the central regions of such a small galaxy as M32, it is unlikely that with the current instruments (e.g., SAURON or VIMOS) further IFS observations will reveal a sufficiently larger number of objects to add either to what found in this work or to what is already known in the outskirts of M32 from narrow-band imaging or slit-less spectroscopy, even though more IFS data could allow for more emission-line diagnostics.
On the other hand, there is a wealth of SAURON data for many more early-type galaxies that was aquired over the course of the SAURON (de Zeeuw et al., 2002) and ATLAS3D (Cappellari et al., 2011) surveys where the presence of PNe have not yet been systematically investigated. In fact, even though a few PNe were detected in Sarzi et al. (2006), many more PNe have certainly been missed because a large fraction of the data were spatially binned in order to extract a reliable stellar kinematics and due to the common presence of diffuse ionised gas. Indeed spatial binning washes out the signal of the weaker PNe against the stellar background, whereas extended nebular emission makes it difficult to detect PNe unless their distinctive spectrum characterised by high-ionisation and narrow lines is purposely looked for. Paying attention also to the unresolved nature of the PNe emission and working with unbinned data using an educated guess for the stellar kinematics (for instance based on relatively simple but functional dynamical models, see Cappellari, 2008) it may be possible to tap a significant PNe population in the central regions of nearby early-type galaxies. Indeed, although the SAURON and ATLAS3D surveys have targeted much more distant objects than M32, the ability to carefully subtract the stellar background will still enable the detection of fainter PNe in the central regions of these galaxies compared to narrow-band or slit-less spectroscopic surveys. Furthermore, the relatively large number of objects surveyed by these campaigns (260) will allow to combine the measurements from different galaxies, and for instance to better explore the bright end of the PNLF or variations of its shape and normalization as a function of the stellar age and metallicity that will also be provided by the these SAURON data.
To conclude, given the number of findings obtained here with a modest time investment (not even 30 minutes with overheads) on a 4m telescope, it is exciting to consider what could be learned on the PNe population in the optical regions of other galaxies, when the next generation of integral-field spectrographs will be mounted on 8m-class telescopes, such as MUSE on VLT (see, e.g., Bacon et al., 2006). For instance, with a longer wavelength range and a larger light bucket, MUSE will not only find many more and fainter PNe, but it will also allow full diagnostic of their nebular spectrum that could lead to a direct measurement of the gas metallicity and to recognise other nebular sources that could pose as a PNe in narrow-band surveys (see, e.g., Frew & Parker, 2010). In turn the PNe metallicity could be compared with that of the underlying stellar population, which would also be better constrained thanks to an extended spectral range. Furthermore, the spatial resolution that will be provided to MUSE by the use of adaptive optics will allow further comparisons with HST or other space-based measurements for the resolved stellar population of nearby galaxies, such as those presented here for M32, which are bound to shed more light on the link between PNe and their parent stellar population.
Acknowledgements
MS is grateful to Thomas Brown, Paola Marigo, Harald Kuntschner, Ralph Napiwotzki and Brent Miszalski for the useful discussions, and to Thomas Brown for also providing the near- and far-UV HST data of M32. We are also indebted to the referee, Robin Ciardullo, for his many suggestions. MS also acknowledges support from his STFC Advanced Fellowship (ST/F009186/1) and the Institut d’Astrophysique de Paris for its hospitality during part of the preparation of this paper, whereas MC acknowledges support from a STFC Advanced Fellowship (PP/D005574/1) and a Royal Society University Research Fellowship.
References
- Bacon et al. (2001) Bacon R., et al., 2001, MNRAS, 326, 23
- Bacon et al. (2006) Bacon R., et al., 2006, The Messenger, 124, 5
- Brown et al. (2000) Brown T. M., Bowers C. W., Kimble R. A., Sweigart A. V., Ferguson H. C., 2000, ApJ, 532, 308
- Brown et al. (2008) Brown T. M., Smith E., Ferguson H. C., Sweigart A. V., Kimble R. A., Bowers C. W., 2008, ApJ, 682, 319
- Bruzual & Charlot (2003) Bruzual G., Charlot S., 2003, MNRAS, 344, 1000
- Burnstein et al. (1988) Burstein, D., Bertola, F, Buson, L. M., Faber, S. M., Lauer, T. R., 1988, ApJ, 328, 440
- Buzzoni, Arnaboldi, & Corradi (2006) Buzzoni A., Arnaboldi M., Corradi R. L. M., 2006, MNRAS, 368, 877
- Cardelli, Clayton, & Mathis (1989) Cardelli J. A., Clayton G. C., Mathis J. S., 1989, ApJ, 345, 245
- Cappellari & Copin (2003) Cappellari M., Copin Y., 2003, MNRAS, 342, 345
- Cappellari & Emsellem (2004) Cappellari M., Emsellem E., 2004, PASP, 116, 138
- Cappellari et al. (2006) Cappellari M., et al., 2006, MNRAS, 366, 1126
- Cappellari (2008) Cappellari M., 2008, MNRAS, 390, 71
- Cappellari et al. (2011) Cappellari M., et al., 2011, MNRAS, in press (doi:10.1111/j.1365-2966.2010.18174.x)
- Ciardullo et al. (1989) Ciardullo R., Jacoby G. H., Ford H. C., Neill J. D., 1989, ApJ, 339, 53
- Ciardullo et al. (2004) Ciardullo R., Durrell P. R., Laychak M. B., Herrmann K. A., Moody K., Jacoby G. H., Feldmeier J. J., 2004, ApJ, 614, 167
- Ciardullo et al. (2005) Ciardullo R., Sigurdsson S., Feldmeier J. J., Jacoby G. H., 2005, ApJ, 629, 499
- Ciardullo (2006) Ciardullo R., 2006, IAUS, 234, 325
- de Zeeuw et al. (2002) de Zeeuw P. T., et al., 2002, MNRAS, 329, 513
- Dopita, Jacoby, & Vassiliadis (1992) Dopita M. A., Jacoby G. H., Vassiliadis E., 1992, ApJ, 389, 27
- Dopita et al. (1997) Dopita M. A., et al., 1997, ApJ, 474, 188
- Douglas et al. (2007) Douglas N. G., et al., 2007, ApJ, 664, 257
- Emsellem et al. (2004) Emsellem, E., et al. 2004, MNRAS, 352, 721
- Falcón-Barroso et al. (2006) Falcón-Barroso, J., et al. 2006, MNRAS, 369, 529
- Frew & Parker (2010) Frew D. J., Parker Q. A., 2010, PASA, 27, 129
- Jacoby, Ciardullo, & Ford (1990) Jacoby G. H., Ciardullo R., Ford H. C., 1990, ApJ, 356, 332
- Jacoby et al. (1992) Jacoby G. H., et al., 1992, PASP, 104, 599
- Jacoby & Ciardullo (1999) Jacoby G. H., Ciardullo R., 1999, ApJ, 515, 169
- Henize & Westerlund (1963) Henize K. G., Westerlund B. E., 1963, ApJ, 137, 747
- Herrmann & Ciardullo (2009) Herrmann K. A., Ciardullo R., 2009, ApJ, 703, 894
- Lauer et al. (1998) Lauer T. R., Faber S. M., Ajhar E. A., Grillmair C. J., Scowen P. A., 1998, AJ, 116, 2263
- Kuntschner et al. (2010) Kuntschner H., et al., 2010, MNRAS, 408, 97
- Mamon, Dekel, & Stoehr (2005) Mamon G. A., Dekel A., Stoehr F., 2005, AIPC, 804, 345
- Marigo et al. (2004) Marigo P., Girardi L., Weiss A., Groenewegen M. A. T., Chiosi C., 2004, A&A, 423, 995
- Méndez et al. (2008) Méndez R. H., Teodorescu A. M., Schönberner D., Jacob R., Steffen M., 2008, ApJ, 681, 325
- Merrett et al. (2006) Merrett H. R., et al., 2006, MNRAS, 369, 120
- Peletier (1993) Peletier R. F., 1993, A&A, 271, 51
- Richer, Stasińka, & McCall (1999) Richer M. G., Stasińka G., McCall M. L. M., 1999, A&AS, 135, 205
- Romanowsky et al. (2003) Romanowsky A. J., Douglas N. G., Arnaboldi M., Kuijken K., Merrifield M. R., Napolitano N. R., Capaccioli M., Freeman K. C., 2003, Sci, 301, 1696
- Rose et al. (2005) Rose J. A., Arimoto N., Caldwell N., Schiavon R. P., Vazdekis A., Yamada Y., 2005, AJ, 129, 712
- Roth et al. (2004) Roth M. M., Becker T., Kelz A., Schmoll J., 2004, ApJ, 603, 531
- Sambhus, Gerhard & Mendez (2006) Sambhus N., Gerhard, O., & Mendez, R. H., 2006, AJ, 131, 837
- Sánchez-Blázquez et al. (2006) Sánchez-Blázquez P., et al., 2006, MNRAS, 371, 703
- Sarazin, Irwin & Bregman (2000) Sarazin C. L., Irwin, J. A., & Bregman, J. N., 2000, ApJ, 544, L101
- Sarzi et al. (2006) Sarzi M., et al., 2006, MNRAS, 366, 1151
- Sarzi et al. (2010) Sarzi M., et al., 2010, MNRAS, 402, 2187
- Schiavon (2007) Schiavon R. P., 2007, ApJS, 171, 146
- Schönberner et al. (2007) Schönberner D., Jacob R., Steffen M., Sandin C., 2007, A&A, 473, 467
- Schönberner et al. (2010) Schönberner D., Jacob R., Sandin C., Steffen M., 2010, A&A, 523, A86
- Thomas, Maraston, & Bender (2003) Thomas D., Maraston C., Bender R., 2003, MNRAS, 339, 897
- Tonry et al. (2001) Tonry J. L., Dressler A., Blakeslee J. P., Ajhar E. A., Fletcher A. B., Luppino G. A., Metzger M. R., Moore C. B., 2001, ApJ, 546, 681
- Weston, Napiwotzki, & Catalán (2010) Weston S., Napiwotzki R., Catalán S., 2010, AIPC, 1273, 197
- White, Sarazin & Kulkarni (2002) White, R. E., Sarazin C. L., & Kulkarni, S. R., 2002, ApJ, 571, L23