Obscured GOODS AGN and Their Host Galaxies at : The Slow Black Hole Growth Phase
Abstract
We compute black hole masses and bolometric luminosities for 87 obscured AGN in the redshift range , selected from the GOODS deep multi-wavelength survey fields via their X-ray emission. We fit the optical images and obtain morphological parameters for the host galaxy, separating the galaxy from its central point source, thereby obtaining a four-band optical SED for each active nucleus. We calculate bolometric luminosities for these AGN by reddening a normalized mean SED of GOODS broad-line AGN to match the observed central point-source SED of each obscured AGN. This estimate of has a smaller spread than simple bolometric corrections to the X-ray luminosity or direct integration of the observed multi-wavelength SED, suggesting it is a better measure. We estimate central black hole masses from the bulge luminosities. The black hole masses span a wide range, to ; the median black hole mass is . The majority of these AGN have , and we detect no significant evolution of the mean Eddington ratio to . This implies that the bulk of black hole growth in these obscured AGN must have occurred at and that we are observing these AGN in a slow- or no-growth state.
Subject headings:
galaxies: active — galaxies: nuclei — galaxies: fundamental parameters — galaxies: bulges — galaxies: Seyfert — methods: data analysis1. Introduction
Accurately estimating the mass and growth of supermassive black holes (SMBHs) in the centers of massive galaxies is critical to the field of galaxy formation and evolution. Calculations of black hole masses from direct observables have been limited to only a few methods: stellar kinematics from within the black hole sphere of influence (Genzel et al., 1997; Ghez et al., 2005); H2O maser kinematics (Miyoshi et al., 1995; Herrnstein et al., 1999; Greenhill et al., 2003); kinematics of central gaseous disks (Ford et al., 1994; Ferrarese & Ford, 1999); and reverberation mapping (Peterson, 1993; Peterson & Wandel, 2000). These methods, while powerful and tested, are mostly restricted to bright galaxies and luminous active galactic nuclei (AGN) in the local universe.
Far more common are obscured AGN, which by definition have a reddened (fainter) central point source and often resemble a normal galaxy at optical and near-infrared wavelengths. These comprise a large fraction of all AGN and contribute much of the X-ray background (Ueda et al., 2003; Treister & Urry, 2005, 2006; Treister et al., 2004, 2006, 2008, 2009). The high luminosity ratio between host galaxy and obscured point source makes indirect black hole mass () estimates, such as the (where is the galaxy or bulge luminosity) relation (Marconi & Hunt, 2003), much more promising than in quasar hosts, as well as one of the only methods available given that nuclear emission, including broad lines, is usually obscured in these sources.
Combining black hole masses with bolometric luminosities gives an important intrinsic property of AGN, the Eddington ratio, , as well as the associated dimensionless accretion rate, . These quantities indicate how fast a black hole is growing: only accretion approaching (or exceeding) the Eddington limit leads to an appreciable increase in black hole mass. From well-studied spectral energy distributions (SEDs) of unobscured Type 1 quasars (Sanders et al., 1988; Elvis et al., 1994; Richards et al., 2006), one can derive bolometric corrections for AGN with less complete SEDs (Elvis et al., 1994; Fabian & Iwasawa, 1999; Elvis et al., 2002; Marconi et al., 2004; Hopkins et al., 2007). However, these bright quasars are rare among the larger AGN population (AGN found in deep Chandra exposures are generally times less luminous) and bolometric corrections for the more common, lower-luminosity AGN are much less certain.
Detailed study of large samples of AGN and host galaxies has recently become possible via large multi-wavelength surveys (e.g., GOODS, COSMOS, ECDFS) that include X-ray and infrared data as well as high-resolution, deep optical imaging with the Hubble Space Telescope (HST). The unparalleled resolution of the Advanced Camera for Surveys (ACS) resolves typical AGN host galaxies and point sources out to (Sánchez et al., 2004; Ballo et al., 2007; Pierce et al., 2007; Alonso-Herrero et al., 2008; Gabor et al., 2009, but also see, e.g., Grogin et al. 2003 and Schawinski et al. 2011 for other HST instruments), and simulations have confirmed the reliability of host and point-source separation for obscured AGN out to these redshifts (Simmons & Urry, 2008). Here, we utilize the Great Observatories Origins Deep Survey (GOODS, Giavalisco et al., 2004) X-ray through 24 µm data to characterize separately the active nuclei and the host galaxies of a large sample of moderate luminosity, obscured AGN.
The separation of the host galaxy from the AGN point source allows us to determine simultaneously the SED of the AGN alone and the (from the host galaxy, using the - relation, where is the rest-frame -band bulge luminosity). We can then extrapolate the AGN luminosity to the far-infrared based on the level of reddening in the optical point source, and thus estimate the bolometric luminosity. Coupled with black hole mass, this allows us to determine Eddington luminosities and ratios for obscured AGN over the redshift range of . We discuss the data and sample selection in Section 2. Section 3 describes the black hole mass estimation, including treatment of time variability of the black hole-bulge luminosity relation, and Section 4 details how we calculate bolometric luminosities and discusses the reliability of our methods. In Section 5 we discuss the derived Eddington luminosities and ratios for our sample.
Throughout this paper, we adopt km/s/Mpc, , consistent with the WMAP cosmology (Spergel et al., 2003).
2. Data
2.1. Sample Selection
In order to reliably extract AGN light from the combined light of an AGN plus its host galaxy, we require deep observations using an instrument with a point-spread function (PSF) that is small compared to the size of the galaxy. The excellent depth and resolution of the of the GOODS HST observations provide an excellent opportunity for studying moderate-luminosity AGN () out to high redshifts (. The GOODS data include the space-based Chandra Deep Fields in the X-ray (0.5-8 keV; Giacconi et al., 2002; Alexander et al., 2003), four HST/ACS filters in the optical (F435W, ; F606W, ; F775W, ; F850LP, ; Giavalisco et al., 2004), all four Spitzer/IRAC bands in the infrared (3.6, 4.5, 5.8, 8.4 m), Spitzer/MIPS 24 µm (Treister et al., 2006, Dickinson et al., in preparation, Chary et al., in preparation) and the ground-based FLAMINGOS and bands and SOFI/ISAAC bands for GOODS-North and South, respectively.
We define our AGN sample by the following criteria:
-
1.
Chandra X-ray point source matched to an optically-detected source using a maximum-likelihood method to more than 99% confidence (Bauer et al., 2004).
- 2.
-
3.
Total absorption-corrected hard X-ray luminosity, (2-8 keV) to minimize contamination from pure starburst galaxies with no AGN (Persic et al., 2004).
This results in an initial sample of 121 AGN, with 68 from GOODS-North and 53 from GOODS-South. We apply further criteria to select a sub-sample of sources with high enough HST data quality for two-dimensional host galaxy fitting.

To separate a source’s central (optical) AGN light from its host galaxy light using two-dimensional parametric fitting techniques requires high-resolution data and relatively high signal-to-noise for each source ( per pixel). To ensure the highest quality fits, we include only sources with host mag (AB), and with a stellarity parameter (estimated by the SExtractor parameter, CLASS_STAR; Bertin & Arnouts, 1996) less than 0.85, where is a pure point source. Following this cut, we retain 90 AGN (51 from GOODS-N, 39 from GOODS-S), of which 9 are broad-line objects. Figure 1 shows the distributions of , , and for X-ray sources with in the GOODS fields. We further exclude three sources for which we were unable to isolate the bulge flux. Two have extremely irregular and disrupted optical morphology, making morphological descriptions in terms of bulges and disks meaningless, and one has a marginal ; all three are among the lowest optical luminosity, with a mean , nearly an order of magnitude below the next lowest AGN host (; see Figure 1). The remaining 87 AGN+hosts constitute our final sample.
2.2. Point Source-Host Galaxy Decomposition
We perform morphological decomposition of the GOODS AGN+host galaxies using the 2-D fitting routine GALFIT (Peng et al., 2002). This routine allows for simultaneous fitting of one or more host galaxy components along with a central point source. We used the GOODS ACS images that were processed using the STScI Multidrizzle algorithm (Koekemoer et al., 2002), improving the native resolution to 0.03 arcsec/pixel.
We fit each source independently in each ACS band (, , , and ) with a three-component fit: a deVaucouleur bulge + an exponential disk + a nuclear point source, the latter of which is modeled by a noiseless, analytical PSF based on analysis of dozens of real stars in the GOODS fields, created independently for each band using the IRAF package daophot. This PSF creation method minimizes the effects of potential eccentricities of any one star on the field (such as color or excess noise), while still accounting for any possible deviations within our drizzled data from a purely analytical PSF created from a package such as tiny tim (Krist, 1993).
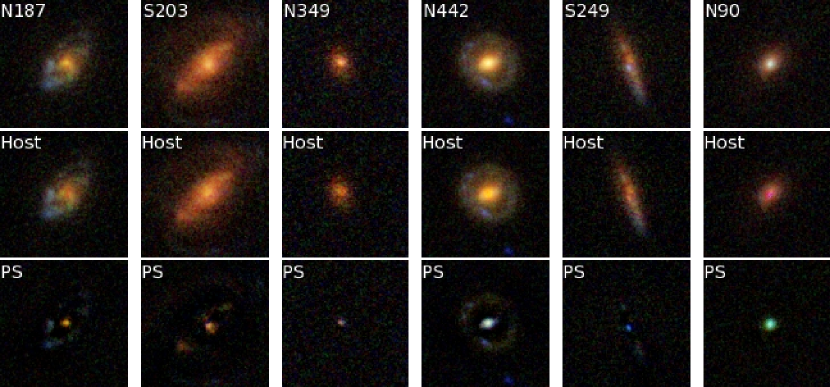
Each galaxy was initially fit using an automated program (described in further detail in Simmons & Urry, 2008, hereafter S08) that uses SExtractor catalog values as initial parameter guesses. The primary goal of the initial fit is to fix the central positions of the host and point source and to calculate initial estimates of the fit parameters. Each galaxy was then fit with GALFIT by hand to achieve the best possible fit, assessed using the goodness-of-fit parameter and examination of fit residuals. We then calculate the rest-frame -band bulge-to-total ratios and point-source and host galaxy luminosities, using the InterRest interpolation code from Taylor et al. (2009); see Table 1 for total, point source, and host galaxy magnitudes and associated errors. Separated hosts and point sources for six objects in our sample are shown in Figure 2.
Reliable calculations of AGN black hole mass and bolometric luminosity require accurate measurements of each source’s host galaxy-to-point source luminosity and bulge-to-total ratios, which are determined by our morphological fitting. S08 simulated over 50,000 AGN host galaxies in order to assess the limits of the morphological fitting. The simulations show that the determination of is generally reliable to the flux and redshift limits of our sample. Brighter point sources introduce greater uncertainty into the recovered parameters, especially the host galaxy magnitude and bulge-to-disk ratio (S08). We add these uncertainties in quadrature with the fit errors, which in turn affects the uncertainties in our black hole masses and Eddington ratios.
For samples like ours, automated fitting of AGN and hosts recovers at least 90% of central point sources (S08); our recovery fraction should be higher due to the fact that we fit each source individually. S08 also find a spurious point-source detection rate of approximately 12% in a single-band sample with equal numbers of bulge- and disk-dominated sources. However, this is an upper limit for our sample, since the chance of spurious detections or unrecovered point sources in multiple bands for a single source is extremely small. Statistically, the probability of a missed point source in 2 (3, 4) bands is 1% (0.1%, 0.01%) for one source. The probability of a spurious detection in 2 (3, 4) bands for a source with equal contributions from a bulge and disk is 1.4% (0.2%, 0.02%), though this calculation varies with the morphology of each source. Based on the number of point sources detected in our sample and each source’s individual morphology (following S08), we expect that we miss point source detections within the sample and have spurious detections for sources.
Rest-frame B-band properties of each host galaxy and central point source are given in Table 1.
3. Black Hole Mass Estimation

Direct kinematic measurements of black hole mass are not possible for the majority of our sample because most of the AGN are obscured. Instead we use black hole-bulge relations to estimate the black hole masses. We use the point-source-subtracted bulge luminosity to calculate from rest-frame -band absolute magnitudes of the host galaxy bulge using the relation from Eq. 19 of Ferrarese & Ford (2005) as converted from Marconi & Hunt (2003):
| (1) |
where is the rest-frame B-band absolute magnitude of the galaxy bulge. Rest-frame bulge-only absolute magnitudes range from , with an average error of (determined from GALFIT uncertainties added in quadrature to systematic uncertainties from S08). Within our sample, we find bulge fractions ranging from % to 100%, with a median bulge-to-total ratio of . For the four cases where a bulge is undetected in the rest-frame , we follow S08 in assuming a maximum of 5% bulge contribution, and consider those black hole masses upper limits.
The mass-luminosity relation of Eq. 1 is based on measurements in the local universe. Treu et al. (2004) have shown an evolution in the relation out to redshift : the rest-frame -band mass-to-light ratio of the bulge decreases with redshift due to the fact that a higher-redshift bulge typically has a younger stellar population than a bulge at . Subsequent work on different samples and using different methods (Borys et al., 2005; Alexander et al., 2008; Bluck et al., 2011) finds that black hole masses seem to lag behind bulges at even higher redshift, implying that black hole masses calculated from bulge properties are overestimated by approximately a factor of 3 at .
However, several other studies (Woo et al., 2005; Peng et al., 2006; Woo et al., 2008; Jahnke et al., 2009; Decarli et al., 2010; Merloni et al., 2010) report a decrease in the intrinsic bulge stellar mass-black hole mass relation with redshift, in the sense that bulge mass appears to evolve faster than black hole mass within our redshift range, leading to an evolution in the bulge-black hole mass relation in the opposite direction. Some of the conflicting results may be explained by differences resulting from comparing black hole masses to different quantities (stellar mass versus bulge luminosity, for example), but the picture is not yet clear. Black hole masses calculated at may change by a factor of approximately 3 in either direction and still be consistent with previous studies.
Going forward, we quote the unevolved masses, calculated via a Monte Carlo method in order to account for uncertainties in host luminosity and bulge-to-total ratio (both determined from S08) as well as the intrinsic scatter noted in Equation 1 and an additional uncertainty of dex to encompass the uncertainty in the evolution of Eq. 1 to the redshifts relevant to our sample. We generate data points for each of our 87 sources, with uncertainties folded into each step to calculate black hole masses; the reported values and errors represent the peak and values of the Monte Carlo distribution for each object. This method typically results in SMBH mass uncertainties of approximately dex in log-. Using the same Monte Carlo method, we propagate these errors through to our calculation of Eddington ratios (discussed in Section 5).
4. Bolometric Luminosity Calculations
In order to study the properties of AGN, we need to know the total power they emit. Bolometric luminosities of AGN are thus important quantities, but they are also difficult to calculate directly for many populations of AGN. Owing to our selection criteria, the SEDs of our 87 sources are typically dominated by galaxy light at optical and near-IR wavelengths, so we do not expect that naively summing the luminosities of our sources at all wavelengths will provide a reliable estimate of total AGN power.
We therefore consider two alternative approaches: (1) an average bolometric correction to the X-ray luminosity based on unobscured broad-line AGN (§ 4.1), and (2) individual corrections based on fitted reddening of our main AGN sample (§ 4.2).
4.1. X-ray Bolometric Correction
Bolometric luminosities are commonly estimated using an X-ray bolometric correction, , where . Values of have been derived from well-defined SEDs of optically selected, powerful quasars and range from (Elvis et al., 1994) to (Fabian & Iwasawa, 1999) or (Elvis et al., 2002). The factor is luminosity- and wavelength-dependent (Marconi et al., 2004; La Franca et al., 2005; Treister & Urry, 2005).
The bulk of our sample lies more than an order of magnitude below the average of mean quasar SEDs such as those computed from the Sloan Digital Sky Survey (Richards et al., 2006). This suggests the values from the literature may not accurately represent our sample. Since the GOODS data cover nearly 5 decades of wavelength, we calculate our own value and compare to previously derived .
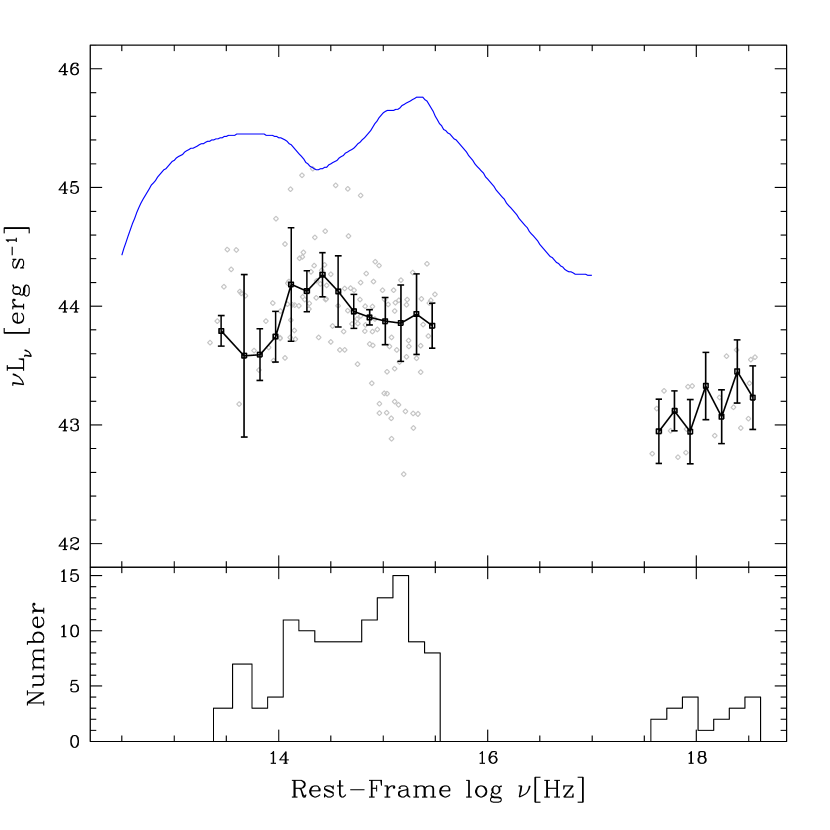
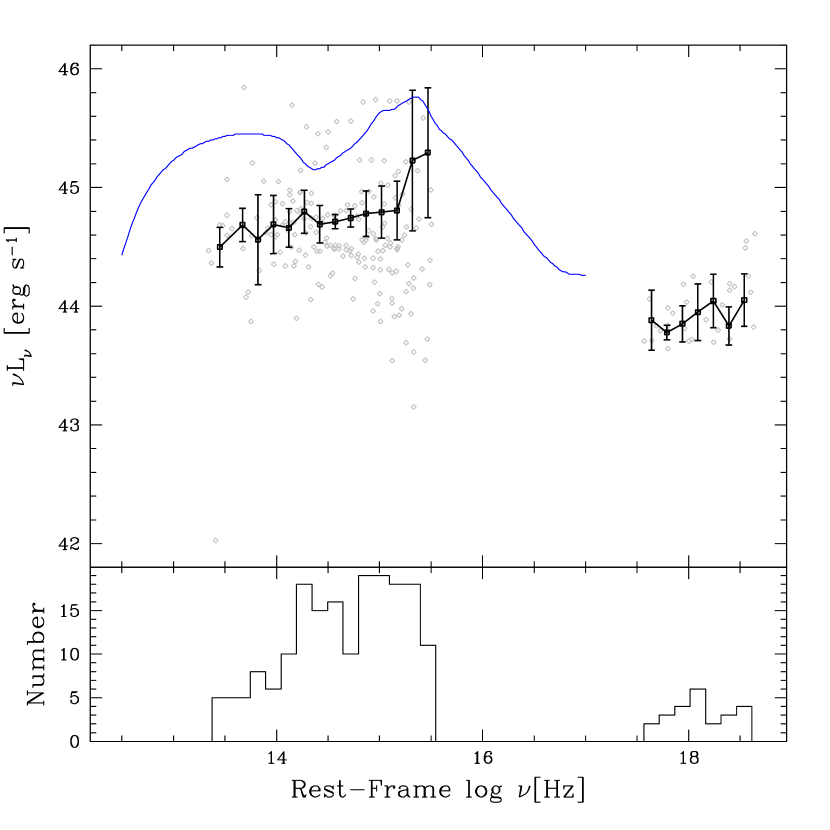
First, we develop an SED for unobscured, broad-line AGN by averaging the 58 GOODS sources with clear broad lines and hence low reddening (Barger et al., 2003; Szokoly et al., 2004; Cowie et al., 2004), as well as (Bauer et al., 2004). We also impose the criterion to minimize host galaxy contamination in the optical and near-IR. (Three of these sources are in our sample of 87 AGN.) Even under these conditions, 12 of the selected broad-line AGN show some signs of a K-giant stellar population in their SEDs (Barger et al., 2003; Mainieri et al., 2005), particularly at lower . We then split the unobscured sample into two groups, less than and greater than , to investigate the dependency of on . The median, absorption-corrected, 2-8 keV X-ray luminosity for each group is and , respectively, consisting of 32 and 26 AGN, respectively.
Figure 4 shows the rest-frame, error-weighted geometric mean of our intermediate-luminosity AGN in frequency bins 0.15 dex in width. Given the wide redshift range, not all wavelength bins include the same number of photometric bands for each unique object. In addition to weighting by photometric error in each bin, we also weight by the fraction of AGN in each band with respect to the total sample number (shown in the bottom panel of Figure 4).
For comparison, we also plot in Figure 4 the mean SDSS quasar SED from Richards et al. (2006). The “big blue bump” in both GOODS AGN samples (at ) is considerably weaker than in SDSS quasars, relative to the mean luminosity at 1 µm. This suggests that using an SDSS-derived estimate would overestimate the bolometric luminosity in our AGN sample.
The integrated luminosities of the averaged broad-line AGN source SEDs are calculated by summing the 2-30 keV rest-frame , the 1250 Å-8 µm broad-band luminosities and the integrated UV-to-soft X-ray assuming . This results in integrated luminosities and bolometric corrections of and for the lower-luminosity broad-line AGN, and and for the higher-luminosity broad-line AGN. The value in the lower-luminosity broad-line AGN may be slightly high due to host contamination of the optical and near-infrared SED (we estimate this contamination increases in the lower luminosity sample by %).
4.2. Point-Source Reddening / Dust Luminosity Method
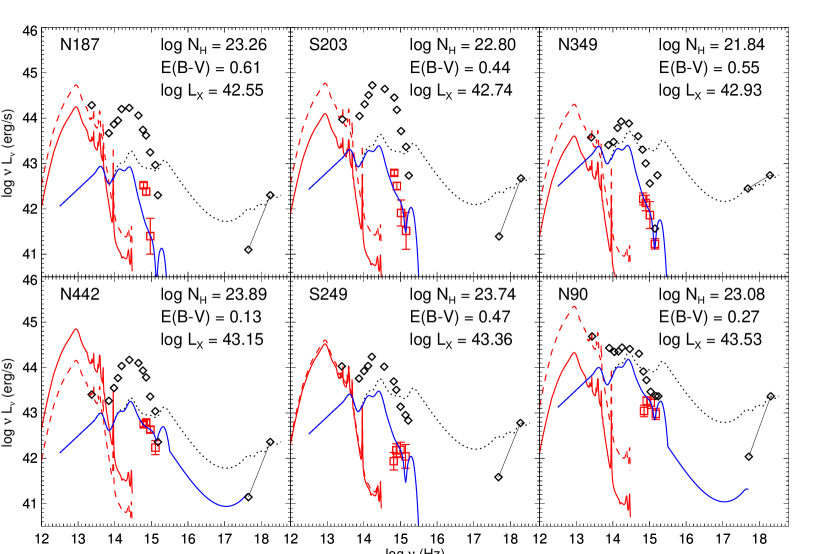
We can derive the observed point-source SED in the four ACS bands using the results from morphological fitting. In some sources, typically in the ACS (and possibly ) bands of higher-redshift sources, no point source is detected at all; in these cases, we calculate an upper limit for these bands based on the residual background flux. Figure 5 shows six examples of total broad-band SEDs (diamonds) from 24 µm to U-band, plus X-ray, and the point-source optical SEDs as red squares.
We redden an unobscured AGN template to fit the extracted point source luminosities. We use the two averaged AGN SEDs calculated in the previous section, choosing which template to use for each source based on the source’s X-ray luminosity. First, we normalize the template to the absorption-corrected, hard X-ray luminosity of each source. After this normalization, the mean SED exceeds the observed rest-frame broad-band MIR luminosity by more than the uncertainty of the mean SED for only eight of our 87 sources. This indicates that the choice of template SEDs is appropriate for our sample.111If we were to instead use the Richards et al. (2006) SDSS quasar template, the template would exceed the MIR flux in 68% of sources. In the rare case where the SED exceeds the observed MIR luminosity after normalizing to the hard X-ray luminosity, the mean SED is re-normalized to be consistent with the observed MIR luminosity.
We then fit the normalized spectrum to the optical point-source SED, applying the reddening curve of Cardelli et al. (1989) for a Milky Way ISM () over the wavelength range of and using a -minimization algorithm to calculate the reddening value of the nuclear emission. For sources with point source detections in three or four filters (), the reddening average is . This increases to for AGN with solid detections in only two bands. We note that point source SEDs with significantly different colors from the host galaxy SED are frequent enough in our sample that attempting to determine the reddening value from the combined AGN+host SED would be considerably less reliable. This is consistent with previous simulations and observations (e.g., Pierce et al., 2010a, b).
The independent determination of from reddening and from X-ray absorption allows us to estimate the dust-to-gas ratio along the line of sight (Section 4.4). We can then estimate the total re-radiated IR luminosity of the material that is absorbing optical and UV photons from the point source, using the dust emissivity models of Draine & Li (2007) and the dust-to-gas ratios to convert the emissivity profiles to luminosity, .
This calculation requires two assumptions: (1) the ambient radiation field strength, , near the dust, and (2) the physical line-of-sight path length, , through the AGN and host galaxy. We select the Draine & Li (2007) model that has a range of , where erg cm-2 s-1 (Mathis et al., 1983), to roughly reproduce the combination of AGN radiation field strength and the ambient galaxy radiation field. We estimate the path length to be , where is half of the physical galaxy semi-major axis (determined from the angular size and distance scale), and is the estimated inclination. For galaxies with no detected disk to indicate orientation, we assume .
We find that the calculated does not exceed the observed luminosity in the majority (83%) of cases. Of the 15 sources with excess calculated compared to the observed SED, only one is inconsistent with AGN variability observed for a similar sample on year-long timescales (Sarajedini et al., 2006). That source, S160, has an uncharacteristically low luminosity compared to the rest of our sample. We conclude that the selected parameters of and do not greatly over- or underestimate the reprocessed AGN dust emission of our sample. However, the assumption that reddening of the optical point source is due entirely to dust from an AGN torus means that the calculated should be considered an upper limit.
4.3. Comparison of Bolometric Luminosity Methods
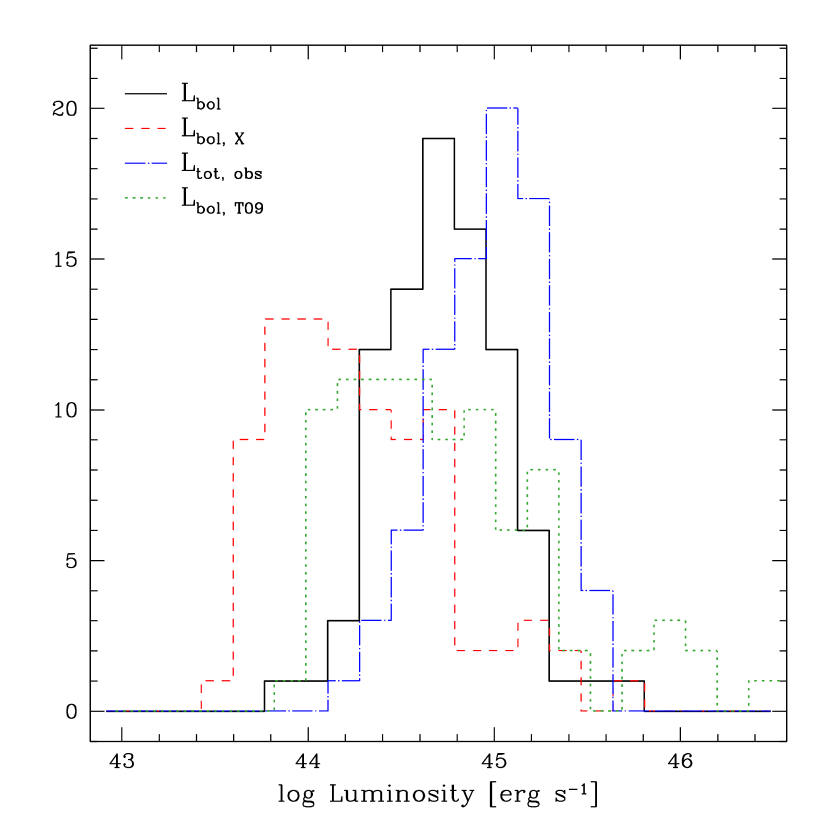

Figure 6 shows a comparison between the bolometric luminosities calculated four ways: (1) by integrating the complete AGN SED we constructed for each object as described in Section 4.2, ; (2) by estimating an X-ray correction using the mean broad-line AGN SEDs calculated in Section 4.1, ; (3) by summing the source luminosity in all observed bands, ; and (4) by using model-derived, luminosity-dependent bolometric corrections to the X-ray luminosity (; Treister et al., 2009).
For the relatively small number of objects (6) in our sample with , using our point-source fitting method to calculate has close to the same result as simply adding up the total luminosity in the source SED. However, the rest of our sources are dominated by the host galaxy in the optical and infrared wavelengths, leading to a significant overestimation of AGN-only luminosity with a simple summation method. For our entire sample, the mean value of is too large by approximately 80% compared to the mean computed using our point-source fitting method.
In contrast, the simple bolometric correction computed in Section 4.1 is too low by 66% on average. This is unsurprising, because our correction is derived from an observed SED that lacks FIR data at longer wavelengths than (observed), which can contribute significantly to the observed total luminosity. This is exacerbated when applying a correction to objects like those in our main sample, whose X-ray luminosity has been subject to circumnuclear absorption. Using the Draine (2003) dust models to estimate this FIR component in the broad-line AGN increases the value of the correction from Section 4.1 to a value consistent with Elvis et al. (2002), which increases the corrected luminosities, , to a mean value more consistent with the mean , but with a larger scatter ( for compared to 0.33 for ).
Both and are calculated using observed properties. We assess the accuracy of our calculation, which combines observations with model-dependent parameters, by comparing to an independent theoretical model. Specifically, we use the luminosity-dependent bolometric corrections calculated in Treister et al. (2009) for model AGN SEDs with a range of X-ray luminosities, column densities, and orientations (Treister et al., 2006). Using the absorption-corrected X-ray luminosity of each object in our main sample to predict a bolometric correction yields a bolometric luminosity for each object, .
Encouragingly, the mean values of and are in good agreement ( and ), with the distribution of having a peak and width () of . This indicates that the prediction of the Treister et al. (2009) model generally agrees well with calculations of for individual objects. Such strong agreement for two completely independent ways of calculating bolometric luminosities implies that the observed reddening of the central point source is dominated by absorption processes occurring within the circumnuclear region.
Individual-source bolometric luminosities for each of the four methods are presented in Table 2. Note that, compared to (method 1), (method 2) underestimates the bolometric luminosity and (method 3) overestimates it. Both and (method 4) distributions have more scatter, which suggests the point-source fitting method (method 1) may be superior. We use this value, , in the subsequent analysis.
Figure 7 shows the distribution of with redshift, as well as the ratio of to the observed . We detect no trend in with redshift, but the objects with lower appear to have a higher scatter in compared to objects with higher . Interestingly, values of calculated using point-source luminosities in only 1 or 2 optical bands, while individually more uncertain than values calculated with 3 or 4 bands of optical point-source data, are not outliers in the overall distribution of . This suggests that a sample of AGN with calculated as in section 4.2, but with only one optical band used to determine , may be reliable as a sample even if the individual values have high uncertainty.
4.4. Dust-to-Gas Ratios
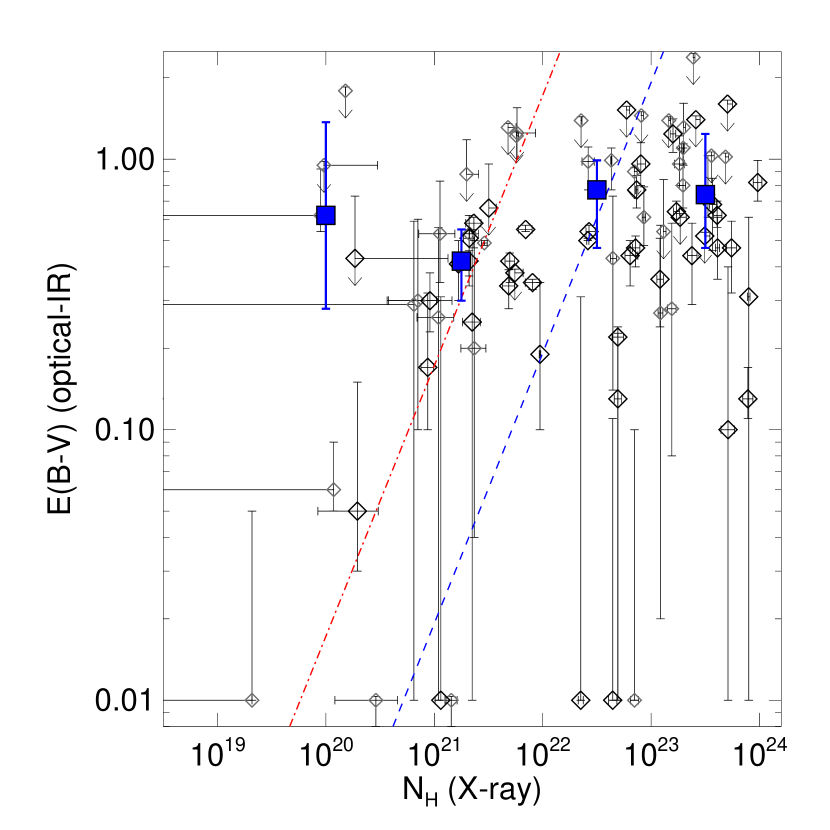
Our point-source fitting method produces estimates of from optical point-source dust reddening. We also have gas column density () measurements from X-ray spectral slope fitting. These two quantities allow for an independent measurement of the intrinsic dust-to-gas ratio in AGN. Figure 8 shows the measures of dust vs. gas in the form of vs. . Binning the data in Figure 8 over four ranges shows no strong trend; however, a Kolmogorov-Smirov (K-S) test indicates only a 0.4% chance that the subsample of values for objects with is drawn from the same parent sample as the subsample of values for objects with . This indicates that dust and gas obscuration may be weakly correlated, so that sources with higher tend toward higher values, but with large scatter. The dust-to-gas ratios span a relatively wide range, including dust-to-gas ratios similar to the Galactic value, (see Draine, 2003; Shull & van Steenberg, 1985), and those closer to that in the SMC, (Martin et al., 1989).
The SMC-like dust ratios are consistent with observations of local Seyferts, based on their star formation histories and intrinsic metallicities (Maiolino et al., 2001; Willott et al., 2004; Hopkins et al., 2004). However, as discussed in Willott et al. (2004), the similarity of these dust-to-gas ratios is likely a coincidence, due to the drastically different physical conditions between AGN and the SMC. Maiolino et al. (2001, 1997) discuss at least three causes for the much higher gas-to-dust ratio relative to the Milky Way: (1) a difference in dust grain composition and size such that UV absorption is less effective; (2) the ratio of dust to gas is simply lower than in our galaxy; and (3) an effect of the majority of X-ray absorption occurring very close to the ionizing radiation and within the dust sublimation radius (defined at roughly 1500 K, and on the order of pc). The work of Elitzur & Shlosman (2006) supports this last explanation.
The majority (90%) of our sample lack detected broad emission lines, which within the AGN unification paradigm is commonly interpreted as the result of an optically thick line-of-sight to the broad-line region (also within the dust sublimation radius; Hönig et al., 2006). This, combined with the high obscuration for much of our sample, suggests most of the gas and dust along the line of sight lies within the X-ray dissociation region.
5. Eddington Ratios

The use of hard X-ray luminosity to select a complete sample of AGN is vital to studies of AGN accretion properties. Approximately 90% of our sources would fail to be included in samples selected by optical spectroscopy. Additionally, the use of HST data allows for black hole mass estimates that are independent of AGN properties. Most AGN host galaxies are unresolved in black hole surveys selected by broad (Kollmeier et al., 2006; Vestergaard & Peterson, 2006; Bentz et al., 2006), [O III] (Netzer et al., 2007a) or CIV emission lines (Vestergaard, 2002; Kaspi et al., 2005). Conversely, most of the optical spectra in narrow-line AGN (Barger et al., 2003; Cowie et al., 2003; Szokoly et al., 2004) are good enough for redshifts, but lack the signal-to-noise for a measurement of (e.g., Heckman et al., 2004). Our X-ray selection criteria, combined with not being dependent on line widths for estimates, allows us to examine AGN that are not individually contributing strongly to the accretion history of AGN, but that are a significant fraction of the X-ray luminosity function (and hence total black hole accretion) at intermediate redshifts.
Figure 9 shows the comparison between the black hole mass (Section 3) and bolometric luminosity (Section 4.2). The mean and median Eddington ratios for our sample are and , respectively (where ), meaning the majority of the sample consists of AGN with highly sub-Eddington accretion rates. Only one-third of the sample has . This result – a typically low Eddington ratio within a sample that spans a wide range of values – is similar to results for local Seyfert galaxies (e.g., Cardamone et al., 2007; Mushotzky et al., 2008).
The scarcity of AGN with high accretion rates is at least partly to be expected from our selection criteria. By excluding AGN with low host-to-point source luminosity ratios, we preferentially exclude high-Eddington-ratio black holes for all but the smallest SMBH. Our selection process (§2.1) rejects 34 AGN+hosts in total, of which 16 are too faint to accurately recover bulge luminosities. Given their low fluxes, those 16 objects are unlikely to be bright, near-Eddington accreting AGN. The other 18 rejected objects are point-like in the optical images, which could possibly be due to bright (near-Eddington-accreting) nuclei. However, even if those objects were included, they would constitute a minority of the total sample, indicating that our sample of sub-Eddington AGN represents the dominant AGN population within the GOODS fields at .
The result that more than 90% of our sample is accreting at less than 10% of the Eddington limit is robust to possible sources of error in our analysis. If we were to assume that our sources are accreting at the Eddington limit and use that assumption to calculate SMBH masses, our masses would decrease by more than two orders of magnitude, on average. Such a large deviation is inconsistent both with independent observations of black hole masses and bulges from (e.g., Woo et al., 2008; Jahnke et al., 2009; Merloni et al., 2010) and with constraints on the maximum evolution of the black hole-bulge relation from studies that do assume Eddington-limited accretion (Borys et al., 2005; Bluck et al., 2011). Our results are also inconsistent with scenarios in which most SMBHs cycle between a fully quiescent state and a near-Eddington accretion state (e.g., King, 2010). Even assuming the largest possible deviation in black hole masses based on the maximum evolution of the bulge-black hole relation, our AGN are still in a phase of very slow growth.
The Eddington ratios are presented in Figure 10 in relation to and redshift. To determine whether we see any significant evolution of Eddington ratios (as others have; e.g., Netzer & Trakhtenbrot, 2007; Greene & Ho, 2007), we consider the relevant selection biases. In Figure 10, we plot the hard X-ray luminosity limit (, dashed line) of our sample, which excludes low Eddington ratio, low mass AGN. At the same time, high-luminosity AGN are sufficiently rare that they do not appear in pencil-beam surveys such as GOODS; we show this by plotting in Figure 10 the luminosity at which we expect to detect only 1 AGN within the GOODS volume (which is a function of redshift) from the quasar luminosity function (Croom et al., 2004). After accounting for these selection effects, we detect no correlation between Eddington ratio and either black hole mass or redshift. This lack of real trend is consistent with Woo & Urry (2002), who found that selection effects can create the appearance of correlations where none intrinsically exist.

Our values of are somewhat lower than those reported by others (Kollmeier et al., 2006; Greene & Ho, 2007; Netzer et al., 2007b). Direct comparison between different studies is complicated, however, due to the varying selection criteria, redshifts and flux limits of each study. For example, restricting a comparison to the objects in their paper with redshifts similar to ours, Kollmeier et al. (2006) find that the broad-line AGN from the AGES survey (Kochanek et al., 2004) radiate at near-Eddington rates, . But their study has considerably brighter flux limits than our own, with AGES being 50% complete at , whereas our sample is nearly complete down to under the constraints outlined in Sections 2.1 and 2.2. Direct comparison to the large, optically-selected SDSS quasar sample (Schneider et al., 2007) is also difficult owing to that sample being highly incomplete at low Eddington ratios (Kelly et al., 2010). Samples with similar selection criteria and flux limits (Bundy et al., 2008), and those with overlapping samples from the same survey (Ballo et al., 2007), report Eddington ratios more similar to ours.
Interestingly, many of the aforementioned black hole samples at different redshifts and with different selection criteria do not appear to have radically different accretion rates. Greene & Ho (2007) show that a sample of broad-line AGN selected from the SDSS have a peak black hole mass of at , with a typical Eddington rate of 10%, or a typical accretion rate of yr-1, where is the efficiency of converting mass to light. Most AGN in our sample have similar accretion rates (to within 40%), despite having higher masses and lower Eddington rates. Our accretion rates are consistent with those of Ballo et al. (2007) sample, which overlaps ours somewhat, even though they calculate and differently. Type 1 AGN from the zCOSMOS sample (Merloni et al., 2010), which probes higher redshifts and luminosities than our GOODS sample, are accreting at rate higher than ours by only a factor of . And Hickox et al. (2009), who probe a slightly lower-mass part of the black-hole mass function at similar redshifts, find that black holes in AGN are accreting at a rate within a factor of 2 of ours. These different samples of AGN span a wide range of redshifts, luminosities, and black hole masses, yet they have similar estimates of accretion rates in yr-1, assuming the same radiative efficiency. This suggests that the accretion rates of AGN may be more directly related to the supply of material from the circumnuclear region than the properties of the central black hole.
If we follow Elvis et al. (2002) and assume a minimum radiative efficiency of , our median black hole with an Eddington ratio of 0.006 and mass of is accreting at . This accretion rate is too low to have been the typical rate for the duration of the AGN activity cycle: given our median redshift, it would take a seed black hole a minimum of % of the age of the universe to that point to have grown to its present size, assuming growth from the largest initial mass of direct-collapse black holes (Volonteri et al., 2008), . Given that the seed mass is likely to have been lower, and that this accretion rate is super-Eddington for , the actual time would likely be far higher. For any reasonable assumptions, therefore, the accretion rate of a typical black hole in our sample must have been significantly higher at some point in the past in order for it to grow to its present size within a Hubble time. Assuming a larger radiative efficiency, which Elvis et al. suggest is possible, only strengthens this conclusion.
This is unsurprising given that black hole growth scenarios involving a period of rapid (Eddington-limited) growth followed by a power-law-decay growth rate (e.g., Hopkins et al., 2006; Yu & Lu, 2008) are more consistent with observations of Eddington ratio distributions in a complete sample than constant-growth or “light bulb” scenarios (Hopkins & Hernquist, 2009). Under the specific timescales for a self-regulating feedback model described in Hopkins & Hernquist (2009), we calculate that a black hole with our median observed redshift () and Eddington ratio has an accretion rate that peaks at , assuming a single episode of growth. Such an object would easily be detected above our flux limits. The progenitor to our median AGN should therefore be detected within our sample at its peak growth stage (i.e., accreting at a high Eddington ratio). Extending these calculations to each individual object in our sample, we should detect progenitor AGN accreting at the Eddington limit (within our limiting redshift, ).
In fact, we detect only 7 possible candidates: 3 sources consistent with within our uncertainties and 4 sources for which the detected is a lower limit. The number of Eddington-limited AGN in our sample is too low by at least an order of magnitude to be consistent with the predictions of the Hopkins & Hernquist model. We also considered the possibility that the progenitors of the slow-growing AGN within our limiting redshift () were removed from our sample due to their bright nuclei rendering them point-like in the optical images (§2.1). However, not only are there not enough of those objects (18) to account for the predictions of the model, but the redshift distribution of the excluded point-like AGN is actually lower than that of the objects within our sample (median vs. 0.94 in the included sample). If these objects were progenitors to our slow-growing AGN, their redshifts would necessarily be higher. Comparing the redshift distribution of expected progenitors from our Monte Carlo simulations to the sample of excluded AGN, we find the same result. We therefore argue that the timescales of the single-episode model in Hopkins & Hernquist (2009) do not describe the accretion history of our AGN. A significant fraction of our observed slow-growing black holes must have had a peak growth epoch beyond our maximum redshift.
Overall, most of the X-ray selected AGN constituting our sample are best described as being AGN with high black hole masses and with low accretion rates, in a slow-growth phase. In order to grow to the sizes we observe, the typical source in our sample must have had a significantly higher accretion rate at some point well before . Although a preponderance of slowly growing AGN is qualitatively consistent with self-regulating feedback models in which AGN spend most of their time at low accretion rates, our result is inconsistent with quantitative timescales predicted by common parameterizations of this model. The growth history of black holes is clearly more complex than that described by a single simple model, a conclusion echoed by other studies examining AGN at a variety of different redshifts and luminosities (Kauffmann & Heckman, 2009; Merloni et al., 2010; Cardamone et al., 2010; Steinhardt & Elvis, 2011).
6. Conclusions
We studied 87 AGN with from the GOODS survey to understand the fundamental properties of moderate-luminosity obscured AGN that make up most of the X-ray background and thus a large fraction of black hole growth. Most of these AGN would not be selected via broad emission line surveys or blue color excesses, i.e., the highest- and objects are excluded. However, this sample represents the bulk of AGN emission at .
After morphological fits to separate AGN/host galaxy light and determine bulge-to-total ratios, we estimated black hole masses for each AGN using the relation of Marconi & Hunt (2003) as reformulated by Ferrarese & Ford (2005). We do not assume this relation evolves with redshift, but use a Monte Carlo error analysis to account for uncertainty in the time evolution of Equation 1 as well as other parameter uncertainties. The resulting uncertainties in our black hole masses are typically on the order of 0.5 dex.
Using an unobscured AGN template calculated from broad-line AGN in the GOODS fields, we calculated bolometric luminosities individually for each object by reddening the normalized template SED to match nuclear point-source colors and using the fitted to calculate the energy re-radiated in the far-infrared by dust surrounding the AGN. This method is consistent with single-prescription empirical bolometric correction methods and with independent theoretical models, but has less scatter.
The SED fitting of the nuclear point sources gives the added benefit of an estimate of dust absorption upon the AGN template. Assuming a standard Galactic reddening curve, we find that 70% of the AGN have dust-to-gas ratios similar to local Seyferts (Maiolino et al., 2001). The host galaxy contribution to the nuclear line-of-sight obscuration in the GOODS AGN is minimal for most of our sources.
Our survey reveals a considerable fraction of low-Eddington-accreting, high-black-hole-mass AGN in normal host galaxies. The mean Eddington ratio for our sample is , considerably lower than in broad-line AGN surveys such as SDSS (Netzer et al., 2007a; Greene & Ho, 2007). Many of these AGN have properties consistent with local Seyfert AGN (Mushotzky et al., 2008). Even considering the small uncertainties in the Eddington ratio, which reflect the current uncertainty in the time evolution of the bulge-black hole mass relation, our typical source is still accreting at well below the Eddington limit.
The observed Eddington ratios of our sources are low, but their black hole masses are high, meaning they must have been accreting at significantly higher rates at some point during their growth history in order for them to have reached their observed masses within a Hubble time. According to self-regulating feedback accretion models for black hole growth, our black holes could be the slow-growth phase of their AGN lifetimes; comparison with accretion timescales from simple models of self-regulated feedback indicate that our AGN sample may have a complex accretion history. A significant fraction of our sample must have been accreting at near-Eddington rates before . Such a complex growth history is consistent with the downsizing scenario (Barger et al., 2005; Hasinger et al., 2005).
The use of the point-source luminosity as leverage to extract the multi-wavelength AGN SED from a combined AGN plus host galaxy source is a promising technique. In particular, the high-resolution infrared data promised by JWST could be used to significantly increase the accuracy of the central reddening determination, which would decrease uncertainty about the re-radiated dust luminosity in the FIR range. This technique may also benefit from the separation of AGN and host galaxies at IR wavelengths using WFC3 (Schawinski et al., 2011). Although the efficacy of host-point-source separation has not yet been studied in as much depth using WFC3 data as it has for ACS, the addition of several data points to the low-resolution point-source SED would be very valuable.
References
- Alexander et al. (2003) Alexander, D. M., Bauer, F. E., Brandt, W. N., Schneider, D. P., Hornschemeier, A. E., Vignali, C., Barger, A. J., Broos, P. S., Cowie, L. L., Garmire, G. P., Townsley, L. K., Bautz, M. W., Chartas, G., & Sargent, W. L. W. 2003, AJ, 126, 539
- Alexander et al. (2008) Alexander, D. M., Brandt, W. N., Smail, I., Swinbank, A. M., Bauer, F. E., Blain, A. W., Chapman, S. C., Coppin, K. E. K., Ivison, R. J., & Menéndez-Delmestre, K. 2008, AJ, 135, 1968
- Alonso-Herrero et al. (2008) Alonso-Herrero, A., Pérez-González, P. G., Rieke, G. H., Alexander, D. M., Rigby, J. R., Papovich, C., Donley, J. L., & Rigopoulou, D. 2008, ApJ, 677, 127
- Ballo et al. (2007) Ballo, L., Cristiani, S., Fasano, G., Fontanot, F., Monaco, P., Nonino, M., Pignatelli, E., Tozzi, P., Vanzella, E., Fontana, A., Giallongo, E., Grazian, A., & Danese, L. 2007, ApJ, 667, 97
- Barger et al. (2003) Barger, A. J., Cowie, L. L., Capak, P., Alexander, D. M., Bauer, F. E., Fernandez, E., Brandt, W. N., Garmire, G. P., & Hornschemeier, A. E. 2003, AJ, 126, 632
- Barger et al. (2005) Barger, A. J., Cowie, L. L., Mushotzky, R. F., Yang, Y., Wang, W., Steffen, A. T., & Capak, P. 2005, AJ, 129, 578
- Bauer et al. (2004) Bauer, F. E., Alexander, D. M., Brandt, W. N., Schneider, D. P., Treister, E., Hornschemeier, A. E., & Garmire, G. P. 2004, AJ, 128, 2048
- Bentz et al. (2006) Bentz, M. C., Peterson, B. M., Pogge, R. W., Vestergaard, M., & Onken, C. A. 2006, ApJ, 644, 133
- Bertin & Arnouts (1996) Bertin, E., & Arnouts, S. 1996, A&AS, 117, 393
- Bluck et al. (2011) Bluck, A. F. L., Conselice, C. J., Almaini, O., Laird, E. S., Nandra, K., & Grützbauch, R. 2011, MNRAS, 410, 1174
- Borys et al. (2005) Borys, C., Smail, I., Chapman, S. C., Blain, A. W., Alexander, D. M., & Ivison, R. J. 2005, ApJ, 635, 853
- Bundy et al. (2008) Bundy, K., Georgakakis, A., Nandra, K., Ellis, R. S., Conselice, C. J., Laird, E., Coil, A., Cooper, M. C., Faber, S. M., Newman, J. A., Pierce, C. M., Primack, J. R., & Yan, R. 2008, ApJ, 681, 931
- Cardamone et al. (2007) Cardamone, C. N., Moran, E. C., & Kay, L. E. 2007, AJ, 134, 1263
- Cardamone et al. (2010) Cardamone, C. N., Urry, C. M., Schawinski, K., Treister, E., Brammer, G., & Gawiser, E. 2010, ApJ, 721, L38
- Cardelli et al. (1989) Cardelli, J. A., Clayton, G. C., & Mathis, J. S. 1989, ApJ, 345, 245
- Cowie et al. (2003) Cowie, L. L., Barger, A. J., Bautz, M. W., Brandt, W. N., & Garmire, G. P. 2003, ApJ, 584, L57
- Cowie et al. (2004) Cowie, L. L., Barger, A. J., Hu, E. M., Capak, P., & Songaila, A. 2004, AJ, 127, 3137
- Croom et al. (2004) Croom, S. M., Smith, R. J., Boyle, B. J., Shanks, T., Miller, L., Outram, P. J., & Loaring, N. S. 2004, MNRAS, 349, 1397
- Decarli et al. (2010) Decarli, R., Falomo, R., Treves, A., Labita, M., Kotilainen, J. K., & Scarpa, R. 2010, MNRAS, 402, 2453
- Draine (2003) Draine, B. T. 2003, ApJ, 598, 1017
- Draine & Li (2007) Draine, B. T., & Li, A. 2007, ApJ, 657, 810
- Elitzur & Shlosman (2006) Elitzur, M., & Shlosman, I. 2006, ApJ, 648, L101
- Elvis et al. (2002) Elvis, M., Risaliti, G., & Zamorani, G. 2002, ApJ, 565, L75
- Elvis et al. (1994) Elvis, M., Wilkes, B. J., McDowell, J. C., Green, R. F., Bechtold, J., Willner, S. P., Oey, M. S., Polomski, E., & Cutri, R. 1994, ApJS, 95, 1
- Fabian & Iwasawa (1999) Fabian, A. C., & Iwasawa, K. 1999, MNRAS, 303, L34
- Ferrarese & Ford (2005) Ferrarese, L., & Ford, H. 2005, Space Science Reviews, 116, 523
- Ferrarese & Ford (1999) Ferrarese, L., & Ford, H. C. 1999, ApJ, 515, 583
- Ford et al. (1994) Ford, H. C., Harms, R. J., Tsvetanov, Z. I., Hartig, G. F., Dressel, L. L., Kriss, G. A., Bohlin, R. C., Davidsen, A. F., Margon, B., & Kochhar, A. K. 1994, ApJ, 435, L27
- Gabor et al. (2009) Gabor, J. M., Impey, C. D., Jahnke, K., Simmons, B. D., Trump, J. R., Koekemoer, A. M., Brusa, M., Cappelluti, N., Schinnerer, E., Smolčić, V., Salvato, M., Rhodes, J. D., Mobasher, B., Capak, P., Massey, R., Leauthaud, A., & Scoville, N. 2009, ApJ, 691, 705
- Genzel et al. (1997) Genzel, R., Eckart, A., Ott, T., & Eisenhauer, F. 1997, MNRAS, 291, 219
- Ghez et al. (2005) Ghez, A. M., Salim, S., Hornstein, S. D., Tanner, A., Lu, J. R., Morris, M., Becklin, E. E., & Duchêne, G. 2005, ApJ, 620, 744
- Giacconi et al. (2002) Giacconi, R., Zirm, A., Wang, J., Rosati, P., Nonino, M., Tozzi, P., Gilli, R., Mainieri, V., Hasinger, G., Kewley, L., Bergeron, J., Borgani, S., Gilmozzi, R., Grogin, N., Koekemoer, A., Schreier, E., Zheng, W., & Norman, C. 2002, ApJS, 139, 369
- Giavalisco et al. (2004) Giavalisco, M., et al. 2004, ApJ, 600, L93
- Greene & Ho (2007) Greene, J. E., & Ho, L. C. 2007, ApJ, 667, 131
- Greenhill et al. (2003) Greenhill, L. J., Kondratko, P. T., Lovell, J. E. J., Kuiper, T. B. H., Moran, J. M., Jauncey, D. L., & Baines, G. P. 2003, ApJ, 582, L11
- Grogin et al. (2003) Grogin, N. A., Koekemoer, A. M., Schreier, E. J., Bergeron, J., Giacconi, R., Hasinger, G., Kewley, L., Norman, C., Rosati, P., Tozzi, P., & Zirm, A. 2003, ApJ, 595, 685
- Hasinger et al. (2005) Hasinger, G., Miyaji, T., & Schmidt, M. 2005, A&A, 441, 417
- Heckman et al. (2004) Heckman, T. M., Kauffmann, G., Brinchmann, J., Charlot, S., Tremonti, C., & White, S. D. M. 2004, ApJ, 613, 109
- Herrnstein et al. (1999) Herrnstein, J. R., Moran, J. M., Greenhill, L. J., Diamond, P. J., Inoue, M., Nakai, N., Miyoshi, M., Henkel, C., & Riess, A. 1999, Nature, 400, 539
- Hickox et al. (2009) Hickox, R. C., Jones, C., Forman, W. R., Murray, S. S., Kochanek, C. S., Eisenstein, D., Jannuzi, B. T., Dey, A., Brown, M. J. I., Stern, D., Eisenhardt, P. R., Gorjian, V., Brodwin, M., Narayan, R., Cool, R. J., Kenter, A., Caldwell, N., & Anderson, M. E. 2009, ApJ, 696, 891
- Hönig et al. (2006) Hönig, S. F., Beckert, T., Ohnaka, K., & Weigelt, G. 2006, A&A, 452, 459
- Hopkins & Hernquist (2009) Hopkins, P. F., & Hernquist, L. 2009, ApJ, 698, 1550
- Hopkins et al. (2006) Hopkins, P. F., Hernquist, L., Cox, T. J., Robertson, B., Di Matteo, T., & Springel, V. 2006, ApJ, 639, 700
- Hopkins et al. (2007) Hopkins, P. F., Richards, G. T., & Hernquist, L. 2007, ApJ, 654, 731
- Hopkins et al. (2004) Hopkins, P. F., Strauss, M. A., Hall, P. B., Richards, G. T., Cooper, A. S., Schneider, D. P., Vanden Berk, D. E., Jester, S., Brinkmann, J., & Szokoly, G. P. 2004, AJ, 128, 1112
- Jahnke et al. (2009) Jahnke, K., Bongiorno, A., Brusa, M., Capak, P., Cappelluti, N., Cisternas, M., Civano, F., Colbert, J., Comastri, A., Elvis, M., Hasinger, G., Ilbert, O., Impey, C., Inskip, K., Koekemoer, A. M., Lilly, S., Maier, C., Merloni, A., Riechers, D., Salvato, M., Schinnerer, E., Scoville, N. Z., Silverman, J., Taniguchi, Y., Trump, J. R., & Yan, L. 2009, ApJ, 706, L215
- Kaspi et al. (2005) Kaspi, S., Maoz, D., Netzer, H., Peterson, B. M., Vestergaard, M., & Jannuzi, B. T. 2005, ApJ, 629, 61
- Kauffmann & Heckman (2009) Kauffmann, G., & Heckman, T. M. 2009, MNRAS, 397, 135
- Kelly et al. (2010) Kelly, B. C., Vestergaard, M., Fan, X., Hopkins, P., Hernquist, L., & Siemiginowska, A. 2010, ApJ, 719, 1315
- King (2010) King, A. R. 2010, MNRAS, 408, L95
- Kochanek et al. (2004) Kochanek, C. S., Eisenstein, D., Caldwell, N., Cool, R., Green, P., & AGES. 2004, in Bulletin of the American Astronomical Society, Vol. 36, Bulletin of the American Astronomical Society, 1495–+
- Koekemoer et al. (2002) Koekemoer, A. M., Fruchter, A. S., Hook, R. N., & Hack, W. 2002, in The 2002 HST Calibration Workshop : Hubble after the Installation of the ACS and the NICMOS Cooling System, Proceedings of a Workshop held at the Space Telescope Science Institute, Baltimore, Maryland, October 17 and 18, 2002. Edited by Santiago Arribas, Anton Koekemoer, and Brad Whitmore. Baltimore, MD: Space Telescope Science Institute, 2002., p.337, ed. S. Arribas, A. Koekemoer, & B. Whitmore, 337–+
- Kollmeier et al. (2006) Kollmeier, J. A., Onken, C. A., Kochanek, C. S., Gould, A., Weinberg, D. H., Dietrich, M., Cool, R., Dey, A., Eisenstein, D. J., Jannuzi, B. T., Le Floc’h, E., & Stern, D. 2006, ApJ, 648, 128
- Krist (1993) Krist, J. 1993, in Astronomical Society of the Pacific Conference Series, Vol. 52, Astronomical Data Analysis Software and Systems II, ed. R. J. Hanisch, R. J. V. Brissenden, & J. Barnes, 536–+
- La Franca et al. (2005) La Franca, F., Fiore, F., Comastri, A., Perola, G. C., Sacchi, N., Brusa, M., Cocchia, F., Feruglio, C., Matt, G., Vignali, C., Carangelo, N., Ciliegi, P., Lamastra, A., Maiolino, R., Mignoli, M., Molendi, S., & Puccetti, S. 2005, ApJ, 635, 864
- Mainieri et al. (2005) Mainieri, V., Rosati, P., Tozzi, P., Bergeron, J., Gilli, R., Hasinger, G., Nonino, M., Lehmann, I., Alexander, D. M., Idzi, R., Koekemoer, A. M., Norman, C., Szokoly, G., & Zheng, W. 2005, A&A, 437, 805
- Maiolino et al. (2001) Maiolino, R., Marconi, A., Salvati, M., Risaliti, G., Severgnini, P., Oliva, E., La Franca, F., & Vanzi, L. 2001, A&A, 365, 28
- Maiolino et al. (1997) Maiolino, R., Ruiz, M., Rieke, G. H., & Papadopoulos, P. 1997, ApJ, 485, 552
- Marconi & Hunt (2003) Marconi, A., & Hunt, L. K. 2003, ApJ, 589, L21
- Marconi et al. (2004) Marconi, A., Risaliti, G., Gilli, R., Hunt, L. K., Maiolino, R., & Salvati, M. 2004, MNRAS, 351, 169
- Martin et al. (1989) Martin, N., Maurice, E., & Lequeux, J. 1989, A&A, 215, 219
- Mathis et al. (1983) Mathis, J. S., Mezger, P. G., & Panagia, N. 1983, A&A, 128, 212
- Merloni et al. (2010) Merloni, A., Bongiorno, A., Bolzonella, M., Brusa, M., Civano, F., Comastri, A., Elvis, M., Fiore, F., Gilli, R., Hao, H., Jahnke, K., Koekemoer, A. M., Lusso, E., Mainieri, V., Mignoli, M., Miyaji, T., Renzini, A., Salvato, M., Silverman, J., Trump, J., Vignali, C., Zamorani, G., Capak, P., Lilly, S. J., Sanders, D., Taniguchi, Y., Bardelli, S., Carollo, C. M., Caputi, K., Contini, T., Coppa, G., Cucciati, O., de la Torre, S., de Ravel, L., Franzetti, P., Garilli, B., Hasinger, G., Impey, C., Iovino, A., Iwasawa, K., Kampczyk, P., Kneib, J., Knobel, C., Kovač, K., Lamareille, F., Le Borgne, J., Le Brun, V., Le Fèvre, O., Maier, C., Pello, R., Peng, Y., Perez Montero, E., Ricciardelli, E., Scodeggio, M., Tanaka, M., Tasca, L. A. M., Tresse, L., Vergani, D., & Zucca, E. 2010, ApJ, 708, 137
- Miyoshi et al. (1995) Miyoshi, M., Moran, J., Herrnstein, J., Greenhill, L., Nakai, N., Diamond, P., & Inoue, M. 1995, Nature, 373, 127
- Mushotzky et al. (2008) Mushotzky, R. F., Winter, L. M., McIntosh, D. H., & Tueller, J. 2008, ApJ, 684, L65
- Netzer et al. (2007a) Netzer, H., Lira, P., Trakhtenbrot, B., Shemmer, O., & Cury, I. 2007a, ApJ, 671, 1256
- Netzer et al. (2007b) Netzer, H., Lutz, D., Schweitzer, M., Contursi, A., Sturm, E., Tacconi, L. J., Veilleux, S., Kim, D.-C., Rupke, D., Baker, A. J., Dasyra, K., Mazzarella, J., & Lord, S. 2007b, ApJ, 666, 806
- Netzer & Trakhtenbrot (2007) Netzer, H., & Trakhtenbrot, B. 2007, ApJ, 654, 754
- Peng et al. (2002) Peng, C. Y., Ho, L. C., Impey, C. D., & Rix, H.-W. 2002, AJ, 124, 266
- Peng et al. (2006) Peng, C. Y., Impey, C. D., Ho, L. C., Barton, E. J., & Rix, H.-W. 2006, ApJ, 640, 114
- Persic et al. (2004) Persic, M., Rephaeli, Y., Braito, V., Cappi, M., Della Ceca, R., Franceschini, A., & Gruber, D. E. 2004, A&A, 419, 849
- Peterson (1993) Peterson, B. M. 1993, PASP, 105, 247
- Peterson & Wandel (2000) Peterson, B. M., & Wandel, A. 2000, ApJ, 540, L13
- Pierce et al. (2007) Pierce, C. M., Lotz, J. M., Laird, E. S., Lin, L., Nandra, K., Primack, J. R., Faber, S. M., Barmby, P., Park, S. Q., Willner, S. P., Gwyn, S., Koo, D. C., Coil, A. L., Cooper, M. C., Georgakakis, A., Koekemoer, A. M., Noeske, K. G., Weiner, B. J., & Willmer, C. N. A. 2007, ApJ, 660, L19
- Pierce et al. (2010a) Pierce, C. M., Lotz, J. M., Primack, J. R., Rosario, D. J. V., Griffith, R. L., Conselice, C. J., Faber, S. M., Koo, D. C., Coil, A. L., Salim, S., Koekemoer, A. M., Laird, E. S., Ivison, R. J., & Yan, R. 2010a, MNRAS, 405, 718
- Pierce et al. (2010b) Pierce, C. M., Lotz, J. M., Salim, S., Laird, E. S., Coil, A. L., Bundy, K., Willmer, C. N. A., Rosario, D. J. V., Primack, J. R., & Faber, S. M. 2010b, MNRAS, 408, 139
- Richards et al. (2006) Richards, G. T., Lacy, M., Storrie-Lombardi, L. J., Hall, P. B., Gallagher, S. C., Hines, D. C., Fan, X., Papovich, C., Vanden Berk, D. E., Trammell, G. B., Schneider, D. P., Vestergaard, M., York, D. G., Jester, S., Anderson, S. F., Budavári, T., & Szalay, A. S. 2006, ApJS, 166, 470
- Sánchez et al. (2004) Sánchez, S. F., Jahnke, K., Wisotzki, L., McIntosh, D. H., Bell, E. F., Barden, M., Beckwith, S. V. W., Borch, A., Caldwell, J. A. R., Häussler, B., Jogee, S., Meisenheimer, K., Peng, C. Y., Rix, H.-W., Somerville, R. S., & Wolf, C. 2004, ApJ, 614, 586
- Sanders et al. (1988) Sanders, D. B., Soifer, B. T., Elias, J. H., Madore, B. F., Matthews, K., Neugebauer, G., & Scoville, N. Z. 1988, ApJ, 325, 74
- Sarajedini et al. (2006) Sarajedini, V. L., Koo, D. C., Phillips, A. C., Kobulnicky, H. A., Gebhardt, K., Willmer, C. N. A., Vogt, N. P., Laird, E., Im, M., Iverson, S., & Mattos, W. 2006, ApJS, 166, 69
- Schawinski et al. (2011) Schawinski, K., Treister, E., Urry, C. M., Cardamone, C. N., Simmons, B., & Yi, S. K. 2011, ApJ, 727, L31+
- Schneider et al. (2007) Schneider, D. P., Hall, P. B., Richards, G. T., Strauss, M. A., Vanden Berk, D. E., Anderson, S. F., Brandt, W. N., Fan, X., Jester, S., Gray, J., Gunn, J. E., SubbaRao, M. U., Thakar, A. R., Stoughton, C., Szalay, A. S., Yanny, B., York, D. G., Bahcall, N. A., Barentine, J., Blanton, M. R., Brewington, H., Brinkmann, J., Brunner, R. J., Castander, F. J., Csabai, I., Frieman, J. A., Fukugita, M., Harvanek, M., Hogg, D. W., Ivezić, Ž., Kent, S. M., Kleinman, S. J., Knapp, G. R., Kron, R. G., Krzesiński, J., Long, D. C., Lupton, R. H., Nitta, A., Pier, J. R., Saxe, D. H., Shen, Y., Snedden, S. A., Weinberg, D. H., & Wu, J. 2007, AJ, 134, 102
- Shull & van Steenberg (1985) Shull, J. M., & van Steenberg, M. E. 1985, ApJ, 294, 599
- Simmons & Urry (2008) Simmons, B. D., & Urry, C. M. 2008, ApJ, 683, 644
- Spergel et al. (2003) Spergel, D. N., Verde, L., Peiris, H. V., Komatsu, E., Nolta, M. R., Bennett, C. L., Halpern, M., Hinshaw, G., Jarosik, N., Kogut, A., Limon, M., Meyer, S. S., Page, L., Tucker, G. S., Weiland, J. L., Wollack, E., & Wright, E. L. 2003, ApJS, 148, 175
- Steinhardt & Elvis (2011) Steinhardt, C. L., & Elvis, M. 2011, MNRAS, 410, 201
- Szokoly et al. (2004) Szokoly, G. P., et al. 2004, ApJS, 155, 271
- Taylor et al. (2009) Taylor, E. N., Franx, M., van Dokkum, P. G., Quadri, R. F., Gawiser, E., Bell, E. F., Barrientos, L., Blanc, G. A., Castander, F. J., Damen, M., Gonzalez-Perez, V., Hall, P. B., Herrera, D., Hildebrandt, H., Kriek, M., Labbé, I., Lira, P., Maza, J., Rudnick, G., Treister, E., Urry, C., Willis, J. P., & Wuyts, S. 2009, ArXiv e-prints
- Treister et al. (2008) Treister, E., Krolik, J. H., & Dullemond, C. 2008, ApJ, 679, 140
- Treister & Urry (2005) Treister, E., & Urry, C. M. 2005, ApJ, 630, 115
- Treister & Urry (2006) —. 2006, ApJ, 652, L79
- Treister et al. (2006) Treister, E., Urry, C. M., Van Duyne, J., Dickinson, M., Chary, R.-R., Alexander, D. M., Bauer, F., Natarajan, P., Lira, P., & Grogin, N. A. 2006, ApJ, 640, 603
- Treister et al. (2009) Treister, E., Urry, C. M., & Virani, S. 2009, ApJ, 696, 110
- Treister et al. (2004) Treister, E., et al. 2004, ApJ, 616, 123
- Treu et al. (2004) Treu, T., Malkan, M. A., & Blandford, R. D. 2004, ApJ, 615, L97
- Ueda et al. (2003) Ueda, Y., Akiyama, M., Ohta, K., & Miyaji, T. 2003, ApJ, 598, 886
- Vestergaard (2002) Vestergaard, M. 2002, ApJ, 571, 733
- Vestergaard & Peterson (2006) Vestergaard, M., & Peterson, B. M. 2006, ApJ, 641, 689
- Volonteri et al. (2008) Volonteri, M., Lodato, G., & Natarajan, P. 2008, MNRAS, 383, 1079
- Willott et al. (2004) Willott, C. J., Simpson, C., Almaini, O., Johnson, O., Lawrence, A., Dunlop, J. S., Roche, N. D., Mann, R. G., Manners, J. C., González-Solares, E., Pérez-Fournon, I., Ivison, R. J., Serjeant, S., Oliver, S. J., McMahon, R. G., & Rowan-Robinson, M. 2004, ApJ, 610, 140
- Wirth et al. (2004) Wirth, G. D., Willmer, C. N. A., Amico, P., Chaffee, F. H., Goodrich, R. W., Kwok, S., Lyke, J. E., Mader, J. A., Tran, H. D., Barger, A. J., Cowie, L. L., Capak, P., Coil, A. L., Cooper, M. C., Conrad, A., Davis, M., Faber, S. M., Hu, E. M., Koo, D. C., Le Mignant, D., Newman, J. A., & Songaila, A. 2004, AJ, 127, 3121
- Woo et al. (2008) Woo, J., Treu, T., Malkan, M. A., & Blandford, R. D. 2008, ApJ, 681, 925
- Woo & Urry (2002) Woo, J., & Urry, C. M. 2002, ApJ, 581, L5
- Woo et al. (2005) Woo, J.-H., Urry, C. M., van der Marel, R. P., Lira, P., & Maza, J. 2005, ApJ, 631, 762
- Wright (2006) Wright, E. L. 2006, PASP, 118, 1711
- Yu & Lu (2008) Yu, Q., & Lu, Y. 2008, ApJ, 689, 732
| Optical Position | Rest-frame B (AB mag) | |||||||
|---|---|---|---|---|---|---|---|---|
| IDaaX-ray IDs from Alexander et al. (2003) | RA | DEC | Total | Pt src | Host | B/Tot | () | |
| N 48 | 188.983765 | 62.205441 | 0.940 | 21.7410.012 | 21.740.01 | |||
| N 72 | 189.023956 | 62.167603 | 0.936 | 22.0200.007 | 23.400.19 | 22.380.23 | ||
| N 76 | 189.027634 | 62.164326 | 0.637 | 21.3890.010 | 26.790.39 | 21.400.21 | ||
| N 82 | 189.033875 | 62.176731 | 0.681 | 20.9900.004 | 22.900.24 | 21.190.24 | ||
| N 90 | 189.046814 | 62.150940 | 1.140 | 22.3400.013 | 24.480.14 | 22.500.20 | ||
| N 93 | 189.050156 | 62.194221 | 0.275 | 19.7840.001 | 23.080.21 | 19.840.23 | ||
| N103 | 189.060364 | 62.121876 | 0.969 | 21.1940.012 | 24.860.15 | 21.300.18 | ||
| N110 | 189.070221 | 62.104027 | 1.141 | 21.4790.008 | 26.230.26 | 21.480.19 | ||
| N113 | 189.071228 | 62.169903 | 0.845 | 22.4510.011 | 25.240.17 | 22.450.17 | ||
| N116bbBroad-Line AGN (Cowie et al., 2003; Wirth et al., 2004; Szokoly et al., 2004). | 189.077530 | 62.187622 | 1.022 | 20.5540.006 | 22.530.29 | 20.550.26 | ||
| N127 | 189.088516 | 62.185921 | 1.014 | 21.8810.011 | 26.220.26 | 21.880.19 | ||
| N139 | 189.098541 | 62.310368 | 1.013 | 21.4110.014 | 24.670.14 | 21.410.19 | ||
| N150 | 189.114609 | 62.174030 | 0.762 | 23.1150.023 | 26.690.38 | 23.110.19 | ||
| N158 | 189.121506 | 62.179565 | 1.013 | 21.9570.018 | 27.880.76 | 21.960.17 | ||
| N160 | 189.122055 | 62.270576 | 0.848 | 21.4640.005 | 24.000.14 | 21.460.22 | ||
| N163 | 189.124893 | 62.095203 | 0.485 | 21.3890.005 | 23.810.16 | 21.390.22 | ||
| N164 | 189.125244 | 62.156734 | 0.953 | 22.4250.009 | 25.230.16 | 22.420.17 | ||
| N170 | 189.132751 | 62.295914 | 0.680 | 21.8290.008 | 26.150.24 | 21.850.19 | ||
| N174 | 189.138474 | 62.143036 | 0.934 | 21.0840.005 | 22.520.30 | 21.420.26 | ||
| N177 | 189.140244 | 62.168388 | 1.016 | 21.3360.008 | 26.400.30 | 21.350.19 | ||
| N187 | 189.145264 | 62.274620 | 0.847 | 22.4440.015 | 25.770.19 | 22.500.18 | ||
| N194 | 189.153198 | 62.199001 | 0.555 | 22.9690.008 | 27.240.52 | 22.990.19 | ||
| N201 | 189.160385 | 62.227596 | 1.020 | 22.0590.015 | 25.840.19 | 22.090.18 | ||
| N205 | 189.162918 | 62.162346 | 1.230 | 22.9980.017 | 26.160.27 | 23.060.19 | ||
| N217 | 189.173203 | 62.163483 | 0.518 | 21.4970.005 | 28.741.08 | 21.500.17 | ||
| N222 | 189.175827 | 62.262722 | 0.857 | 21.3800.008 | 24.000.14 | 21.480.22 | ||
| N240 | 189.193115 | 62.234734 | 0.961 | 20.8670.005 | 22.850.24 | 21.060.24 | ||
| N242 | 189.194107 | 62.149166 | 0.890 | 23.8610.041 | 28.370.93 | 23.880.16 | ||
| N261 | 189.209030 | 62.204823 | 0.902 | 21.9710.010 | 26.910.43 | 21.980.20 | ||
| N262 | 189.209595 | 62.334686 | 1.011 | 22.5660.010 | 23.970.14 | 22.920.22 | ||
| N266 | 189.213638 | 62.181107 | 1.100 | 22.9750.017 | 25.890.19 | 23.050.18 | ||
| N278 | 189.222992 | 62.338577 | 1.023 | 23.1660.013 | 24.760.15 | 23.450.19 | ||
| N286 | 189.231064 | 62.219883 | 0.955 | 21.6260.008 | 24.520.14 | 21.700.19 | ||
| N304 | 189.245163 | 62.243118 | 0.678 | 20.7650.005 | 23.380.19 | 20.870.23 | ||
| N309 | 189.249268 | 62.326241 | 1.144 | 22.5820.017 | 24.920.14 | 22.720.18 | ||
| N323bbBroad-Line AGN (Cowie et al., 2003; Wirth et al., 2004; Szokoly et al., 2004). | 189.261353 | 62.262199 | 0.514 | 20.3930.002 | 21.720.41 | 20.770.54 | ||
| N349 | 189.281601 | 62.332314 | 1.030 | 23.5220.027 | 26.520.33 | 23.590.19 | ||
| N352 | 189.282730 | 62.268341 | 0.936 | 20.9800.006 | 26.690.37 | 20.990.20 | ||
| N370 | 189.300629 | 62.298428 | 1.060 | 22.6830.014 | 24.890.14 | 22.840.18 | ||
| N373 | 189.307480 | 62.240242 | 0.475 | 22.6280.006 | 28.170.85 | 22.630.16 | ||
| N384 | 189.316345 | 62.203796 | 1.019 | 21.9850.018 | 26.520.33 | 22.000.21 | ||
| N390 | 189.319489 | 62.292667 | 1.146 | 22.1230.008 | 22.980.22 | 22.780.23 | ||
| N402 | 189.334732 | 62.231556 | 0.780 | 23.0140.232 | 29.790.85 | 23.020.05 | ||
| N405 | 189.340988 | 62.176670 | 0.978 | 21.1810.006 | 25.000.14 | 21.180.17 | ||
| N437 | 189.393890 | 62.232430 | 0.839 | 20.8900.006 | 25.230.15 | 20.910.17 | ||
| N442 | 189.402100 | 62.225620 | 0.852 | 22.1930.009 | 24.760.14 | 22.300.18 | ||
| N448 | 189.408051 | 62.219257 | 1.238 | 22.7090.016 | 26.360.29 | 22.750.20 | ||
| N451bbBroad-Line AGN (Cowie et al., 2003; Wirth et al., 2004; Szokoly et al., 2004). | 189.413559 | 62.349976 | 0.837 | 20.5280.006 | 21.580.42 | 21.050.64 | ||
| N471 | 189.462021 | 62.266979 | 1.170 | 21.0070.006 | 24.120.14 | 21.070.21 | ||
| N473bbBroad-Line AGN (Cowie et al., 2003; Wirth et al., 2004; Szokoly et al., 2004). | 189.469681 | 62.274593 | 0.307 | 19.4670.001 | 20.670.47 | 19.901.12 | ||
| S 44 | 53.015217 | -27.767685 | 0.574 | 21.4340.004 | 25.560.17 | 21.460.18 | ||
| S 84 | 53.050934 | -27.772406 | 1.033 | 21.8660.010 | 25.500.17 | 21.910.18 | ||
| S 88 | 53.055191 | -27.711349 | 0.605 | 19.8250.002 | 23.450.18 | 19.860.23 | ||
| S 91 | 53.057728 | -27.713583 | 0.735 | 21.2400.006 | 25.680.18 | 21.260.18 | ||
| S103bbBroad-Line AGN (Cowie et al., 2003; Wirth et al., 2004; Szokoly et al., 2004). | 53.062420 | -27.857510 | 0.675 | 20.9360.005 | 25.520.17 | 20.950.18 | ||
| S117 | 53.071434 | -27.717588 | 0.569 | 21.7420.003 | 23.510.18 | 21.980.22 | ||
| S118 | 53.071533 | -27.872456 | 1.097 | 21.7740.010 | 24.890.14 | 21.840.18 | ||
| S134 | 53.085327 | -27.792313 | 0.604 | 22.1180.010 | 26.080.22 | 22.150.18 | ||
| S137 | 53.089264 | -27.708660 | 0.736 | 21.5870.007 | 24.640.14 | 21.650.19 | ||
| S139 | 53.091618 | -27.782206 | 0.668 | 20.8930.006 | 24.490.14 | 20.930.20 | ||
| S151 | 53.096489 | -27.765188 | 1.223 | 22.3280.016 | 25.250.16 | 22.400.17 | ||
| S155 | 53.101063 | -27.690676 | 0.534 | 21.7070.006 | 24.980.14 | 21.760.17 | ||
| S156 | 53.102264 | -27.669563 | 0.890 | 22.5450.011 | 27.730.70 | 22.550.17 | ||
| S159 | 53.103516 | -27.933329 | 1.170 | 23.1120.027 | 26.830.40 | 23.150.22 | ||
| S160 | 53.103989 | -27.835567 | 1.037 | 23.9450.033 | 25.940.20 | 24.130.28 | ||
| S161 | 53.104088 | -27.683752 | 0.733 | 21.4460.005 | 24.190.14 | 21.540.21 | ||
| S162 | 53.104607 | -27.845348 | 1.043 | 22.6460.013 | 24.970.14 | 22.780.31 | ||
| S164 | 53.104836 | -27.913925 | 1.090 | 21.2090.005 | 24.880.14 | 21.250.18 | ||
| S171 | 53.107746 | -27.918444 | 1.034 | 22.6230.019 | 26.370.29 | 22.660.20 | ||
| S176 | 53.111511 | -27.695988 | 0.734 | 21.8870.009 | 24.390.14 | 22.000.20 | ||
| S179bbBroad-Line AGN (Cowie et al., 2003; Wirth et al., 2004; Szokoly et al., 2004). | 53.115097 | -27.695805 | 0.668 | 21.6140.005 | 24.830.14 | 21.670.18 | ||
| S184 | 53.120827 | -27.958441 | 0.640 | 20.2840.004 | 21.780.40 | 20.600.48 | ||
| S193bbBroad-Line AGN (Cowie et al., 2003; Wirth et al., 2004; Szokoly et al., 2004). | 53.125252 | -27.756536 | 0.960 | 21.7930.009 | 23.020.22 | 22.220.23 | ||
| S200 | 53.133675 | -27.698660 | 0.960 | 23.0000.028 | 24.560.14 | 23.300.19 | ||
| S203 | 53.137436 | -27.688057 | 1.050 | 20.9220.007 | 25.130.15 | 20.940.17 | ||
| S214 | 53.145634 | -27.919777 | 0.839 | 22.1820.010 | 24.420.14 | 22.330.20 | ||
| S220 | 53.149342 | -27.683189 | 0.735 | 21.7640.006 | 25.820.19 | 21.790.18 | ||
| S227 | 53.152973 | -27.735123 | 0.665 | 22.0590.010 | 24.280.14 | 22.210.21 | ||
| S229 | 53.156075 | -27.666695 | 0.664 | 22.1640.008 | 23.030.22 | 22.810.23 | ||
| S249 | 53.173805 | -27.724491 | 0.979 | 22.6370.017 | 27.090.48 | 22.660.20 | ||
| S263bbBroad-Line AGN (Cowie et al., 2003; Wirth et al., 2004; Szokoly et al., 2004). | 53.185226 | -27.827835 | 1.016 | 22.3080.008 | 24.250.14 | 22.510.21 | ||
| S271 | 53.195938 | -27.729589 | 1.178 | 22.1460.022 | 25.170.15 | 22.220.18 | ||
| S273 | 53.196571 | -27.863205 | 1.069 | 22.2520.009 | 24.700.14 | 22.370.19 | ||
| S276 | 53.200741 | -27.882389 | 0.667 | 20.3030.004 | 23.040.22 | 20.390.23 | ||
| S286bbBroad-Line AGN (Cowie et al., 2003; Wirth et al., 2004; Szokoly et al., 2004). | 53.220360 | -27.855505 | 1.227 | 21.8300.009 | 23.220.20 | 22.180.23 | ||
| S293 | 53.237385 | -27.835745 | 1.143 | 21.9090.009 | 26.020.21 | 21.930.19 | ||
| S300 | 53.245888 | -27.861118 | 1.010 | 23.9640.047 | 26.990.45 | 24.030.20 | ||
| ID | eeAll luminosities are in cgs (erg s-1). | ffGas column density in cm-2. | a, ea, efootnotemark: | b, eb, efootnotemark: | c, ec, efootnotemark: | d, ed, efootnotemark: | ggCalculated using from Method 1. | ||
|---|---|---|---|---|---|---|---|---|---|
| N 48 | 44.08 | 23.30 | 1.10 | 2 | 45.25 | 45.24 | 45.25 | 45.90 | |
| N 72 | 42.83 | 22.85 | 0.01 | 2 | 45.19 | 43.99 | 45.02 | 44.40 | |
| N 76 | 44.21 | 23.98 | 0.82 | 3 | 44.95 | 45.36 | 45.05 | 46.05 | |
| N 82 | 42.61 | 22.69 | 0.13 | 3 | 45.07 | 43.77 | 45.25 | 44.14 | |
| N 90 | 43.54 | 23.09 | 0.27 | 1 | 45.28 | 44.70 | 45.34 | 45.25 | |
| N 93 | 42.60 | 21.32 | 0.42 | 4 | 44.09 | 43.76 | 44.72 | 44.13 | |
| N103 | 42.54 | 20.27 | 0.43 | 3 | 44.69 | 43.70 | 45.26 | 44.06 | |
| N110 | 42.77 | 20.81 | 0.29 | 2 | 44.74 | 43.93 | 45.32 | 44.33 | |
| N113 | 43.15 | 21.32 | 0.51 | 3 | 44.58 | 44.31 | 45.02 | 44.79 | |
| N116hhBroad-Line AGN (Cowie et al., 2003; Wirth et al., 2004; Szokoly et al., 2004). | 43.92 | 20.29 | 0.05 | 4 | 45.35 | 45.07 | 45.60 | 45.70 | |
| N127 | 43.52 | 23.52 | 0.74 | 2 | 45.09 | 44.68 | 45.24 | 45.23 | |
| N139 | 43.00 | 21.04 | 0.26 | 2 | 44.70 | 44.16 | 45.25 | 44.60 | |
| N150 | 42.97 | 22.93 | 0.61 | 2 | 44.34 | 44.12 | 44.40 | 44.56 | |
| N158 | 43.09 | 22.91 | 1.45 | 2 | 45.05 | 44.25 | 45.37 | 44.72 | |
| N160 | 43.10 | 23.08 | 0.36 | 4 | 44.83 | 44.25 | 45.25 | 44.72 | |
| N163 | 43.62 | 23.90 | 0.31 | 3 | 45.02 | 44.78 | 45.00 | 45.34 | |
| N164 | 44.49 | 23.61 | 0.47 | 4 | 45.11 | 45.65 | 44.99 | 46.39 | |
| N170 | 42.50 | 22.43 | 0.54 | 3 | 44.44 | 43.66 | 44.76 | 44.01 | |
| N174 | 43.40 | 19.32 | 0.01 | 2 | 45.09 | 44.56 | 45.43 | 45.08 | |
| N177 | 42.59 | 21.74 | 0.38 | 3 | 44.86 | 43.75 | 45.31 | 44.12 | |
| N187 | 42.56 | 23.27 | 0.61 | 4 | 44.74 | 43.72 | 44.99 | 44.08 | |
| N194 | 42.63 | 19.95 | 0.62 | 4 | 43.89 | 43.79 | 44.37 | 44.17 | |
| N201 | 43.10 | 23.69 | 1.02 | 2 | 44.71 | 44.26 | 44.79 | 44.73 | |
| N205 | 43.29 | 21.69 | 0.34 | 4 | 44.92 | 44.45 | 45.04 | 44.96 | |
| N217 | 42.79 | 23.70 | 1.60 | 4 | 44.57 | 43.94 | 45.00 | 44.35 | |
| N222 | 42.79 | 21.35 | 0.25 | 3 | 44.95 | 43.95 | 45.36 | 44.35 | |
| N240 | 44.07 | 22.63 | 0.99 | 2 | 45.22 | 45.23 | 45.41 | 45.89 | |
| N242 | 42.66 | 23.42 | 5.00 | 4 | 44.29 | 43.82 | 44.50 | 44.20 | |
| N261 | 42.55 | 23.49 | 0.52 | 4 | 44.58 | 43.71 | 44.80 | 44.06 | |
| N262 | 42.90 | 20.18 | 1.79 | 1 | 44.21 | 44.06 | 44.74 | 44.49 | |
| N266 | 43.49 | 23.61 | 0.62 | 4 | 44.95 | 44.65 | 44.90 | 45.19 | |
| N278 | 43.00 | 23.29 | 0.80 | 1 | 44.72 | 44.16 | 44.72 | 44.60 | |
| N286 | 42.73 | 21.68 | 1.31 | 2 | 44.34 | 43.89 | 45.10 | 44.28 | |
| N304 | 43.20 | 20.94 | 0.17 | 3 | 44.62 | 44.35 | 45.07 | 44.84 | |
| N309 | 43.04 | 21.30 | 0.88 | 1 | 44.59 | 44.20 | 45.04 | 44.66 | |
| N323hhBroad-Line AGN (Cowie et al., 2003; Wirth et al., 2004; Szokoly et al., 2004). | 43.50 | 21.97 | 0.19 | 4 | 44.90 | 44.66 | 45.18 | 45.21 | |
| N349 | 42.94 | 21.84 | 0.55 | 4 | 44.44 | 44.09 | 44.61 | 44.53 | |
| N352 | 42.73 | 23.13 | 5.00 | 3 | 44.70 | 43.89 | 45.29 | 44.28 | |
| N370 | 43.01 | 20.96 | 0.30 | 4 | 44.65 | 44.17 | 44.95 | 44.62 | |
| N373 | 42.63 | 22.77 | 1.52 | 4 | 44.11 | 43.79 | 44.36 | 44.16 | |
| N384 | 43.64 | 23.39 | 2.38 | 2 | 44.93 | 44.80 | 45.15 | 45.37 | |
| N390 | 44.13 | 22.35 | 1.39 | 1 | 45.66 | 45.29 | 45.59 | 45.96 | |
| N402 | 42.81 | 23.20 | 1.24 | 4 | 44.47 | 43.97 | 44.64 | 44.37 | |
| N405 | 43.24 | 23.41 | 1.40 | 3 | 44.83 | 44.40 | 45.25 | 44.89 | |
| N437 | 42.83 | 21.36 | 0.58 | 4 | 44.62 | 43.99 | 45.31 | 44.40 | |
| N442 | 43.16 | 23.89 | 0.13 | 4 | 44.97 | 44.32 | 44.85 | 44.79 | |
| N448 | 43.47 | 23.16 | 1.39 | 1 | 44.89 | 44.62 | 45.09 | 45.16 | |
| N451hhBroad-Line AGN (Cowie et al., 2003; Wirth et al., 2004; Szokoly et al., 2004). | 43.96 | 21.06 | 0.01 | 3 | 45.53 | 45.11 | 45.53 | 45.75 | |
| N471 | 42.84 | 22.90 | 0.96 | 3 | 44.90 | 44.00 | 45.58 | 44.41 | |
| N473hhBroad-Line AGN (Cowie et al., 2003; Wirth et al., 2004; Szokoly et al., 2004). | 43.28 | 18.23 | 0.13 | 3 | 44.60 | 44.44 | 45.05 | 44.94 | |
| S 44 | 43.38 | 22.87 | 0.77 | 3 | 44.69 | 44.54 | 45.00 | 45.06 | |
| S 84 | 42.72 | 22.42 | 0.98 | 2 | 44.72 | 43.87 | 45.06 | 44.26 | |
| S 88 | 43.49 | 22.42 | 0.50 | 4 | 44.94 | 44.65 | 45.21 | 45.19 | |
| S 91 | 43.08 | 23.57 | 0.68 | 3 | 44.72 | 44.24 | 44.96 | 44.70 | |
| S103hhBroad-Line AGN (Cowie et al., 2003; Wirth et al., 2004; Szokoly et al., 2004). | 42.90 | 19.98 | 0.95 | 2 | 44.35 | 44.06 | 44.92 | 44.48 | |
| S117 | 43.12 | 20.46 | 0.01 | 3 | 44.58 | 44.28 | 44.78 | 44.75 | |
| S118 | 44.23 | 23.30 | 1.31 | 2 | 45.26 | 45.39 | 45.26 | 46.08 | |
| S134 | 43.33 | 23.26 | 0.96 | 2 | 44.52 | 44.48 | 44.47 | 44.99 | |
| S137 | 42.92 | 23.38 | 0.44 | 3 | 44.63 | 44.08 | 44.80 | 44.51 | |
| S139 | 42.84 | 23.71 | 0.10 | 4 | 44.96 | 43.99 | 44.98 | 44.41 | |
| S151 | 42.50 | 21.76 | 1.25 | 2 | 44.53 | 43.66 | 44.99 | 44.01 | |
| S155 | 42.73 | 21.22 | 0.41 | 3 | 44.16 | 43.89 | 44.76 | 44.28 | |
| S156 | 43.28 | 22.65 | 0.43 | 4 | 44.72 | 44.43 | 44.91 | 44.94 | |
| S159 | 43.57 | 21.76 | 1.22 | 1 | 44.63 | 44.73 | 44.75 | 45.29 | |
| S160 | 43.02 | 23.19 | 0.28 | 4 | 44.58 | 44.18 | 44.16 | 44.63 | |
| S161 | 43.19 | 22.86 | 0.47 | 3 | 44.69 | 44.35 | 44.84 | 44.83 | |
| S162 | 42.69 | 22.69 | 0.22 | 4 | 44.55 | 43.85 | 44.49 | 44.24 | |
| S164 | 43.53 | 23.56 | 1.03 | 2 | 45.04 | 44.69 | 45.29 | 45.24 | |
| S171 | 42.55 | 21.32 | 0.53 | 2 | 44.44 | 43.71 | 44.78 | 44.06 | |
| S176 | 43.01 | 22.35 | 0.01 | 3 | 45.01 | 44.16 | 44.87 | 44.61 | |
| S179hhBroad-Line AGN (Cowie et al., 2003; Wirth et al., 2004; Szokoly et al., 2004). | 43.38 | 22.85 | 0.90 | 2 | 44.87 | 44.54 | 44.82 | 45.06 | |
| S184 | 42.86 | 21.16 | 0.01 | 3 | 44.74 | 44.02 | 45.16 | 44.44 | |
| S193hhBroad-Line AGN (Cowie et al., 2003; Wirth et al., 2004; Szokoly et al., 2004). | 43.29 | 21.05 | 0.53 | 2 | 44.90 | 44.45 | 45.18 | 44.95 | |
| S200 | 42.92 | 21.91 | 0.35 | 4 | 44.77 | 44.08 | 44.83 | 44.51 | |
| S203 | 42.75 | 22.81 | 0.44 | 4 | 44.83 | 43.90 | 45.35 | 44.30 | |
| S214 | 43.16 | 21.70 | 0.42 | 3 | 44.68 | 44.32 | 44.81 | 44.80 | |
| S220 | 43.21 | 23.23 | 0.64 | 3 | 44.56 | 44.37 | 44.71 | 44.86 | |
| S227 | 43.32 | 21.46 | 0.49 | 2 | 44.38 | 44.47 | 44.52 | 44.98 | |
| S229 | 42.98 | 20.07 | 0.06 | 2 | 44.36 | 44.14 | 44.53 | 44.58 | |
| S249 | 43.36 | 23.74 | 0.47 | 4 | 44.89 | 44.52 | 44.88 | 45.04 | |
| S263hhBroad-Line AGN (Cowie et al., 2003; Wirth et al., 2004; Szokoly et al., 2004). | 43.47 | 22.77 | 5.00 | 1 | 44.31 | 44.63 | 44.70 | 45.17 | |
| S271 | 43.29 | 23.11 | 0.54 | 2 | 44.97 | 44.45 | 45.04 | 44.96 | |
| S273 | 42.41 | 21.37 | 0.20 | 2 | 44.33 | 43.57 | 44.79 | 43.90 | |
| S276 | 42.65 | 22.65 | 0.01 | 3 | 44.97 | 43.81 | 45.13 | 44.19 | |
| S286hhBroad-Line AGN (Cowie et al., 2003; Wirth et al., 2004; Szokoly et al., 2004). | 43.74 | 20.85 | 0.30 | 2 | 45.27 | 44.89 | 45.29 | 45.48 | |
| S293 | 42.56 | 19.49 | 5.00 | 2 | 44.28 | 43.71 | 45.06 | 44.07 | |
| S300 | 42.74 | 21.50 | 0.66 | 4 | 44.56 | 43.90 | 44.68 | 44.30 |