Propagation of localized surface plasmons in sets of metallic nanocylinders at the exit of subwavelength slits
F.J. Valdivia-Valero1 and M. Nieto-Vesperinas1
1Instituto de Ciencia de Materiales de Madrid,
C.S.I.C., Campus de Cantoblanco
28049 Madrid, Spain
fvaldivia@icmm.csic.es; mnieto@icmm.csic.es
We analyze, by means of numerical simulations, transmission enhancements through subwavelength slits due to the presence of sets of plasmonic nanocylinders, placed near the exit of these apertures. Further, we extend this study to photonic crystals of dipolar plasmonic particles in front of an array of extraordinarily transmitting slits practiced in a metallic slab.
Keywords: (050.1940) Diffraction; (050.1220) Apertures; (050.6624) Subwavelength structures; (160.4236) Nanomaterials; (230.5750) Resonators; (230.7370) Waveguides; (240.6680) Surface plasmons; (250.6715) Switching.
1 Introduction
Localized surface plasmons (LSP) of metal nanoparticles [1], [2], [3], [4] enjoy a potential as elements of nanooptical networks. These resonant modes arise from the excitation of coherent oscillations of conduction-band electrons, localized on the surface of these particles. The strong light coupling leads to its absorption and spatial confinement to a nanometric scale, which results in large local enhancements of electromagnetic field intensities. Ensembles of particle chains have been extensively studied [5]. That provides nanoscale control of the transmission, manipulation and switching of optical signals [6]. In addition, nanoparticles either dielectric [7] or metallic [8] have been studied in microdisks in connection with the mutual perturbation of their resonances, such as counterpropagating whispering gallery mode (WGM) splitting, modification and their monitoring in the cavity, or control of the radiating properties of the nanoparticle by the WGMs of the cavity [9].
A somewhat related phenomenon known as enhanced optical transmission through subwavelength apertures, either alone or forming a grating, [10], [11], [12], [13], [14], has received much attention in connection with its potential application for light concentration, detection and wavefront steering.
These morphology dependent resonances (MDR) also play an important role in photonic crystals (PC). For example, their influence on the crystal bandgap size and position has been studied [15], [16]. In this way, the Mie resonances of the particles forming the PC constitute the light propagation and enhancement vehicle in the upper bands of those so called molecular photonic crystals [17]. On the other hand, as regards metallic PCs, there are certain advantages in fabricating them, like reduced size and weight, easier production methods and lower costs, as well as the fact that low loss metal PCs have been studied [18]. Furthermore, many applications are being developed from these structures, like waveguiding [19], [20], [21], [22], waveguide mode-plasmon coupling [23], light transmission control [24], thermovoltaics and blackbody emission [25], [26], and lensing [27].
In this paper we wish to answer two questions: first, what is the effect of the presence of plasmonic particles in the transmission zone of a subwavelength aperture which is supertransmitting? Do these particles enhance or inhibit this supertransmission?. Second, how does the energy flow of transmitted light by this slit, (or slits), propagate through these sets of particles?. We present a study by means of numerical simulations that show new effects in configurations of plasmonic nanoparticles near the exit of supertransmitting subwavelength slits practiced in a thick slab. Our study is carried out in 2D but the essential features observed as regards enhanced transmission and coupling of resonances and light transport are likewise obtained in 3D [28] [29]. Also, this 2D geometry constitutes a good model with equivalent effective constitutive parameters for microdisks [30], [31]. Furthermore, such a geometry is adequate to deal with structures of long parallel nanocylinders in 2D PCs or metamaterials [32]. We then address localized surface plasmons of metallic nanocylinders [33]. We see the behavior of light concentration and transmitted field enhancement efficiency in this kind of particle sets (which appears maximized when the configuration of the plasmonic set has properties similar to those of a nanoantenna).
Further calculations deal with configurations like linear and bifurcated nanocylinder chains, also addressing the natural step passing from particle chains, placed one close to another, towards a photonic crystal (PC) geometry situated in front of a metallic array of slits. In this way, we design a method of collimation and coupling of light from free space into the particles by placing them close to the slits. These numerical simulations allow to study the effects that arise in the near field as regards extraordinary transmission in the slits and the excitation of LSPs of these metallic particles; and since the calculations are exact, they constitute a reliable design of future experiments that can be performed in either 2D or 3D. In this respect, our calculations indicate that whereas the nanoaperture behaves as a collimator that transmits light into the nanoparticles, the fundamental role as regards enhancement and field concentration, corresponds to the excitation of the particle LSP which couple with the MDRs of the slits. This is thoroughly studied by first displaying the simple configuration of a single plasmonic nanoparticle in front of a nanoaperture, and afterwards extending these observations to more complex sets of these particles, including chains and PCs. We take advantage, both in chains and in PC geometries, of the excitation of dipolar LSPs.
2 Transmission into plasmonic nanoparticles through a nanoslit
2.1 Numerical procedures.
From now on, all refractive indexes under the different wavelengths on use are taken from [34] and [35]. All particles in this study are considered of Silver (), (refractive index at and at ) because of their rich LSP spectrum in the near ultraviolet. However, it should be stressed here that this is done for the sake of illustrating the effects, and that other noble metal material can be chosen. Since the slab is thicker than usual in supertransmission experiments, in order that the slit walls present high reflection and as small as possible skin depth and losses, the metal of the slab is assumed to be Tungsten () (refractive index at and at ). It should be remarked in this connection that, ideally, a quasi-perfect conducting slab would exhibit the most pronounced effects under study, but if experiments are done with thinner slabs these other materials like , or may be employed. The conservation of light polarization is ensured by launching on the aperture linearly polarized light beams of rectangular profile, their widths being that of the simulation window (this one always coincides to the slab width). The direction of propagation of such beams is normally incident to the axis of the infinite cylinders, and their sense is, in all cases, that from the bottom to the top of the window. The wavelengths utilized to visually show the slits as well as the particle - slit configurations have been chosen so as to maximize their light transmission. The distances between all of such particle structures and the plane exit of the slit, optimizing their responses, have been expressed in semi-multiples of the corresponding LSP resonance - to - supertransmission matched wavelength (with the wavelength resolution limited by [35]). Maxwell equations are solved by using a finite element method (FE) (FEMLAB of COMSOL, http://www.comsol.com) [36], [37]. The solution domain is meshed with element growth rate: 1.55, meshing curvature factor: 0.65, approximately; the geometrical resolution parameters consist of 25 points per boundary segment to take into account curved geometries so as to adapt the finite elements to the geometry and optimize the convergence of the solution. The final mesh contains about elements. To solve Helmholtz equation, the UMFPACK direct is employed, the results being displayed in stationary regime of propagation. The boundary conditions of the simulation space are properly set both to keep the calculations from undesired window reflections and to avoid possible geometrical discontinuities. We hence ensure that neither inconsistencies due to properties discontinuities of the objets under study nor possible systematic errors because of the simulation window interfere with the field calculation. We always select p - polarized incident waves to seek extraordinary transmission in this 2D slit (s - polarized waves do not produce such a phenomenon in 2D subwavelength slits) [12], [14], [38]. The results are thus expressed in terms of either the magnetic vector which is along the cylinder OZ - axis, the electric vector and the time average energy flow , these last two being both transversal, namely, in the plane of the images to show next. The incident wave is a tapered rectangular plain wave of unit amplitude in (SI), this value corresponding to . Finally, the nomenclature followed, further on, to classify the LSP resonances of the cylinders will use the subscripts (i, j), i and j standing for their angular i - th and radial j - th orders, respectively.
2.2 One metallic particle in front of a nanoslit
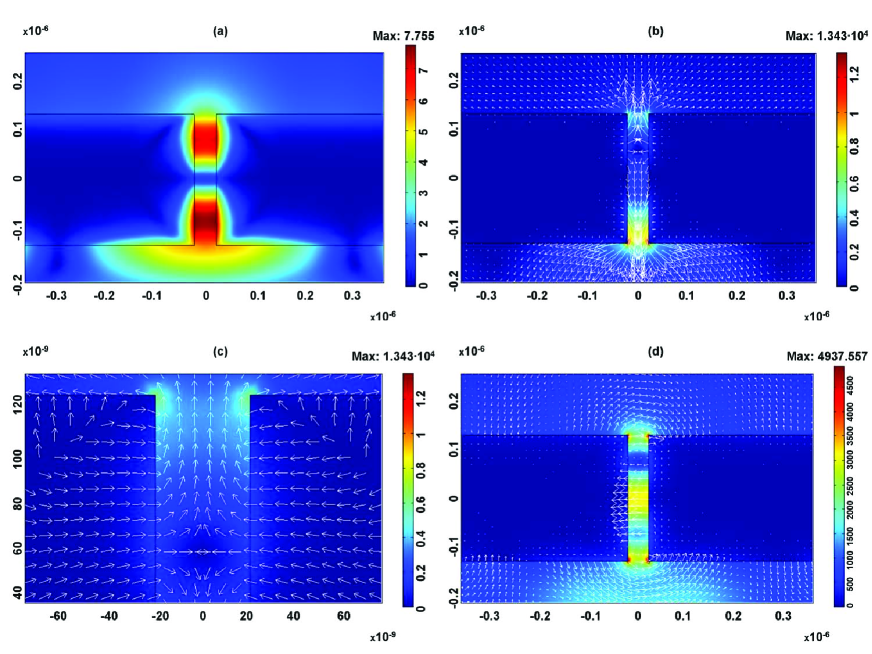
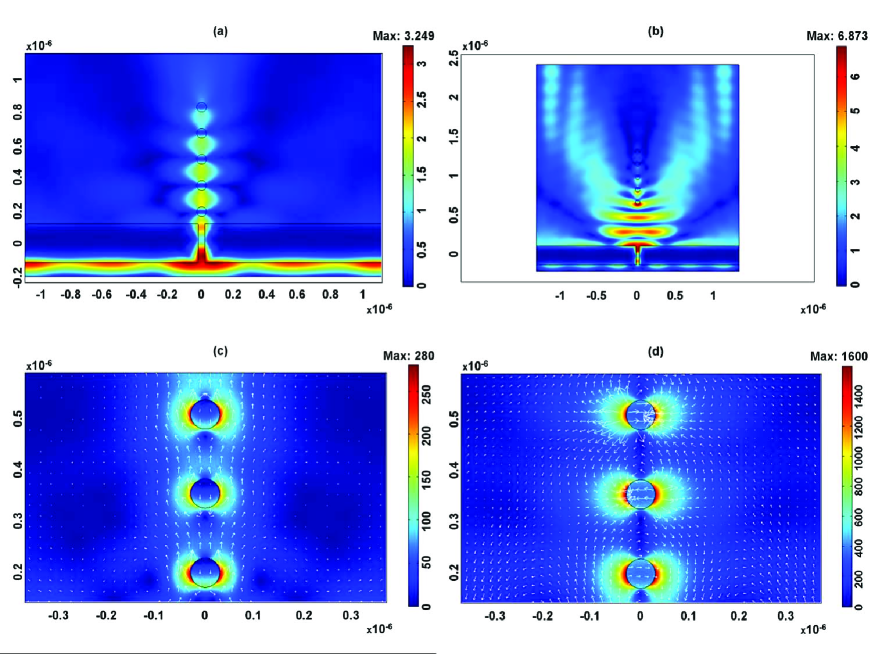
The phenomenon of field transmission enhancement through a subwavelength aperture by excitation of LSP resonances in nearby plasmonic particles, is studied by comparing it with the transmission through a slit alone, practiced in a metallic slab. We chose for the incident wave, where the aperture is supertransmitting. Figure 1(a) as well as Fig. 1(b) show the magnetic field norm and the time averaged energy flow distributions in such a slit, respectively (in all figures, from now on, the p - polarized wave illumination incides upwards). These distributions, which correspond to an incident wavelength at which the slit produces extraordinary transmission, show two interesting features: first, the waveguide p - eigenmode inside the aperture and, second, the change of direction of the energy flow, from the lower region of the aperture at which the energy is partly reflected, to the upper region of the slit where the energy manifests transmission upwards. This sign change is evidenced in Fig. 1(c) by the energy flow as a potential saddle point due to a change of sign of the magnetic field . On the other hand, Fig. 1(d) exhibits the electric field which shows a strong charge concentration, and a resulting a dipolar pattern configuration at the corners of both the entrance and the exit of the slit (see the two upper and lower vertices of the aperture in this figure). Incidentally, we believe that this high intensity concentration at the edges of the aperture exit is responsible for the existence of gradient optical forces on dielectric nanoparticles placed in its proximity, and the corresponding creation of two potential wells, each of them in front of each corner of the aperture exit [cf. Fig. 1(d)], as observed in [39]. Notice in those figures that the supertransmitted intensity by the slit is already seen in the spatial distribution of , and in the neighborhood of the exit of the slit, (we recall that incident , and ).
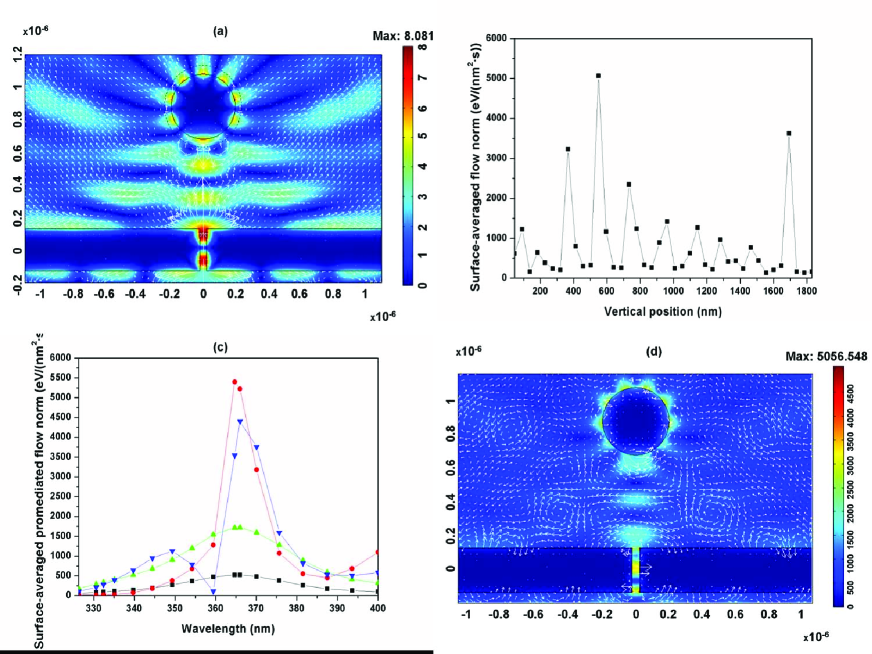
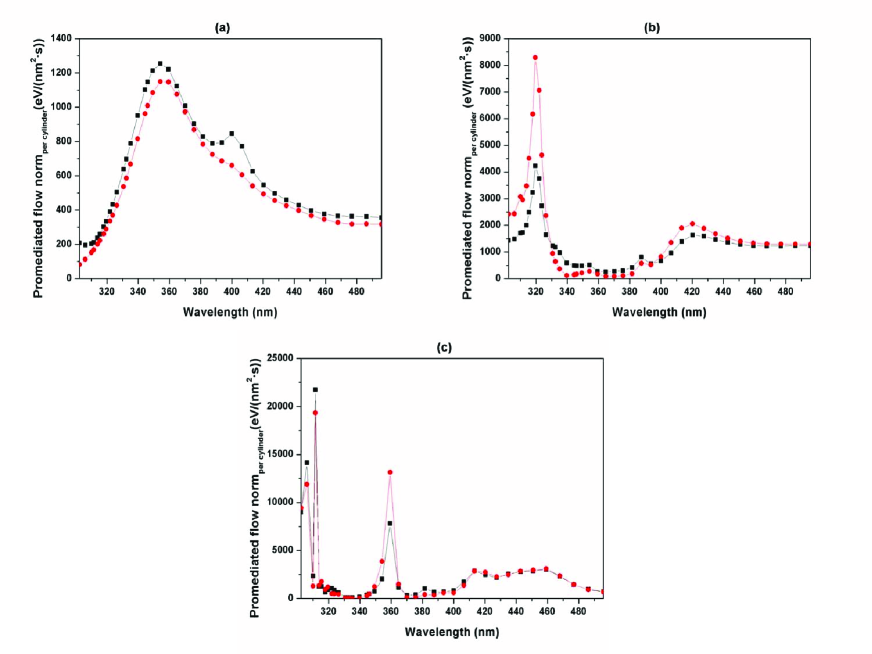
As a first example of the effect placing a plasmonic particle near the aperture exit, Fig. 2(a) deals with an nanocylinder placed in front of the exit of a subwavelength slit in a W slab, which presents a large transmission at the chosen wavelength. As shown, at and at a distance between the cylinder and the slab , a strong intensity enhancement of appears on the cylinder surface, manifested by the LSP stationary interference pattern surrounding it, and a standing wave pattern due to reflections between the slab/aperture and the particle is observed. It should be noticed that this cylinder alone has this mode at which is red - shifted as seen in Figs. 2(a), 2(c) and 2(d) in presence of the slab and aperture. A well - known phenomenon explained on the basis of the driven oscillator model [2]. Also, both vortices and a saddle point are exhibited by in the standing wave pattern between the nanocylinder and the slab. The vertical separation between the cylinder and the slit exit has been chosen in order to optimize this field enhancement. Figure 2(b) shows this field concentration in terms of the energy flow magnitude as the nanocylinder is gradually moved away from the slit at . In order to quantify this, we have averaged this quantity in an annulus surrounding the cylinder, whose internal circle coincides with the cylinder section. The image of Fig. 2(a) corresponds to the third peak of Fig. 2(b) from the left. The spectrum of this enhancement vs the wavelength with the cylinder at , can be seen in Fig. 2(c), which shows a comparison between this enhancement with the cylinder at the aforementioned distance with the one obtained in the same region with the slit alone (red and black curves, respectively), as well as in the region immediately outside the slit exit (blue and green curves). In addition, Fig. 2(d) shows the pattern of for the same configuration as Fig. 2(a). This illustrates the enhancement of the electric field on the particle surface, as well as the interesting vortices described by its wavevector around it due to multiple reflections with the upper surface of the slab. This is in contrast with the case in which the particle is dielectric and the excited MDR is a whispering gallery mode (WGM), in which case the field is mainly confined inside the particle, and exponentially decays outside [40]. In this latter case, the cylinder reflectivity is much lower and the multiple reflections are much weaker. This high reflectivity of the plasmonic cylinder produces not only a high concentration of transmitted energy around its surface, but also outside it. In particular, at the slit exit, (compare Fig. 1(a) and Fig. 2(a)). This is related to a relatively lower reflectivity at the slit entrance, and in fact, already this lower reflectivity constitutes another signature of a larger transmission into the space where the particle is. Hence, this cylinder acts as an extractor of transmittance upon the slit (see Figs. 2(a) and 2(d)).
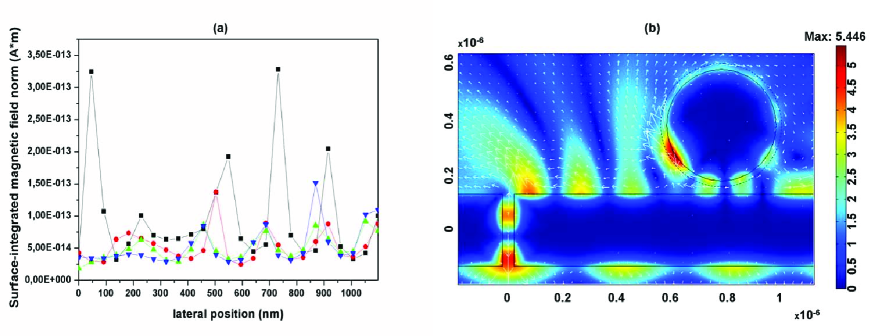
Figure 3(a) shows the behavior of both the magnetic field and the energy flow with a lateral separation of the particle from the slit exit. Now, this asymmetry of its location produces that the standing LSP pattern on the cylinder surface disappears in its upper side, showing the energy circulation around its surface. Also, a standing wave is formed between the aperture and the reflecting cylinder which projects energy into the upper space. Again, the transmittivity of the slit is now much larger than when it is alone.
2.3 Other sets of plasmonic nanocylinders
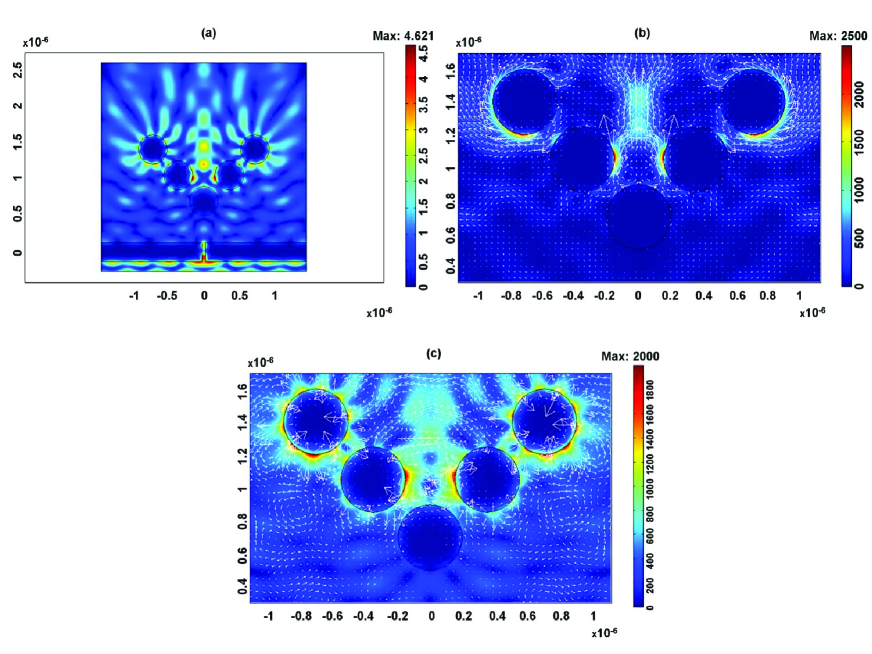
In order to test light transmission and concentration by means of aperture MDR - particle LSP interaction and through adjacent cylinder LSP coupling, Figs. 4(a) - (c) show , and for a bifurcated chain of Ag cylinders near a slit. The distance between the slit and the cylinders has been chosen so as to optimize the extraction of energy by the particles through the aperture. Light transport through the chain up to the upper particles is now obtained as a concentration of energy spread in the region of the four upper cylinders as shown in Figs. 4(a) - (c) with, of course, a lower intensity concentration in the aperture exit zone. (compare in the area inside a rectangular monitor appropriately scaled and equivalent to that shown in Fig. 2(a)) over the slit exit when no particles are present against averaged over the same monitor in the configuration of Figs. 4(a) - (c)). Notice that now, as before, the optimum resonant wavelength for this combined system of particles and slit is again red - shifted with respect to the individual elements (). The field transmission through the particle chains is accomplished by both the propagating waves surrounding the set and a field hopping process between neighbor particles. An appropriate choice of set parameters and illumination, allows one to select the particle of the set with the most enhanced LSP field intensity on its surface.
Chains of smaller size nanocylinders at distance from each other, show dipolar plasmon coupling between neighbors, [see in Figs. 5(a) and 5(b)], both near the exit plane of the slit and at a larger distance from it. A detail of the transmission in the first three cylinders of such a chain can be seen in Figs. 5(c) - (d), where the energy flow and the electric field are shown. The latter quantity exhibits on the surface of each cylinder a typical dipolar LSP distribution, [see Fig. 5(d)]. This transmitted light through the particles does not take place by tunneling, but by a hopping mechanism, like in dielectric molecular photonic crystal rows [17], due to a dipolar interaction (where is the distance between cylinder surfaces) with frequency splitting of the single plasmonic cylinder spectral line, and a redshift of its extinction peak. This coupling diminishes the energy of the ensemble in the bonding state for this configuration (parallel dipoles) [5]. The field confinement along the chain line and between cylinders in the case in which they are close to the slit [cf. Figs. 5(a), (c) and (d)] contrasts with the large diffraction occurring when their distance to the slab is large [cf. Fig. 5(b)], this latter case also showing a strong standing wave below the chain. The energy flow in the area immediately outside the slit exit is reduced with respect to the case of the slit alone in the case of Fig. 5(a) (compare for Fig. 5(a) against for the same slit alone) however, it is enhanced in the case of Fig. 5(b) ( compared with ) for the same slit alone. These numbers were obtained by averaging in a suitable rectangular monitor at the slit exit. Nevertheless, both linear configurations render a good response regarding to the averaged energy flow concentrated around the cylinders. (See the corresponding low reflected energy in Fig. 5(b)). The linear chain near the slit of Fig. 5(a) achieves an averaged of against in the same area when the slit transmits without the cylinders.
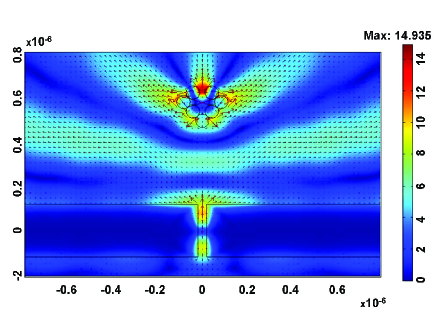
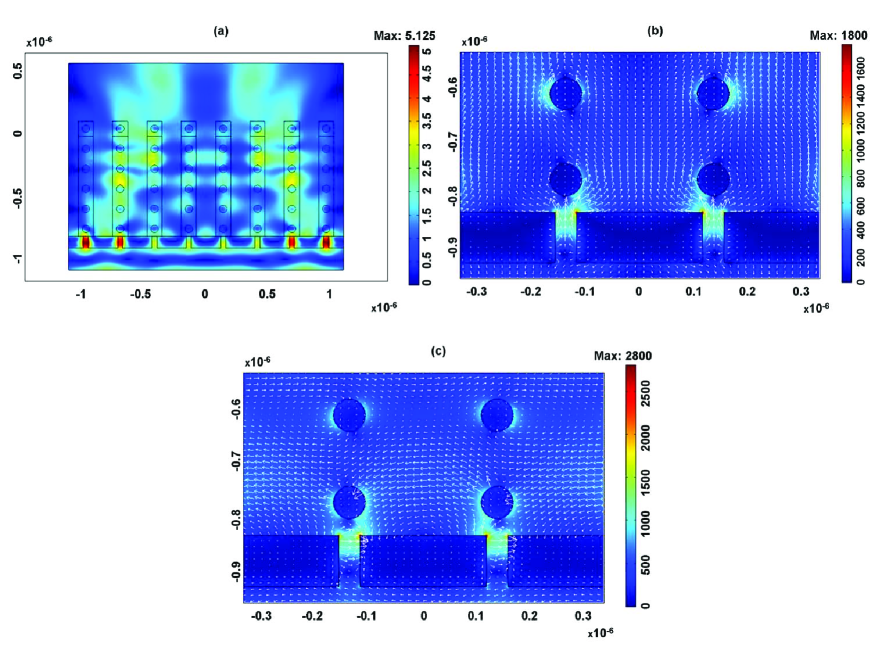
Other distributions considered include those of bifurcations with elbows of nanoparticles at subwavelength distance from each other, as illustrated in Figure 6, which shows ( in color and in arrows. Now the dipolar interaction is of order since it takes place in the near field. The enhancement of transmitted light on top of the set is now quite sharp as the cylinders approach each other (not shown). This set presents the bottom cylinder placed at a distance from the slit that optimizes the energy concentration both on the top particles and at the aperture exit. Most light passes through the aperture and reaches the cylinder set, although the radiation pattern reveals coupling between cylinders and slab. Notice the low value of in the reflection region below the slab in Fig. 6. The standing wave between the slab and the cylinders now embraces the set in one of the maxima, and makes it to strongly emit upwards along three main directions, hence exhibiting a nanoantenna-like behavior. (Radiation directions can be controlled by changing the configuration at the chosen wavelength). Again, this effect is more pronounced with the cylinders at a certain distance from the slit, as shown in Fig. 6, than when they are very close to it. In either case, however, this intensity, strongly transmits even into the aperture exit ( for Fig. 6 against for the same slit alone), (these values obtained by an average over the area of a suitable rectangular monitor at the slit exit, although most energy is now transmitted to the cylinders, and associated with a very small reflection below the slab. This process of transmission up to the top of the set is much more efficient than that of transmission by the excitation of the morphological resonance of the slit alone, which was shown in Fig. 2(c).
2.4 A metallic photonic crystal in front of an array of slits
Aperture supertransmission is further enhanced by periodically repeating it in the slab [10] - [14]. Accordingly, we next arrange chains of metallic particles, each placed in front of a slit of such an array. Introducing some distance between cylinders in each chain, we build in this form a metallic photonic crystal (PC).
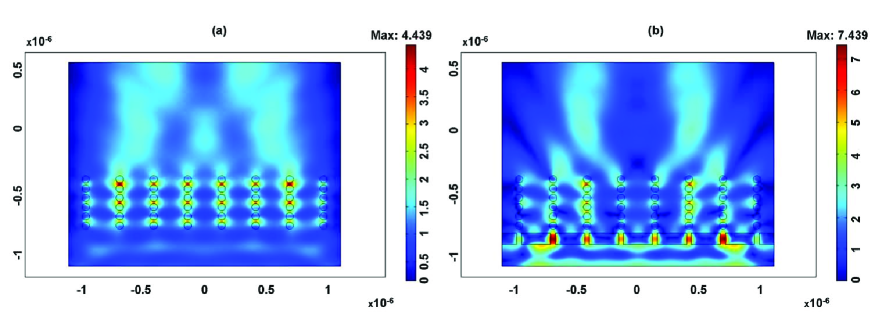
Figures 7(a) and 7(b), corresponding to the PC alone and to the PC in front of the slit array, respectively, show the first step of our approach. At the chosen illumination wavelength the slit grating is supertransmitting and so does the array because this wavelength is both close to a Rayleigh resonance of the slit array and near the of the PC cylinders. As a result, a strong concentration of field in the vertical rows of the PC appears. This is again due to a dipolar interaction between neighbor particles of the same vertical row and between adjacent rows as discussed in connection with Figs. 5(a) - (d). The enhancement of the field is alternating between particle gaps in each row, at difference with the case of a single chain, shown in Figs. 5(a) - (d). The qualitative aspect of the distribution of Figs. 7(a) and 7(b) is similar, except for the collimation effect produced by the slit grating, and the slight weakening of the energy enhancement between particles due to intensity concentration within the slits, shown in Fig. 7(b). These results in Fig. 7(b) contrast with those in which the incident wavelength is out of resonance of the cylinders, then light passes through the PC with scarce interaction with the cylinders (not shown here).
In the second step of our analysis, the distance between cylinders in each vertical chain is incremented to a value comparable to that of the horizontal distance between chains. Figures 8(a) - (c) correspond to the responses of the grating alone, this new PC alone and the combination of both, respectively. Figure 8(b) shows an effective bandgap in the direction of transmission in PC reciprocal space (upwards direction in Figs. 7(a) - (b) and Figs. 9(a) - (c)). Nevertheless, an enhancement of transmission along this direction is achieved in the whole range studied (compare the values of Fig. 8(b) to those of Fig. 8(c)). Furthermore, a transmission peak rises for the PC/grating arrangement, in the range where the gap was for the PC alone (see Figs. 8(c) and 8(b)), the two last effects being due to the presence of the grating. Note the match in wavelength between the transmission peak of the grating alone in Fig. 8(a) and that mentioned above for the combination of PC and grating in Fig. 8(c).
By contrast to Fig. 7(b), when the slit grating is added to this PC, and illumination is out of both the LSP resonance and the PC effective gap, (see Fig. 8(b)), one again observes an enhancement of transmission into the PC, a strong intensity concentration in the slits, and a relatively low reflection below the slab (as example, that shown in Figs. 9(a) - (c)), even though now this reflection is larger, relative to the transmittivity of the slits, than that shown for resonantly excited nanoparticle sets in front of one slit (compare with Figs. 5(a) - (d) and 6). On the other hand, the presence of the slits modifies the gap of the PC which, as shown in Fig. 8(c) has a transmission peak near . This is a new feature of the effect of the slits upon the transmittivity of the PC.
3 Conclusion
We have presented a theoretical and simulation study which shows how the excitation of localized surface plasmons of nanoparticles in front of subwavelength apertures, ( cylinders and slabs have been used) under polarization that excites the aperture propagating modes (p - polarization in 2D), may enhance the transmission. Sets of plasmonic cylinders exhibit coupling and propagation through their elements. There is a specific distance for each of such cylinder - slit configurations that optimizes the transmitted energy passing into the particles. This suggests a control of light transmission via plasmonic particles. Also, we observe that it is possible to fitting particle set parameters and illumination in such a way that the transmitted intensity is concentrated in certain cylinders when the stationary regime of propagation has been reached.
The case of a metallic photonic crystal ( PC) in front of a metallic slit array shows the effects of effective bandgaps on the interparticle LSP transmission, and the enhancement of the transmittivity of the grating due to the excitation of LSPs in the metallic PC. All these results are also expected with 3D particles in front of apertures with any geometry, in particular subwavelength holes, and have a potential for controlling transmitted near fields at the nanoscale.
Acknowledgements
Work supported by the Spanish MEC through FIS2009-13430-C02-C01 and Consolider NanoLight (CSD2007-00046) research grants, FJVV is supported by the last grant.
REFERENCES
- [1] A. V. Zayats, I. I. Smolyaninov and A. A. Maradudin, “Nano-optics of surface plasmon polaritons”, Phys. Rep., 408, 131 - 314 (2005).
- [2] S. E. Sburlan, L. A. Blanco, M. Nieto-Vesperinas, “Plasmon excitations in sets of nanoscale cylinders and spheres, Phys. Rev. B 73, 035403 (2006).
- [3] D. Richards and A. V. Zayats, Eds., Nano-optics and near-field optical microscopy (Artech, Boston, 2008).
- [4] M. Pelton, J. Aizpurua, G. Bryant, “Metal-nanoparticle plasmonics”, Laser & Photon. Rev. 2, 136 - 159 (2008).
- [5] S. A. Maier, Plasmonics: Fundamentals and applications (Springer Science + Business Media LLC, New York, 2007).
- [6] S. A. Maier and H. A. Atwater, “Plasmonics: Localization and guiding of electromagnetic energy in metal/dielectric structures”, J. Appl. Phys. 98, 0111101 (2005).
- [7] K. R. Hiremath and V. N. Astratov, “Perturbation of hispering gallery modes by nanoparticles embedded in microcavities”, Opt. Express 16, 5421 - 5426 (2008).
- [8] S. Elston, “Finite-Difference Time-Domain Simulations of Metallic Nanoparticles in Whispering Gallery Mode Resonators”, Ph.D Thesis, Brown University (2009).
- [9] A. Mazzei, S. Gotzinger, L. de S. Menezes, G. Zumofen, O. Benson, and V. Sandoghdar, “Controlled coupling of counterpropagating whispering-gallery modes by a single Rayleigh scatterer: A classical problem in a quantum optical light”, Phys. Rev. Lett. 99, 173603 (2007).
- [10] T. W. Ebbesen, H. J. Lezec, H. F. Ghaemi, T. Thio, P. A. Wolff, “Extraordinary optical transmission through sub-wavelenght hole arrays”, Nature (London) 391, 667 - 669 (1998).
- [11] F. J. García-Vidal, L. Martín-Moreno, “Transmission and focusing of light in one-dimensional periodically nanostructured metals”, Phys. Rev. B 66, 155412 (2002).
- [12] J. A. Porto, F. J. García-Vidal, J. B. Pendry, “Transmission resonances on metallic gratings with very narrow slits”, Phys. Rev. Lett. 83, 2845 - 2848 (1999).
- [13] H. J. Lezec, T. Thio, “Diffracted evanescent wave model for enhanced and suppressed optical transmission through subwavelenght hole arrays”, Opt. Express 12, 3629 - 3651 (2004).
- [14] N. García, M. Nieto-Vesperinas, “Theory of electromagnetic wave transmission through metallic gratings of subwavelenght slits”, J. Opt. A: Pure Appl. Opt. 9, 490 - 495 (2007).
- [15] E. Lidorikis, M. M. Sigalas, E.N. Economou, C.M. Soukoulis, “ Tight-binding parametrization for photonic band gap materials”, Phys. Rev. Lett. 81, 1405 - 1408 (1998).
- [16] A. Moroz and A. Tip, “Resonance-induced effects in photonic crystals”, J. Phys.: Cond. Matter 11, 2503 - 2512 (1999).
- [17] C. Vanderbem and J.P. Vigneron, “Mie resonances of dielectric spheres in face-centered cubic photonic crystals”. Opt. Soc. Am. A 22, 1042 (2005).
- [18] I. El-Kady, M. M. Sigalas, R. Biswas, K. M. Ho, C. M. Soukoulis, “Metallic photonic crystals at optical wavelengths”, Phys. Rev. B 62, 15299 - 15302 (2000).
- [19] M. Qiu, S. He, “Guided modes in a two-dimensional metallic photonic crystal waveguide”, Phys. Lett. A 266, 425 - 429 (2000).
- [20] Y. Zhao, D. R. Grischkowsky, “2-D Terahertz metallic photonic crystals in parallel-plate waveguides”, IEEE Trans. Microwave Theory Tech.55, 656 - 663 (2007).
- [21] S. Wang, W. Lu, X. Chen, Z. Li, X. Shen, W. Wen, “Two-dimensional photonic crystal at THz frequencies constructed by metal-coated cylinders”, J. Appl. Phys. 93, 9401 - 9403 (2003).
- [22] F. I. Baida, D. van Labeke, Y. Pagani, B. Guizal, M. Al Naboulsi, “Waveguiding through a two-dimensional metallic photonic crystal”, Journal of Microscopy 213, 144 - 148 (2004).
- [23] A. Christ, S. G. Tikhodeev, N. A. Gippius, J. Kuhl, H. Giessen, “Plasmon polaritons in a metallic photonic crystal slab”, phys. stat. sol. (c) 0, 1393 - 1396 (2003).
- [24] G. Veronis, R. W. Dutton, S. Fan, “Metallic photonic crystals with strong broadband absorption at optical frequencies over wide angular range”, J. Appl. Phys.97, 093104, 2005.
- [25] J. G. Fleming, S. Y. Lin, I. El-Kady, R. Biswas, K. M. Ho, “All-metallic three-dimensional photonic crystals with a large infrared bandgap”, Nature (London) 417, 52 - 55 (2002).
- [26] Md M. Hossain, G. Chen, B. Jia, X. Wang, M. Gu, “Optimization of enhanced absorption in 3D-woodpile metallic photonic crystals”, Opt. Express 18, 9048 - 9054 (2010).
- [27] D. Xiao, K. W. Kim, J. M. Zavada, “Imaging properties of a metallic photonic crystal”, J. Appl. Phys. 101, 113105 (2007).
- [28] Z. Chen, A. Taflove, V. Backman, “Photonic nanojet enhancement of backscattering of light by nanoparticles: a poetential novel visible-light ultramicroscopy technique”, Opt. Express 12, 1214 - 1220 (2004).
- [29] H. C. van de Hulst, Light scattering by Small Particles (Dover, New York, 1981).
- [30] M. K. Chin, D. Y. Chu, S. T. Ho, “Estimation of the spontaneous emission factor for microdisk lasers via the approximation of whispering gallery modes”, J. Appl. Phys. 75, 3302 - 3307 (1994).
- [31] S. V. Boriskina, “Theoretical prediction of a dramatic Q-factor enhancement and degeneracy removal of WGM’s in symmetrical photonic molecules”, Opt. Lett. 31, 338 - 340 (2006).
- [32] K. Vynck, D. Felbacq, E. Centeno, A. I. Cibuz, D. Cassagne, and B. Guizal, “Au-dielectric rod-type metamaterials at optical frequencies , Phys. Rev. Lett. 102, 133901 (2009).
- [33] J. R. Arias-González, M. Nieto-Vesperinas, “Near field distributions of resonant modes in small dielectric objects on flat surfaces”, Opt. Lett. 25, 782 - 784 (2000).
- [34] P. B. Johnson and R. W. Christy, “Optical constant of the noble metals”, Phys. Rev. B 6, 4370 - 4383 (1972).
- [35] E. D. Palik, Handbook of optical constants of solids (Academic Press, New York, 1998).
- [36] C. Caloz, C. C. Chang, T. Itoh, “Full-wave verification of the fundamental properties of left-handed materials in waveguide configurations”, Appl. Phys. 90, 5483 - 5486 (2001).
- [37] J. L. García-Pomar and M. Nieto-Vesperinas, “Transmission study of prisms and slabs of lossy negative index media”, Opt. Express 12, 2081 - 2095 (2004).
- [38] N. Garcia and M. Bai, “Theory of transmission of light by subwavelenght cylindrical holes in metallic films”, Opt. Express 14, 10028 - 10042 (2006).
- [39] M. L. Juan, R. Gordon, Y. Pang, F. Eftekhari and R. Quidant, “Self-induced back-action optical trapping of dielectric nanoparticles”, Nature Physics 5, 915 - 919 (2009).
- [40] J. F. Owen, R. K. Chang and P. W. Barber, “Internal electric field distributions of a dielectric cylinder at resonance wavelengths”, Opt. Lett. 6, 540-542 (1981).