The populations of hard X- and -ray sources:
a correlation study and new possible identifications
Abstract
Aims. We present the results of our analysis devoted to the research of sources emitting in the energy bands surveyed by both the Swift-BAT and the Fermi-LAT telescopes.
Methods. We cross-correlate the Fermi-LAT 1-year point source catalogue (1FGL) of gamma-ray sources and the second Palermo BAT catalogue (2PBC) of hard X-ray sources, establishing a correspondence between sources when their error boxes overlap. We also extract the significance value in the BAT 15–150 keV map, obtained using a dedicated software for the reduction of BAT data, in the direction of the 1FGL sources and take into account those above the significance threshold .
Results. We obtain a sample of common sources emitting in both the hard X- and the -ray energy bands and evaluate its content in galactic and extragalactic objects. We assess the fraction of unidentified sources and describe in greater detail the properties of two of them, 1FGL J0137.8+5814 and 1FGL J2056.7+4938, supporting their classification as blazars after the analysis of their broad-band spectral energy distribution. We discuss the blazar content of the collected 1FGL-2PBC sources: we build its redshift distibution and compare it with that of the whole blazar population as reported in the second edition of the BZCAT blazar catalogue.
Key Words.:
galaxies: active - galaxies: BL Lacertae objects - radiation mechanisms: non-thermal1 Introduction
The present generation of space observatories for high energy astrophysics is characterised by large area and wide field instrumentation. This is the case of the Burst Alert Telescope (BAT, Barthelmy et al. (2005)) and Large Area Telescope (LAT, Atwood et al. (2009)) onboard Swift and Fermi-GST, respectively. One of the main throughputs of these instruments is the discovery of a thousand of hard X- and -ray sources and the possibility of performing investigations on the population properties and evolution much more accurate than in the past.
The first catalogue of -ray point sources (1FGL, Abdo et al. 2010a ), based on data obtained in the 11 months after the beginning of scientific operation (2008, August 4) contains 1451 entries, and a fraction of about 40 % of them does not have a reliable counterpart. A rather similar situation is also occurring with the hard X-ray sources detected by BAT: the second Palermo BAT catalogue (Cusumano et al. 2010b , hereafter 2PBC), that covers the observation period from November 2004 to May 2009 and is the richest one in this energy range, also includes 177 not associated sources, over a total number of 1256. A multifrequency approach based on the cross-correlation of catalogues in different energy bands from the radio to the rays can be very usesul, if not essential, to unravel the nature of unidentified sources.
In this paper we use the 1FGL and the 2PBC catalogues to compare the populations of hard X- and -ray sources and to search for possible correspondences between them. The paper is organised as follows: we report the details of the cross-correlation between the two catalogues in Section 2 and of the cross-correlation of the 1FGL catalogue with the BAT 15–150 keV all-sky significance map in Section 3. We discuss our results in Section 4 giving a particular emphasis on the blazar content of the collected group of sources. In Section 5 we describe the properties of two unidentified objects in the 1FGL catalogue, at low Galactic latitude, with a significant emission in the hard X-ray band: we collect all the available data in the literature and analyse in detail their broad band spectral energy distribution (SED) to support their classification as blazars. The main results of our analysis are summarised in Section 6.
2 Correspondences between 1FGL and 2PBC sources
The 2PBC catalogue has been obtained from the reduction of the BAT data collected in 54 months since the launch of the Swift mission using the dedicated software BatImager (Segreto et al. (2010)). It contains 1256 hard X-ray sources detected at a significance level higher than ; their coordinates are given with a 95% confidence level radius . A counterpart was associated to 1079 sources (); for 26 of them a double association was found, and in two cases three possible counterparts were proposed; sources without any associated counterpart are 177.
We match the 2PBC catalogue with the 1FGL catalogue to search for sources emitting in both the energy bands surveyed by the Swift-BAT and the Fermi-LAT telescopes. The positions of the 1451 1FGL -ray sources, determined by means of a maximum likelihood algorithm, are given with an uncertainty ellipse corresponding to the 95% probability of locating the source; 58 objects are reported without any positional uncertainty. We adopt, when available, the mean value of the two axes of the 95% confidence ellipse as the radius of the error circle for a 1FGL source. We calculate the angular distance among the centroids of 1FGL and 2PBC sources and establish a correspondence when the two error circles overlap, adopting the condition : applying this criterion we obtain 77 correspondences. We define a simple parameter to estimate the quality of the correspondence and use the expression , where is the higher value between and . The parameter implies that the wider error circle includes both centroids: this value occurs for 64 correspondences, while in four cases we find . We consider the possibility that the choice of the mean value of the axes of the 95% uncertainty ellipse, adopted to estimate the 1FGL uncertainty region, may be not firmly reliable. This aspect raises particularly in cases of high eccentricity values, in which the orientation of the 1FGL ellipse with respect to the 2PBC circle must be taken into account. In order to gain confidence about the established correspondence between sources we compute the axial ratio of the uncertainty ellipse and verify in the sky-map the 25 cases () in which we find values higher than 1.2. We find that in all but four cases not only the centroid of the 2PBC source, but also the associated counterpart, is inside the 1FGL ellipse.
| type | BZCAT | 1FGL-2PBC | ||||
|---|---|---|---|---|---|---|
| BZB | 1164 (531) | 16 (14) | 24 (19) | |||
| BZQ | 1660 (1638) | 27 | 41 | |||
| BZU | 262 (215) | 7 | 8 | |||
| total | 3086 (2384) | 50 (48) | 73 (68) |
Further correspondences have been established for 9 of the 58 1FGL sources with no positional uncertainty as the position of the 1FGL source is within the error circle of the 2PBC source. The remaining 49 cases are all unambiguously discarded as no 2PBC source is found in the proximity of these 1FGL sources. The final list includes 86 1FGL-2PBC correspondences for a total of 84 1FGL sources: two of them have in fact a possible correspondence with two different 2PBC sources. Moreover, we find also a correspondence in which two possible counterparts, both high mass X-ray binaries, have been associated to the same 2PBC source in the Small Magellanic Cloud. The list of correspondences has been splitted in two parts reported in Table 1 and Table 2 according to the Galactic latitude, with 63 correspondences at and 23 at . For each correspondence we report the 1FGL and 2PBC identifiers, the associated counterparts and their classification. For a few AGNs the counterpart, missing in the 1FGL catalogue, has been found in the first catalogue of active galactic nuclei detected by the Fermi Large Area Telescope (Abdo et al. 2010b ): these cases have been marked with an asterisk (∗) in Table 1. The value of the parameter and the agreement between the corresponding counterparts is reported in the last two columns. We mark with a colon the values of the four correspondences for which the 2PBC counterparts are outside the 1FGL uncertainty ellipse. We find also two cases (marked with “c”) having a possibility of multiple association: this confusion is due to crowded fields, one of them close to the Galactic centre direction. In 62 cases (marked with “y”) the counterpart is the same, while in 12 cases (marked with “n”) the counterparts associated with the high-energy sources are different: in these cases the correspondence is supposed to be due to chance. We find also 13 correspondences for which both sources, or just one of them, lack the associated counterpart. Assuming that the 1FGL-2PBC correspondence is the result of high-energy emission from a single source, this could be considered a hint toward the association of a counterpart to some of these 1FGL sources; all these correspondences, with only one exception, are characterised by a parameter lower than unity.
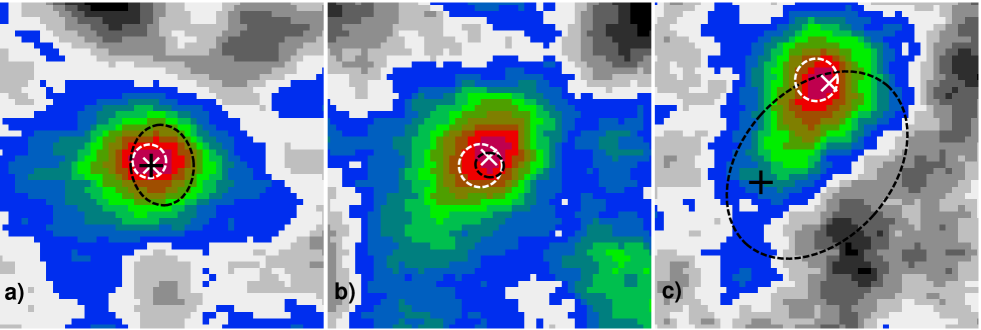
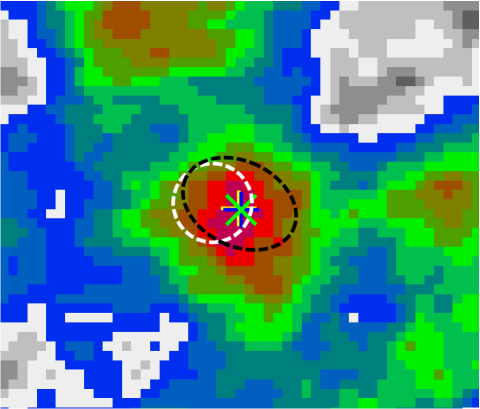
We plot in Fig. 1 the details of the BAT 15–150 keV significance map for some of these correspondences. In the left panel of Fig. 1 we report the case in which the 1FGL and the 2PBC sources correspond to the same object, the BL Lac 1H 1100230. In the middle panel we report the case of the source 1FGL J2056.7+4938 that has not been identified in the 1FGL catalogue: the correspondence with the 2PBC source suggests the X-ray source RXJ2056.6+4940 as possible counterpart. The properties of this source have been investigated in greater detail and discussed in Section 5.2. Finally, in the right panel of Fig. 1 we report the case of a correspondence probably due to chance: two close objects, the galaxy IRAS F023746130 and the flat spectrum radio quasar PKS 0235618, are responsible for the hard X- and the -ray emission, respectively.
We compare our results with those reported in Abdo et al. (2010b, their Table 7) and find that all the 50 sources provided in their list are included in Table 1, with the exception of 1FGL J1938.23957. Hard X-ray emission in this direction was revealed by Integral and reported in the fourth IBIS catalogue (Bird et al. (2010)): the counterpart associated to this 1FGL source, PKS 1933400, is also reported in the BZCAT as a blazar with uncertain classification. The value that we find in the BAT 15–150 keV significance map at the position of PKS 1933400 is compatible with hard X-ray emission from this source, but it is lower than .
3 Correspondences of 1FGL sources with the 54-month hard X-ray maps
The 2PBC catalogue includes sources with a significance threshold . Reasonably, a remarkable number of fainter objects are imaged in the 54-month BAT all-sky maps at a significance level lower than . In the effort of increasing the list of objects emitting both in the BAT and in the LAT energy ranges we consider the adoption of a lower significance threshold. Taking into account the results obtained by Maselli et al. (2010) in the cross-correlation of the BZCAT Blazar Catalogue (Massaro et al. (2009)) with the 39-month 15–150 keV BAT map (Cusumano et al. 2010a ) we adopt . From their analysis, carried out at , Maselli et al. (2010) found that the adoption of follows in a fraction of 3% of related spurious associations; this value is presumably underestimated at due to the higher density of sources.
A total of 1043 and 408 objects are found in the 1FGL catalogue at high () and low Galactic latitude, respectively. We extract the significance value in the 54-month 15-150 keV BAT all-sky map at their positions and find for 80 objects at and 49 objects at . In a few of these objects the value may be strongly biased by some close, very bright hard X-ray sources. Following the same criterion adopted in Maselli et al. (2010), we exclude the 1FGL sources whose position is found within from these bright BAT sources and no overlap, even marginal, is found between the corresponding error regions. After this screening we obtain a sample of 75 () and 29 () 1FGL sources. All the sources listed in Table 1 and Table 2 are included in this sample with nine exceptions, all of them at high Galactic latitude. They concern 1FGL sources for which the 95% confidence ellipse is particularly wide and the 2PBC source is at a considerable distance from the centre of the ellipse. The final list of additional sources with respect to those obtained from the cross-correlation between the 1FGL and 2PBC catalogues has been splitted according to the Galactic latitude and reported in Table 3 and Table 4.
4 Properties of the resulting samples of sources
The firm correspondences that we find cross-correlating the 1FGL and 2PBC catalogues and verifying the agreement between the identified counterparts lead to 62 sources. This number raises to 104 ( of all the 1FGL objects) considering all the sources with a significance down to . Therefore, the number of sources emitting in both the energy ranges covered by the BAT and the LAT instruments aboard Swift and Fermi, respectively, is small. This is a clear indication that the emission in the hard X- and in the -ray sky is dominated by sources with a different nature. This result is not unexpected: among extragalactic sources, the main contribution in the 1FGL catalogue is given by blazars, while in the 2PBC catalogue it is given by Seyfert galaxies. Considering the 1FGL extragalactic sources provided with an association, the blazar contribution is given by 295 BL Lacs and 274 FSRQs: active galaxies with uncertain classification are 92, while non-blazar active galaxies are only 28. Conversely, in the 2PBC catalogue there are 307 Seyfert 1 and 165 Seyfert 2 galaxies. Even if considerable, the blazar contribution (97 objects) is less relevant.
The group of 104 objects that we have collected is made up of 83 extragalactic and 15 galactic sources; 6 objects are unidentified. The largest part of extragalactic sources is given by blazars with only a very few exceptions: the Seyfert 1.2 galaxy ESO 32377, the FR II radiogalaxy 3C 111, the flat spectrum radio source PKS 0336177 and the starburst galaxies M 82 and NGC 4945. At low Galactic latitude we find 6 pulsars (including Crab and Vela), 4 high mass X-ray binaries (including Cyg X-3) and a low mass X-ray binary, the supernova remnant Cas A, two cataclismic variable stars and the peculiar object Eta Carinae. We briefly report on the results obtained considering the lower significance threshold value : we find further 74 sources, the largest fraction of which are blazars (16 BZB, 18 BZQ and 9 BZU), followed by other AGNs (among which the well known FR I radiogalaxy M87) the starburst galaxy NGC 253 and a few pulsars; 14 sources are unidentified. We remark that, according to Maselli et al. (2010), the number of spurious correspondences for such a low significance threshold is .
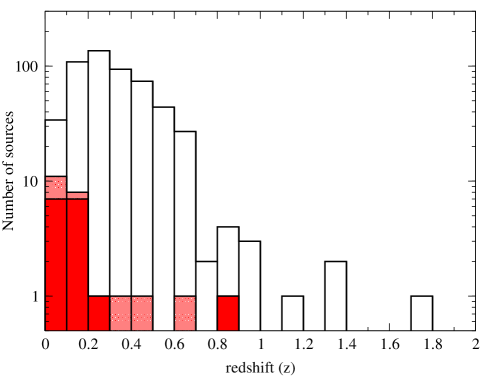
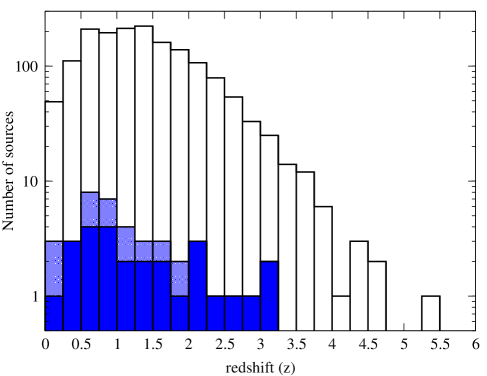
We focus on the blazar content of the 1FGL-2PBC sources and investigate about their distance. We follow the classification of the second edition of the BZCAT catalogue (Massaro et al. (2010)) which includes 1164 BL Lac objects (indicated in the following with the suffix “B”), 1660 flat spectrum radio quasars (suffix “Q”) and 262 blazars with uncertain classification (suffix “U”). The number of BL Lacs without redshift estimate (541) is considerable: moreover, in our computation we consider only firm estimates, for a total of 531 BL Lacs. We compute the mean redshift value of the different classes of 1FGL-2PBC blazars: the value refers to the group of blazars obtained from the cross-correlation of the 1FGL and 2PBC catalogues while refers to the larger group obtained adopting the lower threshold value in the BAT 15–150 significance map. We note that 5 among the 24 BL Lacs detected above do not have any redshift estimate, two of which are included in the 2PBC catalogue. We compare these results with the values which characterise the blazar subclasses as a whole, computed considering the totality of sources classified in the BZCAT: all these values are reported in Table 5. Moreover, we plot in Fig. 2 the histograms of the redshift distributions for BL Lacs (left panel) and flat spectrum radio quasars (right panel) for the considered groups of sources.
Our results show that the subsample of blazars emitting both in the BAT and in the LAT energy bands is made of sources relatively closer than the average to the observer. In fact, is lower than the mean redshift value computed for all the different blazar subclasses, as reported in Table 5. The analysis of the plot in the left panel of Fig. 2 shows that the largest part of BL Lac objects coming from the cross-correlation of 1FGL and 2PBC catalogues has a redshift , while the modal value of the BL Lac distribution is in the range . The addition of sources with significance down to confirms this result: the largest part of them have , with the remaining sources more or less equally distributed at higher redshift up to . An analogous result is true for flat spectrum radio quasars (Fig. 2, right panel): high-energy sources emitting both in the BAT and in the LAT energy bands have redshift , with a peak in the range . The addition of sources with significance down to increments this peak with further 7 sources, and none of them has a redshift higher than . Conversely, the modal value of the distribution of all the FSRQs catalogued in the BZCAT is at higher values than this peak, in the range .
5 New possible associations of sources in the BAT and LAT surveys
The high-energy emission revealed by the BAT and the LAT telescopes is very helpful in addressing a more correct classification of already known sources. Moreover, it can lead to the discovery of new blazars in regions where their identification is complicated by the belt surrounding the Galactic plane intercepting the line of sight towards them. We focus our attention on two 1FGL unidentified sources, 1FGL J0137.8+5814 and 1FGL J2056.7+4938, detected at low Galactic latitude and included in Table 2 and Table 4. For each source we build the spectral energy distribution (SED) by adding the data obtained from our reduction of Swift and XMM-Newton pointed observations to all the data that we have found in the literature.
Swift-XRT observations, carried out using the most sensitive Photon Counting readout mode (see Hill et al. (2004) for a description of readout modes), are available for both 1FGL J0137.8+5814 and 1FGL J2056.7+4938. The highest detected count rate for each source is in any case lower than the pile-up threshold (0.5 cts s-1). We reduce the data with the HEASOFT 6.8 package distributed by the NASA High Energy Astrophysics Archive Research Center (HEASARC). All the files necessary for the spectral analysis are obtained using the xrtpipeline and the xrtproducts tasks. For each source two Swift observations, characterised by very similar values of the count rate, are available: therefore we decide to sum the two event files using the xselect task and the exposure maps to correct for vignetting, CCD hot and damaged pixels. We use the xrtcentroid task to detect the centroid of the source and the corresponding positional error; a nearby source-free region is chosen for the extraction of the background spectrum. Spectral data of sources are extracted in circular regions surrounding the centroid, adopting a radius of 20 pixels (1 pixel = ) for the source spectrum and of 50 pixels for the background spectrum.
A pointed observation from XMM-Newton is available for 1FGL J0137.8+5814: we restrict our analyses of this observation to MOS1 and MOS2, discarding PN data because the source is located at the edge of the instrument FoV. We use the standard analysis software SAS 10.0 to extract high level science products from the ODF files. The source spectrum is extracted by selecting all the events with PATTERN (restricting the patterns to single and doubles) and FLAG within a circle of radius centered on the source. Similarly, the background is extracted collecting all the counts within an annulus, centered on the source, with inner and outer radii of and , respectively. We combine the instrumental channels in the spectral files to include at least 20 counts in each new energy bin for the Swift observation and 25 counts in the case of XMM-Newton; the spectral analysis is carried out using XSPEC 12.5.1n.
The flux density of both sources in the hard X-ray domain (20 keV) has been obtained converting their count rate in the 15–30 keV map of the 54-month BAT survey. The conversion factor is calculated from the count rate of Crab and its spectrum used for calibration purposes, as explained in the BAT calibration status report111http://swift.gsfc.nasa.gov/docs/swift/analysis/bat_digest.html.
The measurements available for these objects at different frequencies are mostly non-simultaneous and their number is not sufficient to allow the possibility of analysing in detail their intrinsic variability at different epochs. We evaluate their general emission properties by selecting opportune energy ranges and, whenever possible, by fitting the corresponding data with analytical models to estimate some relevant parameters. The data in the radio band are well fitted by a power-law model to derive their spectral index . We adopt a log-parabolic model to fit the curvature of energy distribution of the synchrotron and inverse Compton components that characterise the SED of blazars. This model, expressed by the analytical formula
| (1) |
provides the peak frequency of the component and the parameter that describes its curvature at the peak. This law reproduces curved spectra with a small number of parameters and has been verified to fit well the broad band spectra of blazars (Landau et al. (1986), see also Massaro et al. 2004a,b for an interpretation in terms of statistical acceleration).
We note that the Galactic latitude of these sources is very low. For this reason the flux density in the optical band may be severely affected from uncertainties of the Galactic extinction values which are supposed to be not fully reliable. As regards the -ray data, derived from the 1FGL catalogue, we consider the possibility of contamination due not only to the -ray background but also to the occasional presence of neighbour sources in the field as for the case of 1FGL J0137.8+5814, with a pulsar at an angular distance of .
5.1 1FGL J0137.8+5814
We assume from the 1FGL catalogue the position of 1FGL J0137.8+5814 (RA=; Dec=) with an error radius ; the Galactic latitude is .
The analysis of the 54-month BAT significance map shows a considerable hard X-ray emission at this position but no source has been included in the 2PBC catalogue (Cusumano et al. 2010b ) because its detection significance () is below the catalogue threshold . In this case, establishing the position of the source is a delicate task; we report the coordinates of the pixel with the locally higher significance value () that are RA= and Dec=. An hard X-ray detection in this region of the sky by Integral has been first included in the all-sky survey by Krivonos et al. (2007). It is also reported in the 4th IBIS/ISGRI catalogue (Bird et al. (2010)) with RA=, Dec= and with an error radius of , thus shrinking the region for the search of a counterpart to the Fermi -ray source. The variability of this object in the 20-40 keV band has been recently assessed by Telezhinsky et al. (2010): it is still classified as “unidentified” and as a transient source detected at the intrinsic variance map but not at the significance map.
At lower energies, a source in the LAT and IBIS error boxes has been reported in the 1RXS catalogue (Voges et al. (1999)) at RA=, Dec= with an error radius of . Later on, an X-ray observation performed by XMM-Newton on January 16, 2003 and aimed at observing the pulsar PSR 0136+57 has revealed a serendipitous source that has been included in the 2XMMi catalogue (Watson et al. (2009)) with coordinates RA=, Dec= and an error radius of . We analyse this XMM-Newton observation, characterised by a long exposure time = 8439 s, considering the results obtained by the combined analysis of MOS1 and MOS2 detectors. We fit the spectrum with a power-law model and obtain a photon index . The value of the hydrogen column density cm-2 that we obtain leaving this parameter free to vary is very similar to the Galactic one ( cm-2) as reported in the Leiden/Argentine/Bonn (LAB) Survey (Kalberla et al. (2005)). The source flux is erg cm-2 s-1 in the 2–10 keV band and is erg cm-2 s-1 in the 0.2–12 keV band. We note the lower value of the flux erg cm-2 s-1 in the 2–10 keV band reported by Stephen et al. (2010) and attribute it to the different value of the photon index that they adopted in their fit.
Two Swift observations have been recently obtained in this region: the XRT exposure of the first observation (September 4, 2010) is 1153 s, while a longer exposure of 3393 s is available for the second observation (October 22, 2010). Across this period the source has not shown appreciable variations of activity, with a stable count rate around cts s-1. The position of the XRT source is RA= and Dec= with an error radius . We fit the obtained spectrum with a power-law model and find / d.o.f. = 0.96 / 35. As for the XMM-Newton observation, also in this case the obtained value for the hydrogen column density cm-2 can be considered consistent with the Galactic one. The value of the photon spectral index is , while the obtained value for the 2–10 keV flux is erg cm-2 s-1 that is nearly half the value measured by XMM-Newton in 2003.
Possible interesting radio counterparts are in the 87GB and NVSS (Condon et al. (1998)) catalogues (RA=; Dec=) with flux densities of mJy and mJy, respectively, from which we derive a spectral index . The image in the latter survey shows a marginally extended source with a very compact core.
Optical observations (Bikmaev et al. (2008)) aimed at the identification of five Integral sources reported by Krivonos et al. (2007), performed with the Russian-Turkish 1.5-m RTT-150 and the 6-m BTA telescopes, led to the discovery of an object having a continuum without emission or absorption lines, located at RA= and Dec=, fully compatible with the radio and X-ray position and at a separation of from the -ray centroid. Photometric data of the object in the field are available from the Sloan Digital Sky Survey (SDSS-DR8). The morphological classification is that of a starlike source and the magnitudes are mag, mag and mag, with a reddening in the band equal to 1.47 mag. This implies a correction to the colour index of mag and the intrinsic colour index would be 0.7 mag, corresponding to a spectral distribution with a strong excess at blue wavelengths, typical of BL Lac objects.
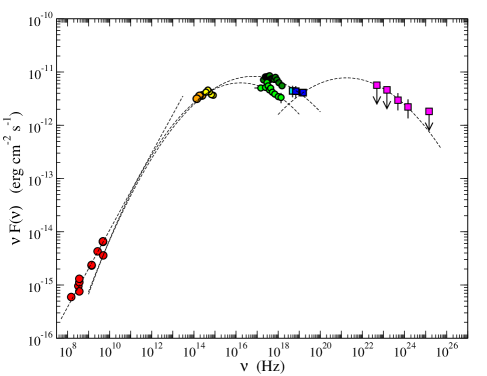
Considering all these available data we obtain the spectral energy distribution of this source shown in Fig. 4. It looks very similar to a SED for a LAT blazar (Abdo et al. 2010c ) with the two broad bumps associated with the synchrotron and inverse Compton emission. We estimate the peak frequency and the curvature parameter of both components fitting a log-parabolic law to the data. The observations of the X-ray telescopes, monitoring the region close to the synchrotron peak in two different epochs, have shown a relevant variability of emission from this source. The results of the log-parabolic fit including Swift data are Hz for the peak frequency with a corresponding maximum of synchrotron emission F() = erg cm-2 s-1; the estimated value of the curvature parameter is . The log-parabolic fit including XMM-Newton data provides a higher value ( Hz) for the synchrotron peak frequency and a corresponding maximum of synchrotron emission F() = erg cm-2 s-1; a very similar curvature () was found also in this case. As regards the inverse Compton component, we obtain Hz with a corresponding F() = erg cm-2 s-1; the curvature parameter is . Both the flux at the peak frequency and the curvature parameter that we derive from our log-parabolic models are therefore very similar for the synchrotron and the inverse Compton components.
A BL Lac classification for this source, first suggested by Bikmaev et al. (2008), has been recently confirmed by Stephen et al. (2010). Following the classification scheme reported in Abdo et al. (2010c) we can conclude from our analysis that this object is an high-energy synchrotron peak (HSP) BL Lac object with a Hz in different detected states of source’s activity.
5.2 1FGL J2056.7+4938
The position of 1FGL J2056.7+4938 (RA=, Dec=, corresponding to the Galactic latitude ), can be assumed with an error radius from the 1FGL catalogue.
In the 2PBC there is the source 2PBC J2056.5+4938 close to this location at RA=, Dec= with an error radius at 95% confidence level. The significance of the detection is 5.5 in the 15–150 keV map and 6.3 in the 15–30 keV map. Earlier than Swift-BAT, a detection in the hard X-ray band in the proximity of 1FGL J2056.7+4938 was obtained by Integral-IBIS. The source, first reported by Krivonos et al. (2007) with the name IGR J20569-4940, was left without classification; the detection was later confirmed by Bird et al. (2010) in their 4th IBIS/ISGRI soft gamma-ray survey catalogue.
The counterpart of this high-energy emission can be searched by shrinking the region of the sky with circles centered at the positions of Fermi-LAT, Swift-BAT and Integral-IBIS centroids with a radius proportional to their errors, respectively. The radio source 4C +49.35, classified as symmetric double in NED, is found within the intersection of these circles. Radio measurements at 1.4 GHz reported in the NVSS catalogue (Condon et al. (1998)) resolve two components separated by : a North-East component (RA=, Dec=) with a flux density mJy and a South-West component (RA=, Dec=) with mJy.
A soft X-ray emission was detected in this region for the first time by the Ariel V satellite and reported by Warwick et al. (1981) with the name 3A 2056+493. Later detections by ROSAT and, more recently, by Swift and XMM-Newton are characterised by adequate precision to associate the soft X-ray emission with the NE component. Two detections from XMM-Newton have been reported in the slew survey clean source catalogue (Saxton et al. (2008)). Their positions are very similar and separated by from each other: RA=, Dec= for the first one and RA=; Dec= for the second one; the error on the position is at 1 confidence. Despite the two slews were carried out along the same day (November 03, 2007) flux variations in the 0.2–12 keV band have been reported in the catalogue, dropping from () to () erg cm-2 s-1 in a few hours.
Two soft X-ray pointed observations have been performed by Swift on February 26, 2009 and March 03, 2009; the first one has a much longer exposure (8377 s) than the other (1439 s). We stack the two observations and obtain RA=; Dec= for the position of the X-ray detection, with a precision of . We carry out a spectral analysis adopting a power-law model: leaving all the parameters free to vary we obtain cm-2, and / d.o.f. = 0.94 / 97; the 2–10 keV flux is erg cm-2 s-1.
We note that, at variance with our result, Landi et al. (2010) report a value of the hydrogen column density cm-2 lower than the Galactic contribution ( cm-2) quoted in the LAB Survey (Kalberla et al. (2005)). We repeat the fit fixing the parameter to the Galactic one but we find a not acceptable variation in the value ( / d.o.f. = 1.61 / 96). A broad band spectral fit of data from radio to the X-rays with a log-parabola provides a curvature parameter (Fig. 5). Therefore we repeat the fit of the X-ray spectrum with a log-parabolic model fixing = 0.07 and also the hydrogen column density at a value ( cm-2) moderately higher with respect to the Galactic one: in this way we obtain the acceptable result / d.o.f. = 1.14 / 94.
The association between the radio and the soft X-ray emission can be considered firmly established by the short distance between the Swift and the XMM-Newton centroids on the one hand and the NE component of 4C +49.35 on the other hand. These are very close to the bright star SAO 50269 (RA=; Dec=; mag in USNO-B1, Monet et al. (2003)). The UVOT image in the UV-W2 filter does not show evidence of sources in proximity of the star, for which we obtain a magnitude mag. Both images acquired in the U filter are saturated in correspondence to the star. In a study of the low latitude sample area in Cygnus of the ROSAT galactic plane survey, Motch et al. (1997) associated the X-ray source RX J2056.6+4940 with SAO 50269 with a probability for a random association of about 10%. The distance between the X-ray and the star position is within the estimated ROSAT accuracy that is . The origin of the X-ray emission was related to an active corona surrounding this star, as for the 85% of sources with a PSPC count rate higher than cts s-1 belonging to their sample. Recently, Haakonsen & Rutledge (2009) reported a low probability of association between 1RXS J205644.3+494011 and the star in their statistical cross-association of the ROSAT Bright Source Catalogue (Voges et al. (1999)) and the 2MASS Point Source Catalogue (Cutri et al. (2003)). As reported by Landi et al. (2010) the counterpart of this high-energy source is, with high probability, an object located at RA= and Dec= at only from SAO 50269. It has been detected in the 2MASS infrared images retrieved from the NASA/IPAC infrared Science Archive. The magnitude in the J filter is 13.69 mag and is uncertain, whereas in the H and K filters they are mag and mag, respectively. The emission of this object in the optical as well as in the UV band is most likely overwhelmed by that originating from the star. This source is separated from the -ray centroid by .
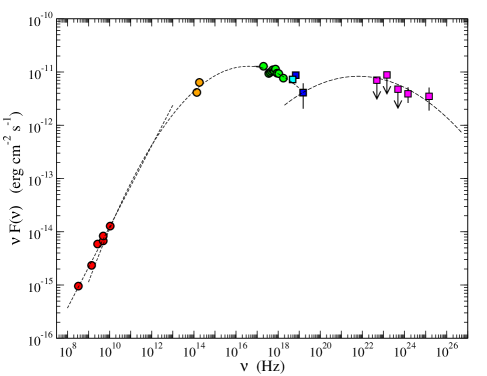
Paredes et al. (2002) cited the ROSAT source 1RXS J205644.3+494011 in a search for microquasar candidates at low galactic latitudes obtained by means of a cross-identification between the ROSAT bright source catalogue (RBSC, Voges et al. (1999)) and the NVSS catalogue. These authors gave a priority to sources for which the offset between the X-ray and the radio position was within the 1 RBSC position error: unfortunately, this was not the case for 1RXS J205644.3+494011. Recently, the hypothesis that the nature of this source might be extragalactic was taken into account by several authors (Landi et al. (2010); Voss&Ajello (2010); Stephen et al. (2010)). We collect for the first time all the available data in literature to build the SED of this object, that is reported in Fig. 5, to investigate the broad-band emission properties of 1FGL J2056.7+4938.
We exclude the radio measurements reported by surveys with a low resolution to avoid the risk of including a spurious contribution from the SW component of 4C +49.35. We estimate a radio spectral index from the fit of data up to 22 GHz (Petrov et al. (2007)): this value of is indeed typical of flat spectrum radio sources. An evaluation of correct fluxes both at optical and at infrared wavelengths is difficult not only for the near star but also for the high value of the reddening mag (Schlegel et al. (1998)), that may be uncertain for such a low value of the Galactic latitude. We fit with a log-parabola the data from radio to X-ray frequencies and obtain the peak frequency Hz, the corresponding maximum of synchrotron emission F() = erg cm-2 s-1 and the curvature parameter . In carrying out our fit we force the log-parabola profile to agree with the power-law fit to the radio data and assume mag, consistently lower than the value quoted by Schlegel et al. (1998); the uncertain infrared measurement in the J filter has been omitted. We also carry out a fit of high-energy data from the hard X- to the -ray band and obtain Hz with a corresponding F() = erg cm-2 s-1 and a curvature parameter .
More precise measurements are requested to characterise both emission components of this source. Nevertheless, the analysis of its broad-band properties such as the radio spectral index, the low Compton dominance and the synchrotron peak frequency higher than Hz support for 1FGL J2056.7+4938 the classification as a blazar and in particular as a HSP BL Lac object, but only the analysis of the optical spectrum can confirm this interpretation.
6 Conclusions
We have reported the results of our analysis devoted to the research of the sources showing high-energy emission in both the Swift-BAT and the Fermi-LAT telescopes, according to the data collected by LAT across the first 11 months of operation and by BAT across a much longer period of 54 months. As expected, we have found a low number of sources: only 7% of those included in the 1FGL catalogue are characterised by a significant emission () as shown by the 54-month BAT 15-150 keV map. The larger fraction of them is given by extragalactic objects, and the dominant part is represented by blazars. We have investigated with greater detail their redshift distribution making a distinction among its subclasses: the comparison with the distribution of the whole population classified in the second edition of the BZCAT catalogue shows that they are mainly closer than the average to the observer.
Driven by the detection from both the BAT and the LAT instruments we have focused on a couple of objects with a very low Galactic latitude. Our detailed analysis of their broad-band spectral energy distribution supports the classification of these objects as blazars, and in particular as high synchrotron peaked (HSP) BL Lac Objects. Analyses of the same kind can be carried out with success on other sources that are expected in the forthcoming future with the release of the second Fermi-LAT point source catalogue, based on two years of -ray data, and also a new Palermo BAT catalogue obtained from the analysis of six years of BAT data.
Acknowledgements.
The authors are grateful to the referee for the suggestions and comments that helped to improve the manuscript. They acknowledge financial support by ASI/INAF through contract I/011/07/0. Part of this work is based on archival data, software or on-line services provided by the ASI Science Data Center (ASDC) and by the SIMBAD database which is operated at CDS, Strasbourg, France.References
- (1) Abdo, A.A., Ackermann, M., Ajello, M. et al., 2010a, ApJS 188, 405
- (2) Abdo, A.A., Ackermann, M., Ajello, M. et al., 2010b, ApJ 715, 429
- (3) Abdo, A.A., Ackermann, M., Agudo, I. et al., 2010c, ApJ 716, 30
- Atwood et al. (2009) Atwood, W.B., Abdo, A.A., Ackermann, M. et al., 2009, ApJ 697, 1071
- Barthelmy et al. (2005) Barthelmy, S.D., Barbier, L.M., Cummings, J.R. et al., 2005, Space Science Reviews 120, 143
- Bikmaev et al. (2008) Bikmaev, I.F., Burenin, R.A., Revnivtsev, M.G. et al. 2008, Astronomy Letters 34, 653
- Bird et al. (2010) Bird, A.J., Bazzano, A., Bassani, L. et al., 2010, ApJS 186, 1
- Condon et al. (1998) Condon, J.J,; Cotton, W.D,; Greisen, E.W. et al., 1998, AJ 115, 1693
- (9) Cusumano, G., La Parola, V., Segreto, A. et al., 2010a, A&A 510, 48
- (10) Cusumano, G., La Parola, V., Segreto, A. et al., 2010b, A&A 524A, 64
- Cutri et al. (2003) Cutri, R.M., Skrutskie, M.F., Van Dyk, S. et al. 2003, IPAC/California Institute of Technology
- Haakonsen & Rutledge (2009) Haakonsen, C.B. and Rutledge, R.E., 2009, ApJSS, 184, 138
- Hill et al. (2004) Hill, J. E., Burrows, D. N., Nousek, J. A. et al., 2004, Proc. SPIE, 5165, 217
- Kalberla et al. (2005) Kalberla, P. M. W., Burton, W. B., Hartmann, Dap et al., 2005, A&A 440, 775
- Krivonos et al. (2007) Krivonos, R,; Revnivtsev, M., Lutovinov, A. et al., 2007, A&A 475, 775
- Landau et al. (1986) Landau, R., Golisch, B., Jones, T.J. et al., 1986, ApJ, 308, 78
- Landi et al. (2010) Landi, R., Bassani, L., Malizia, A., et al., 2010 MNRAS 403, 945
- Maselli et al. (2010) Maselli, A., Cusumano, G., Massaro, E. et al., 2010, A&A 520, A47
- (19) Massaro, E., Perri, M., Giommi, P., Nesci, R., 2004a, A&A, 413, 489
- (20) Massaro, E., Perri, M., Giommi, P. et al., 2004b, A&A, 422, 103
- Massaro et al. (2009) Massaro, E., Giommi, P., Leto, C. et al., 2009, A&A 495, 691
- Massaro et al. (2010) Massaro, E., Giommi, P., Leto, C. et al., 2010, arXiv:1006.0922
- Monet et al. (2003) Monet, D.G., Levine, S.E., Canzian, B. et al., 2003, AJ 125, 984
- Motch et al. (1997) Motch, C., Guillout, P., Haberl, F. et al., 1997, A&A 318, 111
- Paredes et al. (2002) Paredes, J.M., Ribó, M., Martí, J., 2002, A&A 394, 193
- Petrov et al. (2007) Petrov, L., Hirota, T., Honma, M., et al., 2007, AJ 133, 2487
- Saxton et al. (2008) Saxton, R.D., Read, A.M., Esquej, P., et al., 2008 A&A 480, 611
- Schlegel et al. (1998) Schlegel, D.J., Finkbeiner, D.P, Davis, M., 1998 ApJ 500, 525
- Segreto et al. (2010) Segreto, A., Cusumano, G., Ferrigno, C. et al., 2010, A&A 510, 47
- Stephen et al. (2010) Stephen, J.B., Bassani, L., Landi, R. et al., 2010, MNRAS 408, 422
- Telezhinsky et al. (2010) Telezhinsky, I., Eckert, D., Savchenko, V. et al., 2010, A&A 522, 68
- Voges et al. (1999) Voges, W., Aschenbach, B., Boller, T. et al., 1999, A&A 349, 389
- Voss & Ajello (2010) Voss, R. and Ajello, M., 2010, ApJ 721, 1843
- Watson et al. (2009) Watson, M.G.; Schröder, A.C.; Fyfe,D. et al. 2009, A&A 493, 339
- Warwick et al. (1981) Warwick, R.S., Marshall, N., Fraser, G.W. et al. 1981, MNRAS 197, 865
| 1FGL source | 1FGL counterpart | type | 2PBC source | 2PBC counterpart | type | code | |
|---|---|---|---|---|---|---|---|
| 1FGL J0101.37257 | SMC | gal | 2PBC J0102.77241 | XTE J0103728 | HXB | 0.86 | n |
| RX J0104.17244 | HXB | 0.86 | n | ||||
| 1FGL J0217.8+7353 | 1ES 0212+735 | bzq | 2PBC J0217.4+7349 | 1ES 0212+735 | BZQ | 0.47 | y |
| 1FGL J0238.36132 | PKS 0235618 | bzq | 2PBC J0238.36116 | IRAS F023746130 | G | 0.94 | n |
| 1FGL J0242.7+0007 | RXJ0241.9+0009 (∗) | unk | 2PBC J0242.70000 | NGC 1068 | Sy2 | 0.88 | n |
| 1FGL J0319.7+4130 | NGC 1275 | agn | 2PBC J0319.7+4129 | NGC 1275 | BZU | 0.41 | y |
| 1FGL J0325.0+3403 | B2 0321+33B | agn | 2PBC J0324.7+3409 | 1H 0323+342 | Sy1 | 0.46 | y |
| 1FGL J0334.2+3233 | NRAO 140 (∗) | bzq | 2PBC J0336.5+3219 | NRAO 140 | BZQ | 1.27: | y |
| 1FGL J0339.11734 | PKS 0336177 | agn | 2PBC J0339.21742 | 1RXS J033913.4173553 | X | 1.49 | y |
| 1FGL J0405.61309 | PKS 040313 | bzq | 2PBC J0405.61308 | RX J0405.51308 | BZQ | 0.43 | y |
| 1FGL J0437.24715 | PSR J04374715 | PSR | 2PBC J0437.84713 | RBS 0560 | Sy1 | — | n |
| 1FGL J0440.6+2748 | B2 0437+27B | bzb | 2PBC J0440.8+2739 | 1RXS J044046.9+273948 | X | 1.38: | n |
| 1FGL J0522.83632 | PKS 052136 | bzb | 2PBC J0523.03626 | RBS 0644 | BZU | 1.01 | y |
| 1FGL J0531.0+1331 | PKS 0528+134 | bzq | 2PBC J0530.9+1333 | PKS 0528+134 | BZQ | 0.52 | y |
| 1FGL J0538.84404 | PKS 0537441 | bzb | 2PBC J0538.94406 | PKS 0537441 | BZB | 0.46 | y |
| 1FGL J0539.12847 | PKS 0537286 | bzq | 2PBC J0539.82839 | PKS 0537286 | BZQ | 0.56 | y |
| 1FGL J0557.63831 | CRATES J05583838 | bzb | 2PBC J0558.03821 | H 0557385 | Sy1 | 1.21 | n |
| 1FGL J0636.17521 | PKS 063775 | bzq | 2PBC J0635.47514 | PKS 0637752 | BZQ | 0.80 | y |
| 1FGL J0710.6+5911 | BZB J0710+5908 | bzb | 2PBC J0710.2+5909 | 1H 0658+595 | BZB | 0.58 | y |
| 1FGL J0746.6+2548 | B2 0743+25 | bzq | 2PBC J0746.4+2548 | 87GB 074322.5+255639 | BZQ | 0.31 | y |
| 1FGL J0750.6+1235 | PKS 0748+126 | bzq | 2PBC J0750.6+1231 | OI +280 | BZQ | 0.43 | y |
| 1FGL J0806.2+6148 | CGRaBS J0805+6144 | bzq | 2PBC J0805.4+6146 | GB6 J0805+6144 | BZQ | 0.87 | y |
| 1FGL J0842.2+7054 | 4C +71.07 | bzq | 2PBC J0841.4+7053 | S5 0836+71 | BZQ | 0.37 | y |
| 1FGL J0929.4+5000 | CGRaBS J0929+5013 (∗) | bzb | 2PBC J0928.5+4959 | — | — | 0.96 | - |
| 2PBC J0930.6+4954 | RBS 0782 | BZB | 1.29: | n | |||
| 1FGL J0949.0+0021 | CGRaBS J0948+0022 | agn | 2PBC J0948.9+0021 | RX J0948.8+0022 | BZQ | 0.27 | y |
| 1FGL J0956.5+6938 | M 82 | sbg | 2PBC J0955.7+6941 | M 82 | IG | 0.64 | y |
| 1FGL J1048.7+8054 | CGRaBS J1044+8054 | bzq | 2PBC J1044.1+8054 | S5 1039+81 | BZQ | 1.07 | y |
| 1FGL J1103.72329 | CRATES J11032329 | bzb | 2PBC J1103.62329 | 1H 1100230 | BZB | 0.37 | y |
| 1FGL J1104.4+3812 | Mkn 421 | bzb | 2PBC J1104.4+3813 | Mrk 421 | BZB | 0.41 | y |
| 1FGL J1130.21447 | PKS 112714 | bzq | 2PBC J1130.11449 | OM 146 | BZQ | 0.37 | y |
| 1FGL J1136.2+6739 | BZB J1136+6737 | bzb | 2PBC J1137.2+6735 | RBS 1004 | BZB | 0.18 | y |
| 1FGL J1221.3+3008 | B2 1218+30 | bzb | 2PBC J1221.3+3008 | 1RXS J122121.7+301041 | BZB | 0.12 | y |
| 1FGL J1222.5+0415 | 4C +04.42 | bzq | 2PBC J1222.3+0415 | 4C 04.42 | BZQ | 0.62 | y |
| 1FGL J1224.7+2121 | 4C +21.35 | bzq | 2PBC J1224.8+2122 | 4C +21.35 | BZQ | 0.40 | y |
| 1FGL J1227.94852 | — | — | 2PBC J1228.04854 | XSS J122704859 | CV* | 0.22 | - |
| 1FGL J1229.1+0203 | 3C 273 | bzq | 2PBC J1229.1+0202 | 3C 273 | BZQ | 0.25 | y |
| 1FGL J1256.20547 | 3C 279 | BZQ | 2PBC J1256.10547 | 3C 279 | BZQ | 0.37 | y |
| 1FGL J1305.44928 | NGC 4945 | agn | 2PBC J1305.44928 | NGC 4945 | Sy2 | 0.10 | y |
| 1FGL J1307.04030 | ESO 32377 (∗) | agn | 2PBC J1306.54025 | ESO 32377 | Sy2 | 0.74 | y |
| 1FGL J1320.14007 | — | — | 2PBC J1320.24014 | — | — | 0.72 | - |
| 1FGL J1325.64300 | Cen A | agn | 2PBC J1325.44301 | Cen A | BZU | 0.61 | y |
| 1FGL J1331.90506 | PKS 1329049 | bzq | 2PBC J1332.00510 | PKS 1329049 | BZQ | 0.91 | y |
| 1FGL J1417.8+2541 | 2E 1415+2557 | bzb | 2PBC J1417.9+2543 | 7C 1415+2556 | BZB | 0.37 | y |
| 1FGL J1428.7+4239 | 1ES 1426+428 | bzb | 2PBC J1428.6+4239 | H 1426+428 | BZB | 0.58 | y |
| 1FGL J1442.8+1158 | 1ES 1440+122 | bzb | 2PBC J1442.8+1202 | RBS 1420 | BZB | 0.90 | y |
| 1FGL J1512.80906 | PKS 151008 | BZQ | 2PBC J1512.80906 | PKS 151008 | BZQ | 0.42 | y |
| 1FGL J1517.82423 | AP Lib | bzb | 2PBC J1517.72419 | Ap Lib | BZB | 0.20 | y |
| 1FGL J1555.7+1111 | PG 1553+113 | bzb | 2PBC J1555.5+1109 | PG 1553+113 | BZB | 0.73 | y |
| 1FGL J1626.22956 | PKS 162229 | bzq | 2PBC J1626.02952 | PKS 162229 | BZU | 0.85 | y |
| 1FGL J1642.5+3947 | 3C 345 (∗) | bzq | 2PBC J1643.0+3951 | 4C 39.48 | BZQ | 1.52 | y |
| 1FGL source | 1FGL counterpart | type | 2PBC source | 2PBC counterpart | type | code | |
|---|---|---|---|---|---|---|---|
| 1FGL J1653.9+3945 | Mkn 501 | bzb | 2PBC J1653.8+3945 | Mrk 501 | BZB | 1.16 | y |
| 1FGL J1829.8+4845 | 3C 380 | agn | 2PBC J1829.6+4845 | 3C 380 | BZU | 0.24 | y |
| 1FGL J1835.33255 | NGC 6652 | glc | 2PBC J1835.73259 | XB 1832330 | LXB | 0.80 | n |
| 1FGL J1925.22919 | PKS B1921293 | bzq | 2PBC J1924.42913 | OV 236 | BZQ | 1.47 | y |
| 1FGL J2000.0+6508 | 1ES 1959+650 | bzb | 2PBC J1959.8+6509 | 1ES 1959+650 | BZB | 1.10 | y |
| 1FGL J2011.42903 | — | — | 2PBC J2010.82910 | — | — | 1.71 | - |
| 1FGL J2148.5+0654 | 4C +06.69 | bzq | 2PBC J2148.0+0657 | 4C +06.69 | BZQ | 0.41 | y |
| 1FGL J2202.8+4216 | BL Lac | bzb | 2PBC J2202.7+4217 | BL Lac | BZB | 0.24 | y |
| 1FGL J2229.70832 | PKS 222708 | bzq | 2PBC J2229.60831 | PKS 222708 | BZQ | 0.65 | y |
| 1FGL J2232.5+1144 | CTA 102 | bzq | 2PBC J2232.4+1144 | 4C +11.69 | BZQ | 0.11 | y |
| 1FGL J2253.9+1608 | 3C 454.3 | BZQ | 2PBC J2253.9+1609 | 3C 454.3 | BZQ | 0.46 | y |
| 1FGL J2327.7+0943 | PKS 2325+093 | bzq | 2PBC J2327.4+0939 | PKS J2327+0940 | BZQ | 1.22 | y |
| 1FGL J2359.03035 | 1H 2351315 | bzb | 2PBC J2359.13035 | H 2356309 | BZB | 0.28 | y |
| 1FGL source | 1FGL counterpart | type | 2PBC source | 2PBC counterpart | type | code | |
|---|---|---|---|---|---|---|---|
| 1FGL J0035.9+5951 | 1ES 0033+595 | bzb | 2PBC J0035.8+5951 | 1ES 0033+59.5 | BZB | 0.49 | y |
| 1FGL J0240.5+6113 | LS I+61 303 | HXB | 2PBC J0240.6+6114 | GT 0236+610 | HXB | — | y |
| 1FGL J0419.0+3811 | 3C 111 | agn | 2PBC J0418.3+3801 | 3C 111 | Sy1 | 0.86 | y |
| 1FGL J0534.5+2200 | PSR J0534+2200 | PSR | 2PBC J0534.5+2201 | Crab | PSR | — | y |
| 1FGL J0730.31141 | PKS 072711 | bzq | 2PBC J0730.41142 | PG 072711 | BZQ | 0.37 | y |
| 1FGL J0835.34510 | PSR J08354510 | PSR | 2PBC J0835.34511 | Vela Pulsar | PSR | — | y |
| 1FGL J1045.25942 | — | — | 2PBC J1044.85942 | V* eta Car | V* | 0.70 | - |
| 1FGL J1124.65916 | PSR J11245916 | PSR | 2PBC J1124.95919 | SNR G292.0+01.8 | SNR | — | y |
| 1FGL J1632.74733c | — | — | 2PBC J1632.74727 | IGR J163284726 | gam | 0.87 | - |
| 1FGL J1656.23257 | — | — | 2PBC J1656.23303 | SWIFT J1656.33302 | QSO | 0.85 | - |
| 1FGL J1724.03611c | — | — | 2PBC J1725.23616 | IGR J172523616 | HXB | 0.69: | - |
| 1FGL J1738.52656 | — | — | 2PBC J1738.22700 | SLX 1735269 | LXB | 0.74 | - |
| 1FGL J1746.42849c | PWN G0.130.11 | pwn | 2PBC J1746.82845 | CXOGCS J174621.05284343.2 | X | 1.00c | n |
| 1FGL J1747.22958 | PSR J17472958 | PSR | 2PBC J1747.43000 | 1RXS J174726.8300008 | LXB | — | n |
| 1FGL J1747.62820c | — | — | 2PBC J1747.62820 | CXOGCS J174742.4282228 | X | 0.94 | - |
| 1FGL J1826.21450 | LS 5039 | HXB | 2PBC J1826.31450 | V* V479 Sct | HXB | — | y |
| 1FGL J1833.51034 | PSR J18331034 | PSR | 2PBC J1833.51033 | SNR 021.500.9 | PSR | — | y |
| 1FGL J1833.62103 | PKS 183021 | bzq | 2PBC J1833.72102 | PKS 1830211 | BZQ | 0.34 | y |
| 1FGL J2015.7+3708 | — | — | 2PBC J2015.9+3712 | RX J2015.6+3711 | CV* | 0.95 | - |
| 1FGL J2032.4+4057 | Cyg X-3 | MQO | 2PBC J2032.4+4057 | Cyg X-3 | HXB | — | y |
| 1FGL J2056.7+4938 | — | — | 2PBC J2056.5+4938 | RX J2056.6+4940 | X | 0.43 | - |
| 1FGL J2323.4+5849 | — | spp | 2PBC J2323.3+5849 | Cas A | SNR | 0.21 | - |
| 1FGL source | 1FGL counterpart | type | BZCAT source |
|---|---|---|---|
| 1FGL J0137.52428 | PKS 0135247 | bzq | BZQ J01372430 |
| 1FGL J0144.92732 | PKS 0142278 | bzq | BZQ J01452733 |
| 1FGL J0334.24010 | PKS 0332403 | bzb | BZB J03344008 |
| 1FGL J0403.93603 | PKS 0402362 | bzq | BZQ J04033605 |
| 1FGL J0455.64618 | PKS 045446 | bzq | BZQ J04554615 |
| 1FGL J0507.36103 | CRATES J05076104 | bzq | BZQ J05076104 |
| 1FGL J0507.9+6738 | 1ES 0502+675 | bzb | BZB J0507+6737 |
| 1FGL J0639.9+7325 | CGRaBS J0639+7324 | bzq | BZQ J0639+7324 |
| 1FGL J0721.9+7120 | S5 0716+714 | bzb | BZB J0721+7120 |
| 1FGL J0739.1+0138 | PKS 0736+01 | bzq | BZQ J0739+0137 |
| 1FGL J1031.0+5051 | 1ES 1028+511 | bzb | BZB J1031+5053 |
| 1FGL J1159.4+2914 | 4C +29.45 | bzq | BZQ J1159+2914 |
| 1FGL J1354.91041 | PKS 1352104 | bzq | BZU J13541041 |
| 1FGL J1604.3+5710 | CGRaBS J1604+5714 | bzq | BZQ J1604+5714 |
| 1FGL J1617.97716 | PKS 161077 | bzq | BZQ J16177717 |
| 1FGL J1637.9+4707 | 4C +47.44 | bzq | BZQ J1637+4717 |
| 1FGL J1725.0+1151 | CGRaBS J1725+1152 | bzb | BZB J1725+1152 |
| 1FGL J1800.4+7827 | CGRaBS J1800+7828 | bzb | BZB J1800+7828 |
| 1FGL J1849.3+6705 | CGRaBS J1849+6705 | bzq | BZQ J1849+6705 |
| 1FGL J1923.52104 | OV 235 | bzq | BZQ J19232104 |
| 1FGL J2143.4+1742 | OX 169 | bzq | BZQ J2143+1743 |
| 1FGL J2158.83013 | PKS 2155304 | bzb | BZB J21583013 |
| 1FGL source | 1FGL counterpart | type | BZCAT source |
|---|---|---|---|
| 1FGL J0137.8+5814 | — | — | — |
| 1FGL J0849.63540 | VCS2 J08493541 | agu | — |
| 1FGL J1329.25605 | PMN J13295608 | agu | — |
| 1FGL J1420.16048 | PSR J14206048 | PSR | — |
| 1FGL J1714.53830c | — | — | — |
| 1FGL J2021.0+3651 | PSR J2021+3651 | PSR | — |
| 1FGL J2347.1+5142 | 1ES 2344+514 | bzb | BZB J2347+5142 |
From Abdo et al. (2010a): gal = normal galaxy; agn = non blazar active galaxy; sbg = starburst galaxy; bzb = BL Lac object; bzq = flat spectrum radio quasar; agu = active galaxy of uncertain type; psr = pulsar; pwn = pulsar wind nebula; spp = potential association with a supernova remnant or a pulsar wind nebula; glc = globular cluster; mqo = microquasar object; hxb = other X-ray binary. Designations in capital letters correspond to firm identifications. From Abdo et al. (2010b): unk = AGN of unknown type. The nomenclature adopted in Cusumano et al. (2010b) is derived from SIMBAD online services, with the exception of blazars: LXB = low mass X-ray binary; HXB = high mass X-ray binary; G = normal galaxy; Sy1 = Seyfert 1 galaxy; Sy2 = Seyfert 2 galaxy; X = X-ray source; IG = interacting galaxy; CV* = cataclismic variable star; PSR = pulsar; V* = variable star; SNR = superNova remnant; gam = gamma-ray source; QSO = Quasi Stellar object. The nomenclature of the BZCAT (Massaro et al. (2009)) has been used for blazars: BZB = BL Lac objects; BZQ = flat spectrum radio quasars; BZU = blazars with uncertain classification.