Discovery of carbon monoxide in the upper atmosphere of Pluto
Abstract
Pluto’s icy surface has changed colour and its atmosphere has swelled since its last closest approach to the Sun in 1989. The thin atmosphere is produced by evaporating ices, and so can also change rapidly, and in particular carbon monoxide should be present as an active thermostat. Here we report the discovery of gaseous CO via the 1.3mm wavelength J=2-1 rotational transition, and find that the line-centre signal is more than twice as bright as a tentative result obtained by Bockélee-Morvan et al. in 2000. Greater surface-ice evaporation over the last decade could explain this, or increased pressure could have caused the atmosphere to expand. The gas must be cold, with a narrow line-width consistent with temperatures around 50 K, as predicted for the very high atmosphere, and the line brightness implies that CO molecules extend up to Pluto radii above the surface. The upper atmosphere must have changed markedly over only a decade since the prior search, and more alterations could occur by the arrival of the New Horizons mission in 2015.
keywords:
Kuiper belt objects: Pluto – planets and satellites: atmospheres – submillimetre: planetary systems1 Introduction
Pluto was the first body to be discovered in the Kuiper Belt of icy planetesimals orbiting in the outer Solar System. Although now only the second-largest body known in the belt (after Eris), Pluto is intensively studied, and is the primary target of the New Horizons mission (Stern & Spencer, 2003), with a spacecraft flyby scheduled in 2015. In particular, Pluto offers the rare opportunity to study a very cold planetary atmosphere which also evolves strongly with time, and may in fact be transient, settling and freezing out on the surface (Owen et al., 1993) as Pluto recedes from the Sun in its highly elliptical orbit. As Pluto’s last perihelion was in 1989, subsequent contraction of the atmosphere was expected, but in fact when observed by occultation of stars the atmospheric pressure and size had increased between 1988 and 2002 (Elliot et al., 2003a). Around the same time, the surface ice had become redder, and also brighter around the northern pole as it came more into sunlight (Buie et al., 2010a, b). Many of these results were surprising, such as changes in albedo over as little as a year, and darkening of the southern regions, contrary to expectations if ices have been sublimating from here most recently.
The atmosphere and surface must be strongly coupled, since sublimation of ices supplies the atmosphere (Schaller et al., 2007, e.g.), and so as the composition of the surface changes seasonally (Buie et al., 2010a, b), the gas abundances should also evolve. Atmospheric temperatures of around 100 K (Elliot et al., 2003b) are much warmer than the surface at only 40 K (Tryka et al., 1994). This requires a complex thermal balance controlled by the relative abundances of molecules that absorb radiation and re-emit in cooling lines, plus there is an overall influence of the level of sunlight, particularly in the ultra-violet (Strobel, 2008). The atmosphere is also very fragile, with a solar-driven slow wind predicted to be removing it into space (Delamere, 2009, e.g.).
Such a cold diffuse atmosphere is difficult to study by remote observation, and most conclusions are presently model-based. The trace gas methane is the only one to have been confirmed spectroscopically (Young et al., 1997). Surface-ice spectroscopy shows frozen nitrogen dominates (Owen et al., 1993), with methane and carbon monoxide also present, plus possibly ethane (DeMeo et al., 2010) and nitriles (Protopapa et al., 2008). N2 must dominate the atmosphere as it vaporizes readily and is by a factor of 50 the most abundant ice (Owen et al., 1993), but sublimated CO is the strongest coolant (Strobel, 2008) and so should act as the thermostat. Some evidence for CO includes the brightest patch on Pluto’s surface, suggested to be CO ice (Buie et al., 2010b, and references therein), and an extinction layer seen in atmospheric occultation, interpreted as droplets of N2 or CO (Rannou & Durry, 2009).
1.1 Previous searches for CO
Prior searches for gaseous CO have been made with ground-based telescopes. Infrared absorption spectroscopy has recently constrained CO:N2 to be 0.5 % near the surface (Lellouch et al., 2010), an order of magnitude below an earlier limit (Young et al., 2001). There is also a long history of millimetre-wavelength searches, looking for rotational transitions of CO from the higher atmosphere (Barnes, 1993; Bockélee-Morvan et al., 2001). As the atmosphere is warmer than the surface, and extends beyond the planetary disc, emission lines are predicted. The major difficulty is that Pluto is small and distant, subtending less than a percent of the beam solid angle, even for telescopes of 10-30m class. An upper limit was first obtained using the Haystack 37m in 1993, for the CO J=1-0 transition rotational line at 2.6 mm wavelength (Barnes, 1993). This limit was improved by the equivalent of eight-fold in 2000, with the IRAM 30m telescope (Bockélee-Morvan et al., 2001), and this group also searched for the J=2-1 transition at 1.3 mm with better sensitivity. A tentative positive signal was seen, with the brightest spectral channel observed at 28 mK in main-beam brightness temperature, versus 1 noise of 10 mK per 0.1 km/s spectral channel. However, the observation was severely affected by a strong line from a background Galactic cloud, coming as close as 0.5 km/s to potential Pluto emission (Bockélee-Morvan et al., 2001).
The 2000 data suffered from an unfortunate coincidence in sky position with an uncatalogued Galactic source, but Pluto’s orbit as seen from the Earth has brought it closer to the Galactic Plane over the last couple of years. Here we present results from the 15m James Clerk Maxwell Telescope, making a new search for the J=2-1 line, at epochs chosen to minimise Galactic contamination behind Pluto. The search was motivated by time availability at an excellent millimetre-site, and the opportunity to examine the evolution of Pluto’s atmosphere in the exciting run-up period to the arrival of New Horizons (Stern & Spencer, 2003). We report the confirmation of atmospheric CO (after two decades of searches), making it only the second gas-phase species to be detected, after methane (Young et al., 1997).
2 Observations and reduction
We used the JCMT at 4000 m altitude on Mauna Kea, Hawaii, observing over 3 nights in August 2009 and 8 nights in April to May 2010. Conditions were good to average for the site, with zenith sky opacity at 1.3 mm typically around 0.1. The setup used the ACSIS spectrometer (Buckle et al., 2009) together with the A3 receiver (Cunningham et al., 1992) (the instrument described was subsequently rebuilt by the Herzberg Institute of Astrophysics with a 1.3 mm-band mixer). Total on-source integration times were 12 and 19 hours in 2009 and 2010 respectively, with individual observations lasting approximately 20 minutes. The observing mode was frequency-switching, with a throw of 35.5 km/s within the passband. The telescope tracked Pluto’s sky position but not its velocity, so spectra were shifted in software to the dwarf planet’s reference frame. The spectrometer channel spacing was set to 0.04 km/s and there are systematics of around 0.025 km/s for velocity-drifts of Pluto within each observation that have not been corrected. Data are shown on the main-beam antenna temperature brightness scale, with a beam efficiency of 0.75 at 230.538 GHz frequency.
For each night of data, the shifted spectra were co-added, and then the appropriate positive and negative frequency-switched features were averaged. The region of the net positive line was blanked and replaced with a linear interpolation of surrounding channels. A running average over 12 channels was then generated from this and subtracted from the pre-blanked spectrum as a baseline. The 11 nightly spectra made in this way were finally combined, weighted by 1/noise2 factors to take into account their different conditions and observing durations. Rejected data include two earlier nights using a smaller frequency-switch, and two later nights when Pluto had approached within 1.5∘ of the Galactic Plane. These spectra show ripples and complex baselines, degrading the final line profile. The weight of these rejected data represent only 15 % of the total observations made.
The observations were planned to maximise the height of Pluto from the Galactic Plane, which varies as seen from the Earth, to minimise contamination problems. Pluto’s Galactic latitude in 2009 was +2.2∘, and in 2010 was -2.0∘ to -1.7∘, with longitudes of . Using two periods well spaced around the year (Aug and Apr/May) also caused large changes in Pluto’s velocity relative to the telescope, from +26 km/s in 2009 to -27 to -19 km/s in 2010. Thus any narrow line seen persistently at Pluto’s velocity in the co-added data can only be from the planetary atmosphere, as any Galactic background emission is different every night. Galactic lines were seen around Pluto’s velocity in the spring data, but were much broader than the Pluto line.
3 Results
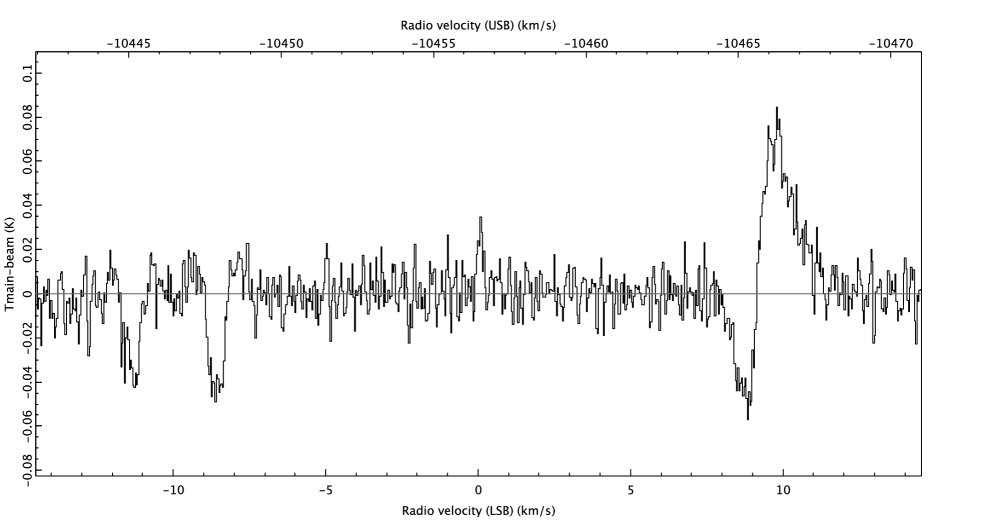
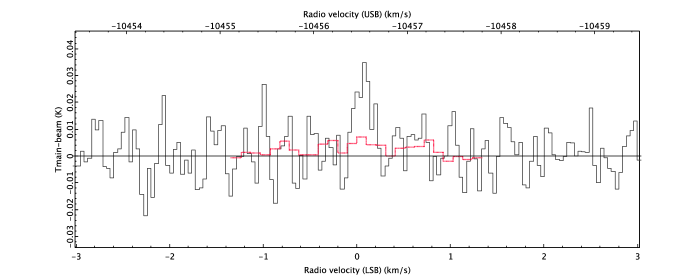
Figure 1 shows the co-added Pluto spectrum from 2009/10, in the dwarf planet’s rest-frame. A clear line is seen at zero velocity, with 6.5 confidence in the integrated antenna temperature. There are no other significant narrow features; the next brightest (at -5 km/s), is at only 2.7 over three spectral channels, and was traced to a signal from a pair only of the 11 observing nights. The broad features are residuals from the running-average subtraction process, arising from broad lines of Galactic clouds from different nights. A detail spectrum (Figure 2) shows the very flat baseline achieved near Pluto’s velocity, while a test made by blanking a broader region (20 channels instead of 12) showed a change in integrated brightness of only around 10 %. This argues for a robust signal measurement of the narrow line seen, and also implies that broad line wings are faint.
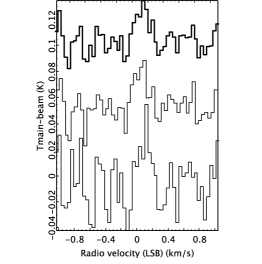
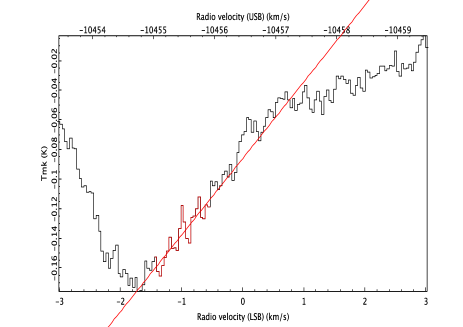
The CO line from Pluto was independently detected in both the 2009 and 2010 epochs, at levels of 3.9 and 5.4 respectively, and with the same integrated brightness within the errors (Figure 2, right panel). The antenna temperatures are calibrated to about 20 %, based on rms scatter of the line-peak signal of spectral standards taken every night on the nearby source OH17.7-2. Also, inclusion of the two nights of early data taken with a smaller frequency-switch was found to reduce the final integrated line intensity by %. The brightness measurements could be affected by broad structure in the baseline, and Figure 3 demonstrates the spectrum obtained if the data are co-added without baselining. The curvature due to Galactic residuals makes it difficult to establish the nature of faint line wings.
The integrated antenna temperature of CO J=2-1 over 8 spectral channels (0.32 km/s) is 6.31.0 mK km/s on a main-beam brightness temperature scale. The mean is 20 mK, and the 1 noise per 0.04 km/s spectral channel is 8.6 mK (twice as deep as Bockélee-Morvan et al. (2001) for a common spectral resolution). The full-width at half-maximum intensity is approximately 0.28 km/s. The velocity centroid is km/s, including errors from comparing adjacent half-line intensities of 0.03 km/s and systematics of the 0.04 km/s channel spacing and km/s velocity drifts within scans. Hence, the centroid velocity may be marginally positively offset from Pluto.
Figure 2 also shows the CO J=2-1 spectrum obtained in 2000 by Bockélee-Morvan et al. (2001). Their values have been scaled downwards by a factor of four, to account for the greater beam-dilution for a compact source with the JCMT 15m versus the IRAM 30m telescope. On this ‘JCMT-equivalent’ scale, the 2000 spectrum has a 3 upper limit of 7.5 mK in each 0.10 km/s channel, and the brightest channel near zero velocity is 7 mK. Weak positive signals were seen in line wings, and the integrated signal over km/s was 5.9 mK km/s, at signal-to-noise ratio of 4.5. The integrated intensity appears similar in 2000 and 2009/10, but the earlier spectrum has a greater contribution from possible line wings (Figure 2). A Voigt-profile fit to the new spectrum suggests broad wings now contribute %.
3.1 Features of the CO spectrum
Figure 2 shows that the line-centre emission in 2009/2010 significantly exceeds that in the observation from April 2000 (Bockélee-Morvan et al., 2001). In the brightest 0.1 km/s channel, the signal was mK, compared to mK now when averaged over the same region from the JCMT spectrum. Thus the ratio is at least 22/10.5 from the bounds, implying the line-centre intensity has more than doubled over a decade.
The core of the line now seen is narrower than previously predicted in models (Stansberry et al., 1994; Strobel et al., 1996). Model line profiles as plotted by Bockélee-Morvan et al. (2001) are over twice as wide as observed, with full-width half-maxima of approximately 0.7 km/s. These models had atmospheric temperatures of 80-106 K, but our measured line width of 0.28 km/s implies that thermalised CO can not be warmer than K. This estimate includes only thermal broadening, and so the gas could be even cooler if there is another source of velocity dispersion. Person et al. (2008) find evidence for large-scale atmospheric waves, but with horizontal wind speeds of under 3 m/s, while upwards sublimation flows should be at only a few cm/s (Toigo et al., 2010). The latter would also be in the contrary sense to the tentative red-shift noted above, since upwelling would produce a blue-shift from the near-side of the atmosphere that is preferentially observed.
4 Discussion
The marked increase in CO line-peak brightness could be due to recent sublimation of surface ice – for example, the largest bright patch seen on Pluto’s surface is attributed to carbon monoxide frost (Buie et al., 2010b). While this is a long-term feature in albedo maps, it could be a rich source of sublimating CO. Alternatively, a large expansion in isobar heights was detected between 1988 and 2002 (Elliot et al., 2003a), and such increases in atmospheric pressure could raise the effective emitting area for trace molecules. However, these occultation data only detect the atmosphere up to around 135 km (Young et al., 2008, e.g.), so effects at higher altitudes are uncertain. Regarding timescales, marked surface changes have occurred over intervals as short as a year (Buie et al., 2010b), while vertical sublimation speeds (Toigo et al., 2010) imply a molecule could rise thousands of kilometres within a decade. Hence it is reasonable that temporal changes in gas densities and/or abundances as surface ices sublimate could result in the CO lines being quite different over observations a decade apart (Figure 2).
Finding cold CO points to gas at very large heights – for example temperatures as low as 50 K have been predicted for about 4500 km above the centre of Pluto (Strobel, 2008). This is under solar minimum conditions, as actually present in 2009/10. If the top of the CO layer is at 4500 km, then the atmosphere would subtend a diameter of 0.4 arcsec, as it was seen in 2009/10 with Pluto at 31 AU from the Earth. From this, in the simplest approximation of a filled opaque shell of CO molecules thermalised at 50 K, the beam-filling factor would be , giving an expected line brightness of 18 mK. This is in good agreement with our mean of 20 mK. Lower atmospheric layers should be warmer and so add line brightness, but as an example, gas twice as hot (100 K) is predicted to lie below 2000 km (Strobel, 2008), and thus be five times more beam-diluted.
4.1 Comparison to models
Exact calculations for the CO line profile require radiative transfer calculations and an atmospheric model, beyond the scope of this Letter. However, some estimates can be made for the heights of the emitting layers. The density profile should decline approximately as a power-law (Strobel, 2008), if CO has a constant mixing ratio with N2. Then the height below which the CO emission becomes opaque can be estimated, or more strictly, the height of the tangent where the column of CO molecules excited to the J=2 level produces , for opacity of unity and equal to the line FWHM of 0.28 km/s. In an isothermal 50 K approximation, this height is 2750 km for a power-law density profile approximating that at solar maximum (Strobel, 2008), and 2250 km for a solar minimum profile. The respective heights which contribute opacity of 0.01 are about 4600 and 3200 km. These values are for CO:N2 of 0.005, following Strobel (2008) and at an upper limit observed in July 2009 (Lellouch et al., 2010). If contributions to the CO signal come from as high up as 4500 km, as estimated above from beam-filling arguments, then it appears that atmospheric densities must be at the high end of the models, or upper-level CO must be more abundant than assumed. Also, in the models high densities are associated with warmer temperatures than infered here – this anomaly may be related to heating from CH4 molecules absorbing solar UV, noting that recent estimates of the methane mixing ratio (Zalucha et al., 2011) are up to times lower than assumed by Strobel (2008).
The CO upper boundary estimated to be at about 4500 km above the centre of Pluto corresponds to radii, for km (Tholen & Buie, 1997). This is a reasonable upper bound, given that above 3-5 RPluto, the gas should become so diffuse that is is collisionless (Strobel, 2008), and thus the CO J=2 level will not be populated. Also, interaction with the solar wind will cause ionised gas (and any swept-up neutrals) to flow away into space, above RPluto in the simulations of Delamere (2009); Harnett et al. (2005). The CO layer estimated to extend out to RPluto is thus inside this flow zone and can be expected to be stable. Strobel (2008) models a slower hydrodynamic outflow inside this region, but predicted speeds only exceed our 0.04 km/s velocity resolution above 4500 km, so effects on the spectrum would be negligible. It is however possible that the marginal CO line red-shift, if real, could indicate a flow forming into a comet-like tail directed away from the Sun.
CO gas should be chemically stable even at large altitudes, and at low densities, cloud models imply that it will stay in the gas phase. CO ice could only form if seed particles existed – akin to noctilucent clouds on Earth, where highly supersaturated water can condense out on rare solid particles, such as meteoritic dust raining in from space. Such interplanetary dust is however sparse out in the Kuiper Belt (Landgraf et al., 2002). Rannou & Durry (2009) proposed cloud decks lower down in Pluto’s atmosphere, with droplets of CO or N2 that could explain an extinction layer (Elliot et al., 2003a). However, heterogeneous nucleation (i.e. chemical reactions on a surface leading to increase of the droplet volume) is only efficient inside a limited temperature interval, and it yields no droplets above heights of 30 km in these Pluto models (Rannou & Durry, 2009).
Since surface changes (Buie et al., 2010a, b) and the gaseous methane abundance (Zalucha et al., 2011) are seen to be temporally variable, time-dependent models will be needed to balance the effects of heating, cooling, sublimation and solar irradiation. Further CO line monitoring is underway, and N2 gas can be detected for the first time with ultraviolet spectroscopy (Stark et al, 2007) by the ALICE spectrograph on New Horizons (Stern et al., 2008). Hence atmospheric models can be tested from data taken before and during the 2015 flyby.
5 Conclusions
Carbon monoxide is confirmed in the atmosphere of Pluto, and gives the first detection of high-altitude gas. There have been large temporal changes in the CO line profile over the last decade, in parallel to major alterations of the surface ices. Pluto’s rapidly changing and fragile atmosphere could provide an interesting test-bed for models of global climates.
Acknowledgments
This work was supported by the Scottish Universities Physics Alliance. The data were obtained under programme M09BU12 at the JCMT, with invaluable assistance from I. Coulson and J. Hoge. The James Clerk Maxwell Telescope is operated by the Joint Astronomy Centre on behalf of the Science and Technology Facilities Council of the United Kingdom, the Netherlands Organisation for Scientific Research, and the National Research Council of Canada.
References
- Barnes (1993) Barnes P.J., 1993, AJ 106, 2540
- Bockélee-Morvan et al. (2001) Bockélee-Morvan D., Lellouch E., Biver N., Paubert G., Bauer J., Colom P., Lis D.C., 2001, A&A 377, 343
- Buckle et al. (2009) Buckle J.V. et al., 2009, MNRAS 399, 1026
- Buie et al. (2010a) Buie M.W.,Grundy W.M., Young E.F., Young L.A., Stern S.A., 2010, Astron. J. 139, 1117
- Buie et al. (2010b) Buie M.W.,Grundy W.M., Young E.F., Young L.A., Stern S.A., 2010, Astron. J. 139, 1128 Forget F., Lellouch E., 2008, A&A 489, 795
- Cunningham et al. (1992) Cunningham C.T.,Hayward R.H., Wade J.D., Davies S.R., Matheson D.N., 1992, Int. J. Infr. Mill. Waves 13, 1827
- Delamere (2009) Delamere P.A., 2009, J. Geophys. Res. 114, A03220
- DeMeo et al. (2010) deMeo F.E. et al., 2010, Icarus 208, 412
- Elliot et al. (2003a) Elliot J.L. et al., 2003, Nature 424,165
- Elliot et al. (2003b) Elliot J.L, Person M.J., Qu S., 2003, Astron. J. 126, 1041
- Harnett et al. (2005) Harnett E.M., Winglee R.M., Delamere P.A., 2005, Geo. Res. Lett. 32, L19104
- Landgraf et al. (2002) Landgraf M., Liou J.-C., Zook H.A., Grün E., 2002, AJ 123, 2857
- Lellouch et al. (2010) Lellouch E., de Bergh C., Sicardy B., Ferron S., Käufl H.-U., 2010, A&A 512, L8
- Owen et al. (1993) Owen T.C. et al., 1993, Science 261, 745
- Person et al. (2008) Person M.J. et al., 2008, AJ 136, 1510
- Protopapa et al. (2008) Protopapa S., Boehnhardt H., Herbst T.M., Cruikshank D.P., Grundy W.M., Merlin F., Olkin C.B., 2008, A&A 490, 365
- Rannou & Durry (2009) Rannou P., Durry G., 2009, J. Geophys. Res. 114, E11013
- Schaller et al. (2007) Schaller E.L., Brown M.E., 2007, Astrophys. J. 659, L61
- Stansberry et al. (1994) Stansberry J.A., Lunine J.I., Hubbard W.B., Yelle R.V., Hunten D.M., 1994, Icarus 111, 503
- Stark et al (2007) Stark G., Smith P.L., Lewis B.R., 2007, Lun. Plan. Inst. Contrib. 1376, 115
- Stern et al. (2008) Stern S.A. et al., 2008, Space Sci. Rev. 140, 155
- Stern & Spencer (2003) Stern A., Spencer J., 2003, EM&P 92, 477
- Strobel (2008) Strobel D., 2008, Icarus 193, 612
- Strobel et al. (1996) Strobel D.F., Zhu X., Summers M.E., Stevens M.H., 1996, Icarus 120, 266
- Tholen & Buie (1997) Tholen D.J., Buie M.W., 1997, Icarus 125, 245
- Toigo et al. (2010) Toigo A.D., Gierasch P.J., Sicardy B., Lellouch E., 2010, Icarus 208, 402
- Tryka et al. (1994) Tryka K.A., Brown R.H., Cruikshank D.P., Owen T.C., Geballe T.R., de Bergh C., 1994, Icarus 112, 513
- Young et al. (2008) Young E.F. et al., 2008, AJ 136, 1757
- Young et al. (2001) Young L.A., Cook J.C., Yelle R.V., Eliot F., 2001, Icarus 153, 148
- Young et al. (1997) Young L.A., Elliot J.L., Tokunaga A., de Bergh C., Owen T., 1997, Icarus 127, 258
- Zalucha et al. (2011) Zalucha A.M., Gulbis A.A.S., Zhu X., Strobel D.F., Elliot J.L., 2011, Icarus 211, 804