Quantified H i Morphology II :
Lopsidedness and Interaction in WHISP Column Density Maps
Abstract
Lopsidedness of the gaseous disk of spiral galaxies is a common phenomenon in disk morphology, profile and kinematics. Simultaneously, the asymmetry of a galaxy’s stellar disk, in combination with other morphological parameters, has seen extensive use as an indication of recent merger or interaction in galaxy samples. Quantified morphology of stellar spiral disks is one avenue to determine the merger rate over much of the age of the Universe. In this paper, we measure the quantitative morphology parameters for the H i column density maps from the Westerbork observations of neutral Hydrogen in Irregular and SPiral galaxies (WHISP). These are Concentration, Asymmetry, Smoothness, Gini, , and one addition of our own, the Gini parameter of the second order moment (). Our aim is to determine if lopsided or interacting disks can be identified with these parameters. Our sample of 141 H i maps have all previous classifications on their lopsidedness and interaction.
We find that the Asymmetry, and our new parameter correlate only weakly with the previous morphological lopsidedness quantification. These three parameters may be used to compute a probability that an H i disk is morphologically lopsided but not unequivocally to determine it. However, we do find that that the question whether or not an H i disk is interacting can be settled well using morphological parameters. Parameter cuts from the literature do not translate from ultraviolet to H i directly but new selection criteria using combinations of Asymmetry and or Concentration and , work very well.
We suggest that future all-sky H i surveys may use these parameters of the column density maps to determine the merger fraction and hence rate in the local Universe with a high degree of accuracy.
keywords:
galaxies: fundamental parameters galaxies: spiral galaxies: structure galaxies: interactions galaxies: kinematics and dynamics1 Introduction
In the study of the 21 cm emission of atomic hydrogen (H i) from nearby galaxies it was noted early on that many appear to be not symmetric. This phenomenon was termed “lopsidedness” of the H i morphology (Baldwin et al., 1980). Richter & Sancisi (1994) find that half of galaxy disks are lopsided. A similar deviation from the axi-symmetry in the stellar disks of galaxies was noted by Rix & Zaritsky (1995) and Zaritsky & Rix (1997). The H i line profile of half the population of galaxies, also shows a clear deviation from symmetry on either side of the systemic velocity (Haynes et al., 1998; Matthews et al., 1998). Swaters et al. (1999) report a third kind of lopsidedness, a deviation from axi-symmetry in the position-velocity diagram, termed kinematic lopsidedness. The fraction of lopsided galaxies may depend on environment; e.g., the Eridanus Galaxy group counts twice as many lopsided galaxies as the field (Angiras et al., 2006), but the Ursa Major group is similar to the field (Angiras et al., 2007). Lopsidedness seems to be the strongest in the outer regions of a disk (Jog, 1999).
Disk lopsidedness may be the product of tidal interactions (Jog, 1997), minor mergers (Zaritsky & Rix, 1997), asymmetric accretion of fresh gas from the cosmic web (Bournaud et al., 2005a), intergalactic gas ram-pressure (Mapelli et al., 2009), or an offset between the disk and dark matter halo (“disk sloshing”, Levine & Sparke, 1998; Noordermeer et al., 2001). Alternatively, the phenomenon may be attributed equally to most of these causes (Mapelli et al., 2009). In the case of a stellar disk, lopsidedness may have an internal cause, such as a dynamical instability (e.g., Lovelace et al., 1999; Dury et al., 2008).
Initially, the main way to identify lopsidedness has been a visual inspection of the H i column density map, line profile or velocity field of a galaxy (Richter & Sancisi, 1994; Haynes et al., 1998; Matthews et al., 1998; Swaters et al., 2002; Noordermeer et al., 2005b). In addition, lopsidedness can be quantified using a Fourier decomposition of either the stellar image (Zaritsky & Rix, 1997; Bournaud et al., 2005a), the H i column density map (Angiras et al., 2006, 2007), or velocity field (Schoenmakers et al., 1997; Trachternach et al., 2008). However, the Fourier analysis has only been performed on small samples of H i observations or larger samples of optical ones. We refer the reader to the in-depth review by Jog & Combes (2009) on the lopsidedness phenomenon.
In parallel with the line of investigation into galaxy lopsidedness, a considerable observational effort has gone into morphological tracers of interaction over cosmological times. These studies use certain quantifiable morphological parameters of restframe-ultraviolet images of distant and nearby galaxies to estimate the merger rate of galaxies (Abraham et al., 1994; Conselice et al., 2000; Lotz et al., 2004). Two sets of parameterisations have emerged, the Concentration-Asymmetry-Smoothness by Conselice (2003) and the Gini- by Lotz et al. (2004). These parameterisations of galaxy morphology have now been applied on every deep multi-wavelength Hubble field to determine merger rates; in the Hubble Ultra Deep Field by Pirzkal et al. (2006), GOODS by Bundy et al. (2005) and Ravindranath et al. (2006), COSMOS by Scarlata et al. (2007) and Conselice et al. (2009), GEMS by Jogee et al. (2009), and the extended Groth strip by Lotz et al. (2008a) and Conselice et al. (2008), as well as local reference samples (Conselice, 2003; Lotz et al., 2004; Bendo et al., 2007; Muñoz-Mateos et al., 2009). The different parameterisations of galaxy appearance are sensitive to different stages of an interaction and different interaction types (Lotz et al., 2008b; Conselice, 2009; Lotz et al., 2010a, b) but are very successful in estimating the galaxy merger fraction and rate over much of the age of the Universe.
Yet, to date, these studies have been constrained mostly to restframe ultraviolet and optical because these are the wavelengths where interaction-induced star-formation produces high-surface brightness features in galaxies with clearly disturbed morphology at wavelengths where the Hubble Space Telescope can reasonably observe them.
In the previous papers in this series (Holwerda et al., 2009, 2011b, 2011c), we have shown that a description of the H i morphology using these parameters is as sensitive, if not better than, any of the star-formation dominated wavelengths to the effects of interactions. Hence, the future Square Kilometer Array (SKA; Carilli & Rawlings, 2004) and its precursor radio telescopes, South Africa’s Karoo Array Telescope (MeerKAT; Booth et al., 2009; Jonas, 2007; de Blok et al., 2009), and the Australian SKA Pathfinder (ASKAP; Johnston, 2007; Johnston et al., 2007, 2008a, 2008b, 2009), provide an opportunity to explore the lopsidedness phenomenon as well as interactions using 21 cm line emission (H i) of thousands of galaxies. However, to do so, automated parameterisations of the H i maps are needed and the relation between the lopsidedness phenomena and the above parameter space will need to be explored. If, for instance a parameter space can be identified for interacting galaxies, a merger fraction for a given cosmic volume can be measured. Combined with an estimate of the timescale a merger spends in this parameter space (Holwerda et al., 2011d), one can then estimate the merger rate (Holwerda et al., 2011a). Our ultimate goal is to simplify the selection of subsamples in the upcoming large H i surveys using existing morphological parameters.
In this paper, we compare the CAS and Gini- parameters as determined in the H i column density maps of 141 galaxies, to the lopsidedness qualification and interaction determinations from Swaters et al. (2002) and Noordermeer et al. (2005b). In §2, we define the two main concepts, in §3 we briefly discuss the morphological parameters and present a new additional parameter. In §4, we describe the radio data used. Our results are presented in §5 with our conclusions in §6 and a brief outlook in §7.
2 Lopsidedness and Asymmetry
In the following discussion, we find it useful to define the terms lopsidedness and asymmetry as they are often used interchangeably and the difference is subtle.
Lopsidedness is a comparison of axi-symmetry, the level of symmetry of a galaxy image, line profile or velocity field when mirrored over an axis (minor or major) (Baldwin et al., 1980; Swaters et al., 1999). Quantified definitions of lopsidedness are when a disk displays an global spatial offset (m is the azimuthal wavenumber in a spatial Fourier decomposition) or the distribution ( is the azimuthal angle) is non-axisymmetric. In the case of the WHISP sample, there are qualitative estimates of a disk’s lopsidedness available from Swaters et al. (2002) and Noordermeer et al. (2005b).
Asymmetry, as defined by Abraham et al. (1994) and Conselice (2003), is the point-symmetry of an object; the level of symmetry when the object is rotated around its centre.
3 Morphological Parameters
The morphological parameters we compute over the H i column density maps are Concentration, Asymmetry and Smoothness from Conselice (2003), and Gini from Lotz et al. (2004), and a single addition of our own; the Gini parameter of the second order moment of the light, . We describe our implementation of the existing parameters in Holwerda et al. (2011b, c) and below. The relevant input parameters are the central position of the galaxy (, ), and a definition of the area over which these parameters are computed. The Gini parameter only requires the definition of the area and not the central position, making it less sensitive to input error. We obtained uncertainty estimates from a Monte-Carlo run, varying the central position of each galaxy and a separate run randomly redistributing the pixel values in the galaxy-area.
3.1 CAS
CAS refers to the now commonly used Concentration-Asymmetry-Smoothness space (Conselice, 2003) for morphological analysis of distant galaxies. Concentration of the light, symmetry around the centre and smoothness as an indication of substructure.
Concentration is defined by Bershady et al. (2000) as:
| (1) |
with as the radius containing percentage of the light of the galaxy (see definitions of in Bertin & Arnouts, 1996; Holwerda, 2005).
The asymmetry is defined as the level of point-, (or rotational-) symmetry around the centre of the galaxy (Abraham et al., 1994; Conselice, 2003):
| (2) |
where is the value of the pixel at the position in the image, and is the pixel at position in the galaxy’s image, after it was rotated around the centre of the galaxy.
3.2 Gini and
Abraham et al. (2003) and Lotz et al. (2004) introduce the Gini parameter to quantify the distribution of flux over the pixels in an image. They use the following definition:
| (4) |
is the value of pixel i in an ordered list of the pixels, is the number of pixels in the image, and is the mean pixel value in the image. We chose this definition as it is the computationally least expensive. The Gini parameter is an indication of equality in a distribution (initially an economic indicator Gini, 1912; Yitzhaki, 1991), with G=0 the perfect equality (all pixels have the same intensity) and G=1 perfect inequality (all the intensity is in a single pixel). Its behaviour is therefore in between that of a structural measure and concentration.
Lotz et al. (2004) also introduced a new way to parameterize the extent of the light in a galaxy image. They define the spatial second order moment as the product of the intensity with the square of the projected distance to the centre of the galaxy. This gives more weight to emission further out in the disk. It is sensitive to substructures such as spiral arms and star-forming regions but insensitive if these are distributed symmetrically or not.
The second order moment of a pixel is defined as:
| (5) |
where is the position of a pixel with intensity value in the image and is the central pixel position of the galaxy in the H i surface density map.
The total second order moment of the image is given by:
| (6) |
Lotz et al. (2004) use the relative contribution of the brightest 20% of the pixels to the second order moment as a measure of disturbance of a galaxy:
| (7) |
The parameter is sensitive to bright regions in the outskirts of disks and thus higher values can be expected in galaxy images (in the optical and UV) with star-forming outer regions as well as those images of strongly interacting disks.
3.3 Gini of the second order moment ()
Instead of using the intensity of pixels, we can define a Gini parameter for the second order moment of each pixel by substituting (equation 5) for in equation 4:
| (8) |
This is our contribution to the parameter space to provide an additional handle to characterise lopsidedness and interaction level. Our reasoning was that the Gini parameter has the added benefit of using the combined shape of the flux distribution curve (all the information in the image), rather than just a fraction. In Holwerda et al. (2011c), we found hints that may be not sensitive enough to interaction signature while Asymmetry is sensitive to other effects as well. A similar conclusion was reached by Lotz et al. (2008c), hence is an attempt to define a single parameter to detect interaction using all the information on the second order moment.
4 WHISP data
The data we use are the H i column density maps from the Westerbork H i Survey of Irregular and SPiral galaxies (WHISP, van der Hulst et al., 2001; van der Hulst, 2002; Swaters et al., 2002; Swaters & Balcells, 2002; Noordermeer et al., 2005b). WHISP is a survey of the neutral hydrogen component in spiral and irregular galaxies with the Westerbork Synthesis Radio Telescope (WSRT). It has mapped the distribution and velocity structure of H i in several hundreds of nearby galaxies, increasing the number of H i observations of galaxies by an order of magnitude. The WHISP project provides a uniform database of datacubes, zeroth-order and velocity maps. Its focus has been on the structure of the dark matter halo as a function of Hubble type, the Tully-Fisher relation and the dark matter content of dwarf galaxies.
The WHISP observation targets were selected from the Uppsala General Catalogue of Galaxies (Nilson, 1973), with blue major diameters , declination (B1950) and flux densities at 21-cm larger than 100 mJy, later lowered to 20 mJy Observation times were typically 12 hours of integration. The galaxies satisfying these selection criteria generally have redshifts less than 20000 km/s (). A further prerequisite was that either Swaters et al. (2002) or Noordermeer et al. (2005b) classified both the level of the galaxy’s lopsidedness and whether or not it is interacting.
The WHISP data was retrieved from the “Westerbork on the web” project at ASTRON (http://www.astron.nl/wow/). We use the column density maps with the highest resolution available (12” x 12”/sin()). The positions and basic H i information (masses and diameters etc.) are from Swaters et al. (2002) and Noordermeer et al. (2005a, b). We used the central position () as input for the parameters and the radius of the H i disk () to cut out a stamp of the disk before computation (a stamp was set at ). The computed morphological parameters are in Tables A1 and A2 in Appendix A (electronic edition only).
5 Results
The samples from Swaters et al. (2002) and Noordermeer et al. (2005b) both have visual classifications of a galaxy’s lopsidedness and whether or not it is interacting. Lopsidedness was determined for each galaxy’s morphology in the H i column density map, its profile and velocity map. These are the morphological, profile and kinematic lopsidedness respectively. These classification were done by a single observer by visual inspection and hence carry some risk of observer bias. The classifications by Swaters et al. (2002) for lopsidedness are: not-, weak-, and strong lopsidedness. The lopsidedness classification by Noordermeer et al. (2005b) is a little more nuanced with no, mildy-, moderately-, and severely lopsided. Both authors classify morphological, profile as well as kinematic lopsidedness with their respective qualifiers. To unify the two classification schemes, we re-assigned the Swaters et al. (2002) classifications to lopsidedness categories of the Noordermeer et al. (2005b) classification: weak is equivalent to mild and strong to severely. In the following section we use the Noordermeer et al. lopsidedness scale.
Noordermeer et al. (2005b) also gives an estimate on whether the galaxy is interacting and Swaters et al. (2002) lists the five galaxies in their sample of 74 dwarfs that are in an active interaction. This fraction (5/74) might be an under-estimate and may not account for galaxies that are only mildly interacting.
In the following section (5.1), we compare the visual classifications of lopsidedness to our morphological parameters to determine if lopsidedness can be quantified with our morphological parameters. In the next section (5.2), we explore the distribution of interacting galaxies in our parameter space. These visual classifications are subject to possible observer bias but the aim here is to identify the parts of the morphological parameter space described in section 3 that hold the majority of lopsided or interacting galaxies. Appendix A (electronic edition only) lists the morphological parameters of all the galaxies in the Swaters et al. (2002) and Noordermeer et al. (2005) sample in Tables A1 and A2 respectively.

5.1 Lopsidedness
Figure 1 shows the histograms of the above six parameters (C, A, S, G, , and ) for lopsided (any strength) and non-lopsided galaxy morphology according to either Swaters et al. (2002) or Noordermeer et al. (2005b). Based on the definition of lopsidedness, we expected the Asymmetry, , and possibly the parameters to show a difference between the two populations. We observe a difference in the median in these parameters with the lopsided galaxies showing higher values for Asymmetry and and lower values for (Figure 1). The Gini parameter shows a shift in the median value for the lopsided galaxies as well.
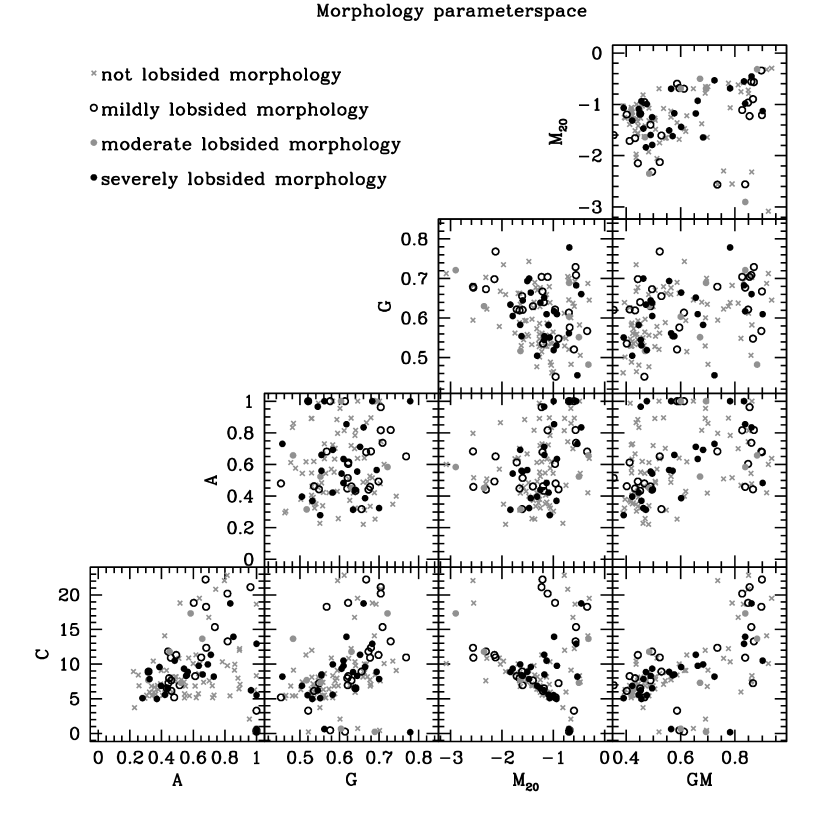
Figure 2 shows the parameter space of C, A, G, , and with the different lopsidedness classifications (no, mild, moderate and severely). As mentioned above, weak and strong according to Swaters et al. (2002) are plotted as mild and severely respectively. There is no clear part of parameter space where one could identify only, for instance, the severely (strongly) lopsided galaxies.
While the distributions of morphological values are different between lopsided and not lopsided galaxies, there is no clear cut in morphological parameters to discern between the two or separate out weakly and strongly lopsided galaxies. As it stands, the distributions in Figure 1 could be used to compute a probability that a galaxy is lopsided, but this would still have to be followed up with a visual inspection like those in Swaters et al. (2002) and Noordermeer et al. (2005b) or a Fourier decomposition such as the ones in Zaritsky & Rix (1997); Bournaud et al. (2005a); Angiras et al. (2006, 2007); van Eymeren et al. (2011).
To illustrate further, Figures B1 and B2 in Appendix B (electronic version) show some typical H i maps from the WHISP sample for the minimum, mean and maximum values of Asymmetry and Gini for all four lopsidedness categories; none, weak, moderate and strong lopsidedness. In our view, these images illustrate how, for instance, Asymmetry and qualitative lopsidedness do not measure the same thing. A galaxy can be strongly asymmetric with a lot of flux in a spiral arm offset from the centre of the galaxy, while at the same time, the outer contour may appear much like a ordinary disk. Conversely a strung-out galaxy may appear very lopsided at the lowest H i flux levels, but if there is little flux in the outermost part, and a strong, symmetric disk (with a ring for instance), this may not show in any of the morphological parameters. Our parameters are flux-weighted by design but the qualitative visual classification of lopsidedness by the previous authors may not be.
To verify if the shape of the outer contour alone is a better indication of lopsidedness, we compared the morphological parameters for the images with uniform weighting (pixel-values set to ). The Gini parameter, in this case, is of no use as this image is perfectly equal (G=0). The Asymmetry, and parameters show less change in distribution between the lopsided and non-lopsided populations.
Alternatively, in order to parameterize morphological lopsidedness in similar terms as the morphological parameters presented, one could redefine Asymmetry using a specific axis (requiring the additional input of a Position Angle). For example, Baldwin et al. (1980) chose the east-west axis and Richter & Sancisi (1994) chose the systemic velocity axis. We compared fluxes from either side of the centre of these galaxies for the x and y-axes of the maps ( and , Tables A1 and A2 in Appendix A, electronic edition) and found no relation with the lopsidedness qualifier from either Swaters et al. (2002) or Noordermeer et al. (2005b) (see Table LABEL:t:swaters and LABEL:t:noordermeer). Lopsidedness cannot easily be quantified using the above common morphological parameters or simple variations thereof. At best, the histograms in Figure 1 can be used to assign a probability of morphological lopsidedness. In light of the fact that the above morphological parameters were developed to discern spirals from ellipticals in the optical, their insensitivity to the lopsidedness of spiral H i disks is a indication of the extent that they can be used to classify morphological sub-types. Therefore, a Fourier decomposition (similar to Zaritsky & Rix, 1997; Bournaud et al., 2005a; Angiras et al., 2006, 2007) is still needed to classify and quantify the lopsidedness of galaxies in future large H i surveys, such as WALLABY on ASKAP or a northern sky H i survey with APERTIF on WSRT or the MHONGOOSE111MeerKAT HI Observations of Nearby Galactic Objects: Observing Southern Emitters nearby galaxy survey with the MeerKAT radio telescope.
| Noordermeer | Swaters | |||
| (68 galaxies) | (73 galaxies) | |||
| Selection Criterion | Nr. (fraction) | Individual | Nr. (fraction) | Individual |
| agreement | agreement | |||
| Visual classification | 27 (39%) | - | 5 (7%) | - |
| (1) | 55 (80%) | 23 | 53 (78%) | 4 |
| (2) | 51 (75%) | 20 | 43 (63%) | 4 |
| (3) | 61 (81%) | 23 | 65 (96%) | 5 |
| (4) | 39 (57%) | 21 | 13 (19%) | 4 |
| (5) | 22 (32%) | 2 | 36 (52%) | 1 |
| (6) | 23 (33%) | 11 | 8 (11%) | 4 |
| (4) & (5) | 6 (8%) | 1 | 5(7%) | 0 |
| (5) & (6) | 0 (0%) | 0 | 1(1%) | 0 |
| (4) & (6) | 23 (33%) | 11 | 8(11%) | 4 |

5.2 Interaction
Based on the literature, one expects there be some signal of interaction in Concentration, Asymmetry, and Gini as the galaxy is warped and tidal arms are formed: the interaction spreads flux from the exponential distribution, altering Concentration and Gini, adds bright knots of stars further from the centre in optical images, changing both and Asymmetry, and interaction breaks the overall symmetry of the galaxy’s image, also modifying Asymmetry. Since this parameter space was developed to classify galaxy morphology, one can expect changes in more than one of the parameters simultaneously when the spiral disk is gravitationally disturbed. During the interaction, one can also reasonably expect the disk to return periodically to unperturbed morphological values. Hence, we seek a section of this parameter space where interacting disks spend some of the several Gyr that an merger takes. The fraction of galaxies in this parameter space, together with and estimate of the typical time spent there gives a typical merger rate for an H i survey.
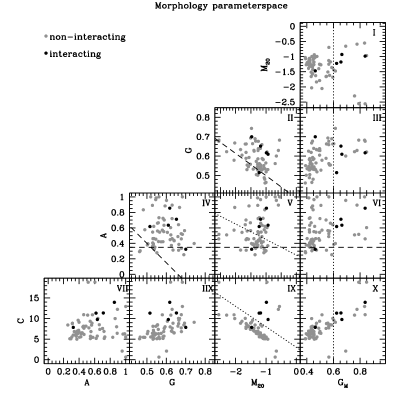
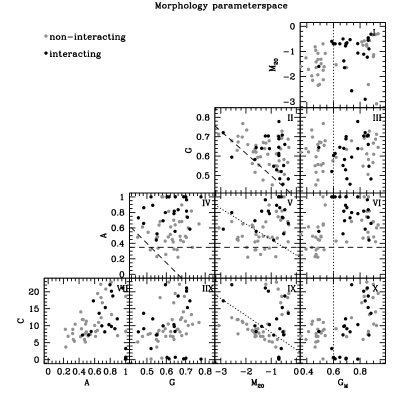
Figure 3 shows the histograms of the morphological parameters (Concentration, Asymmetry, Smoothness, Gini, and ), for interacting and non-interacting, isolated galaxies, according to Noordermeer et al. (2005b). The five galaxies marked by Swaters et al. (2002) as interacting are included. Again the interaction classification was done by a single observer, introducing some risk of a personal bias. The remainder of the Swaters et. al. sample is treated as isolated galaxies but it may contain some (mildly) interacting dwarf galaxies. In fact, given the observational result that lower mass galaxies at higher redshifts (z=0.2-1.2) show high fractions of interactions (% Bridge et al., 2007, 2010; Kartaltepe et al., 2007; Lotz et al., 2008a; Lin et al., 2008; Conselice et al., 2009; Jogee et al., 2009; Lotz et al., 2010a), the real fraction of interacting galaxies may be higher. We therefore treat the Noordermeer sample as the cleanest and consider the Swaters sample more for confirmation.
Both the CAS space and the Gini/ parameters have been used to identify morphologically disturbed galaxies in the literature and in the previous papers in this series, we established that the UV or FIR and the H i perspective trace similar structure. Thus, we expect to see some signal of interaction in many of these parameters, notably Asymmetry, and . The interacting galaxies show high values of Asymmetry (). This is somewhat higher than the cut used by Conselice (2006) for optical asymmetry; but they required as well. The interacting galaxies have higher values of ; -1, which is not too different from the cut used by Lotz et al. (2004). Direct cuts are most commonly used in these parameter spaces. Alternatively, one could define the eigenvectors of the interacting population in the combined parameter space. However, simply excluding the locus of non-interacting galaxies and including most of the merging ones is the best one can do since the interaction qualifier is a subjective and qualitative one, not a quantitative one like the tidal disturbance parameter used in Karachentsev et al. (2004) and Bournaud et al. (2005b). Swaters et al. (2002) and Noordermeer et al. (2005b) do not discern between weakly and strongly interacting. In addition, the training is likely too small to define eigenvectors. Therefore we use hard cuts in parameter space and compare how well these retrieve the fraction and objects that the Swaters and Noordermeer papers marked as interacting.
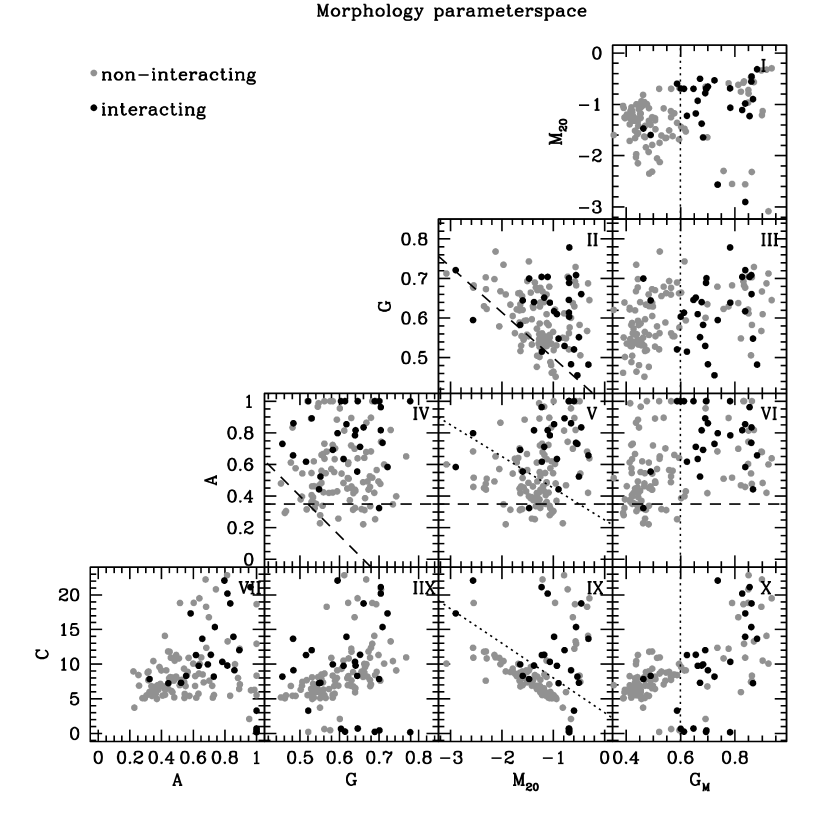
Following the example of Scarlata et al. (2007), we plot each morphological parameter against the others in Figure 4 for the combined sample and for the Swaters and Noordermeer samples separately in Figure 5. Both samples appear to occupy the same parameter space, so combining them is not an issue. Interacting galaxies are marked. Figure 3 confirms the assertion from Conselice (2003) and Lotz et al. (2004) that Asymmetry and are parameters sensitive to mergers, and our assertion in Holwerda et al. (2011b, c, 2009) that H i is a good wavelength to investigate it. We define three criteria to select mergers:
| (9) |
| (10) |
and
| (11) |
These are the dotted lines in Figures 4 and 5 (equation 9 in Panels I, III, VI and X, equation 10 in panel V and equation 11 in panel IX). We also use three criteria for these parameters defined in the literature:
| (12) |
| (13) |
and
| (14) |
With the first one from Conselice (2003) and the last two from Lotz et al. (2004, 2010b). These are the dashed lines in Figures 4 and 5, panels IV-VI, II and IV respectively.
Combined with those from the literature, we list their success rates in Table 1. From this table, it is evident that the criteria from the literature do not translate well to H i column density map morphology. These criteria select too many contaminants. In part this may be because both Gini and Concentration are linked and sensitive to how concentrated the image is. As H i maps are more extended, there is a shift in values (see paper II, Holwerda et al., 2011c). The parameter criterion performs well, selecting most interacting galaxies with but with quite some contamination, even in the Noordermeer sample (Table 1) which is the cleanest of the two. Therefore, a combination of one or more morphological parameters appears the most promising to cleanly separate an H i sample into interacting and isolated galaxies. The Asymetry- selection criterion performs better in that it selects a similar fraction of galaxies but it does not agree with either Swaters or Noordermeer estimate in the case of individual objects. It does select many more objects in the Swaters sample but as we have noted above, one can reasonable expect more dwarfs to be (mildly) interacting than the five flagged by Swaters et al. (2002). The Concentration- criterion works best as it selects a similar fraction of galaxies as the visual classification but also agrees on more cases of individual galaxies. It also agrees well with the Swaters selection of interactions. Alternatively, a Concentration-Asymmetry criterion may well work. For instance, combining any two of these criteria does not improve the selection appreciably. Combining the criterion and the C/ criterion, effectively is the latter criterion.
We intend to apply these morphological cuts on representative samples of H i observations, starting with the complete WHISP sample (Holwerda et al., 2011a). To convert these fraction into a volume merger rate, one needs to compute the representative volume of the survey and a timescale for which merging systems reside in the interaction part of parameter space. We focus on these timescales in the next paper in this series (Holwerda et al., 2011d), using SPH simulations of gas-rich 1:1 mergers.
6 Conclusions
Based on our quantified morphological analysis of 141 galaxies from Swaters et al. (2002) and Noordermeer et al. (2005b) for which they provided visual estimates of the lopsidedness and level of interaction for H i disks, we can conclude the following:
-
1.
The two-dimensional morphological parameters cannot discriminate between weak and strong lopsidedness as judged visually by previous authors. However, Asymmetry, and , and to a lesser extent Gini parameters all show a shift in the mean of the distribution of values between the lopsided galaxies and those that are not lopsided (Figure 1).
-
2.
We suggest, therefore, that these parameters can be used to assign a probability of lopsidedness (Figure 1). But future surveys should use Fourier analysis to find lopsidedness in the H i distribution.
- 3.
-
4.
Combined criteria, using Asymmetry and or Concentration and , work better (Figure 4 and 5, and Table 1) and select the right fraction of a sample of galaxies is currently undergoing interaction, as identified by visual inspection. Combined with an estimate of the time a merger is selected by these criteria, one can estimate what the merger rate in an H i survey is. The benefits of such a merger rate determination would be less observer bias than a visual classification and a empirical visibility time, determined from simulations.
7 Future Applications
The parameter space, as we applied it to the WHISP H i column density maps, allows us to find candidates for lopsidedness and more accurately define the fraction of interacting galaxies, solely from their H i morphology. It remains to be determined how long an interacting disk remains in the interaction part of the morphology parameter space. This can be addressed with the new generation of simulations of major and minor mergers currently being undertaken (e.g, Bournaud et al., 2005b; Cox et al., 2006a, b; Weniger et al., 2009; Lotz et al., 2010a, b), which include a comprehensive treatment of the interstellar matter in the galaxies during the merger. The time-scale for which a disk has a morphological interaction signature can then be determined by averaging over the many possible viewing angles. This timescale and the full WHISP sample (368 galaxies) will allow us to estimate the interaction rate of spirals locally, based purely on their H i morphology. This can serve as an additional zero-point for estimates of the merger rate at higher redshift. Upcoming nearby galaxy surveys with MeerKAT and the Widefield ASKAP L-band Legacy All-sky Blind surveY (WALLABY, Koribalski et al. in preparation) for the Southern Sky and Northern Sky Survey with APERTIF on WSRT will solidify the local Universe merger rate estimate, based on H i morphology. The future Square Kilometre Array can subsequently determine the merger rate of gas-rich galaxies over Cosmic times (up to z1 or better). The great benefit of H i surveys to determine the merger rates are the sensitivity of H i to interaction and the sensitivity of H i surveys to lower mass systems, for which the merger rate is the poorest constrained (see Lotz et al., 2010a, b).
Acknowledgements
The authors would like to thank W.C. Clarkson and J. Lotz for useful discussions and the anonymous referee for his or her careful comments and suggestions.
The work of B.W. Holwerda and W.J.G. de Blok is based upon research supported by the South African Research Chairs Initiative of the Department of Science and Technology and the National Research Foundation. A. Bouchard acknowledges the financial support from the South African Square Kilometre Array Project.
The WHISP observation were carried out with the Westerbork Synthesis Radio Telescope, which is operated by the Netherlands Foundation for Research in Astronomy (ASTRON) with financial support from the Netherlands Foundation for Scientific Research (NWO). The WHISP project was carried out at the Kapteyn Astronomical Institute by J. Kamphuis, D. Sijbring and Y. Tang under the supervision of T.S. van Albada, J.M. van der Hulst and R. Sancisi. The Westerbork on the Web project was done by P. Kamphuis. In memory of Dr. M.J. Holwerda.
References
- Abraham et al. (1994) Abraham R. G., Valdes F., Yee H. K. C., van den Bergh S., 1994, ApJ, 432, 75
- Abraham et al. (2003) Abraham R. G., van den Bergh S., Nair P., 2003, ApJ, 588, 218
- Angiras et al. (2007) Angiras R. A., Jog C. J., Dwarakanath K. S., Verheijen M. A. W., 2007, MNRAS, 378, 276
- Angiras et al. (2006) Angiras R. A., Jog C. J., Omar A., Dwarakanath K. S., 2006, MNRAS, 369, 1849
- Baldwin et al. (1980) Baldwin J. E., Lynden-Bell D., Sancisi R., 1980, MNRAS, 193, 313
- Bendo et al. (2007) Bendo G. J., Calzetti D., Engelbracht C. W., Kennicutt R. C., Meyer M. J., Thornley M. D., Walter F., Dale D. A., Li A., Murphy E. J., 2007, MNRAS, 380, 1313
- Bershady et al. (2000) Bershady M. A., Jangren A., Conselice C. J., 2000, AJ, 119, 2645
- Bertin & Arnouts (1996) Bertin E., Arnouts S., 1996, A&AS, 117, 393, provided by the NASA Astrophysics Data System
- Booth et al. (2009) Booth R. S., de Blok W. J. G., Jonas J. L., Fanaroff B., 2009, ArXiv e-prints/0910.2935
- Bournaud et al. (2005a) Bournaud F., Combes F., Jog C. J., Puerari I., 2005a, A&A, 438, 507
- Bournaud et al. (2005b) Bournaud F., Jog C. J., Combes F., 2005b, A&A, 437, 69
- Bridge et al. (2007) Bridge C. R., Appleton P. N., Conselice C. J., Choi P. I., Armus L., Fadda D., Laine S., Marleau F. R., Carlberg R. G., Helou G., Yan L., 2007, ApJ, 659, 931
- Bridge et al. (2010) Bridge C. R., Carlberg R. G., Sullivan M., 2010, ApJ, 709, 1067
- Bundy et al. (2005) Bundy K., Ellis R. S., Conselice C. J., 2005, ApJ, 625, 621
- Carilli & Rawlings (2004) Carilli C. L., Rawlings S., 2004, New Astronomy Review, 48, 979
- Conselice (2003) Conselice C. J., 2003, ApJS, 147, 1
- Conselice (2006) —, 2006, ApJ, 638, 686
- Conselice (2009) —, 2009, MNRAS, 399, L16
- Conselice et al. (2000) Conselice C. J., Bershady M. A., Jangren A., 2000, ApJ, 529, 886
- Conselice et al. (2008) Conselice C. J., Bundy K., U V., Eisenhardt P., Lotz J., Newman J., 2008, MNRAS, 383, 1366
- Conselice et al. (2009) Conselice C. J., Yang C., Bluck A. F. L., 2009, MNRAS, 361
- Cox et al. (2006a) Cox T. J., Dutta S. N., Di Matteo T., Hernquist L., Hopkins P. F., Robertson B., Springel V., 2006a, ApJ, 650, 791
- Cox et al. (2006b) Cox T. J., Jonsson P., Primack J. R., Somerville R. S., 2006b, MNRAS, 373, 1013
- de Blok et al. (2009) de Blok W. J. G., Jonas J., Fanaroff B., Holwerda B. W., Bouchard A., Blyth S., van der Heyden K., Pirzkal N., 2009, in Conference Proceedings of the ”Panoramic Radio Astronomy: Wide-field 1-2 GHz research on galaxy evolution”, June 02 - 05, 2009 Groningen, the Netherlands
- Dury et al. (2008) Dury V., De Rijcke S., Debattista V. P., Dejonghe H., 2008, ArXiv e-prints, 803
- Gini (1912) Gini C., 1912
- Haynes et al. (1998) Haynes M. P., van Zee L., Hogg D. E., Roberts M. S., Maddalena R. J., 1998, AJ, 115, 62
- Holwerda (2005) Holwerda B. W., 2005, astro-ph/0512139
- Holwerda et al. (2009) Holwerda B. W., de Blok W. J. G., Bouchard A., Blyth S., van der Heyden K., Pirzkal N., 2009, in Conference Proceedings of the ”Panoramic Radio Astronomy: Wide-field 1-2 GHz research on galaxy evolution”, June 02 - 05, 2009 Groningen, the Netherlands
- Holwerda et al. (2011a) Holwerda B. W., Pirzkal N., de Blok W. J. G., Blyth S.-L., Bouchard A., van der Heyden K. J., 2011a, MNRAS, 4, submitted
- Holwerda et al. (2011b) Holwerda B. W., Pirzkal N., de Blok W. J. G., Blyth S.-L., Bouchard A., van der Heyden K. J., Elson E. C., 2011b, MNRAS, 0, submitted
- Holwerda et al. (2011c) —, 2011c, MNRAS, 1, accepted
- Holwerda et al. (2011d) —, 2011d, MNRAS, 3, submitted
- Jog (1997) Jog C. J., 1997, ApJ, 488, 642
- Jog (1999) —, 1999, ApJ, 522, 661
- Jog & Combes (2009) Jog C. J., Combes F., 2009, Phys. Rep., 471, 75
- Jogee et al. (2009) Jogee S., Miller S. H., Penner K., Skelton R. E., Conselice C. J., Somerville R. S., Bell E. F., Zheng X. Z., Rix H., Robaina A. R., Barazza F. D., Barden M., Borch A., Beckwith S. V. W., Caldwell J. A. R., Peng C. Y., Heymans C., McIntosh D. H., Häußler B., Jahnke K., Meisenheimer K., Sanchez S. F., Wisotzki L., Wolf C., Papovich C., 2009, ApJ, 697, 1971
- Johnston (2007) Johnston S., 2007, in From Planets to Dark Energy: the Modern Radio Universe. October 1-5 2007, The University of Manchester, UK. Published online at SISSA, Proceedings of Science, p.6
- Johnston et al. (2007) Johnston S., Bailes M., Bartel N., Baugh C., Bietenholz M., Blake C., Braun R., Brown J., Chatterjee S., Darling J., Deller A., Dodson R., Edwards P. G., Ekers R., Ellingsen S., Feain I., Gaensler B. M., Haverkorn M., Hobbs G., Hopkins A., Jackson C., James C., Joncas G., Kaspi V., Kilborn V., Koribalski B., Kothes R., Landecker T. L., Lenc E., Lovell J., Macquart J.-P., Manchester R., Matthews D., McClure-Griffiths N. M., Norris R., Pen U.-L., Phillips C., Power C., Protheroe R., Sadler E., Schmidt B., Stairs I., Staveley-Smith L., Stil J., Taylor R., Tingay S., Tzioumis A., Walker M., Wall J., Wolleben M., 2007, Publications of the Astronomical Society of Australia, 24, 174
- Johnston et al. (2009) Johnston S., Feain I. J., Gupta N., 2009, in Astronomical Society of the Pacific Conference Series, Vol. 407, Astronomical Society of the Pacific Conference Series, D. J. Saikia, D. A. Green, Y. Gupta, & T. Venturi, ed., pp. 446–+
- Johnston et al. (2008a) Johnston S., Taylor R., Bailes M., Bartel N., Baugh C., Bietenholz M., Blake C., Braun R., Brown J., Chatterjee S., Darling J., Deller A., Dodson R., Edwards P., Ekers R., Ellingsen S., Feain I., Gaensler B., Haverkorn M., Hobbs G., Hopkins A., Jackson C., James C., Joncas G., Kaspi V., Kilborn V., Koribalski B., Kothes R., Landecker T., Lenc A., Lovell J., Macquart J.-P., Manchester R., Matthews D., McClure-Griffiths N., Norris R., Pen U.-L., Phillips C., Power C., Protheroe R., Sadler E., Schmidt B., Stairs I., Staveley-Smith L., Stil J., Tingay S., Tzioumis A., Walker M., Wall J., Wolleben M., 2008a, Experimental Astronomy, 22, 151
- Johnston et al. (2008b) —, 2008b, Experimental Astronomy, 22, 151
- Jonas (2007) Jonas J., 2007, in From Planets to Dark Energy: the Modern Radio Universe. October 1-5 2007, The University of Manchester, UK. Published online at SISSA, Proceedings of Science, p.7
- Karachentsev et al. (2004) Karachentsev I. D., Karachentseva V. E., Huchtmeier W. K., Makarov D. I., 2004, AJ, 127, 2031
- Kartaltepe et al. (2007) Kartaltepe J. S., Sanders D. B., Scoville N. Z., Calzetti D., Capak P., Koekemoer A., Mobasher B., Murayama T., Salvato M., Sasaki S. S., Taniguchi Y., 2007, ApJS, 172, 320
- Levine & Sparke (1998) Levine S. E., Sparke L. S., 1998, ApJ, 496, L13+
- Lin et al. (2008) Lin L., Patton D. R., Koo D. C., Casteels K., Conselice C. J., Faber S. M., Lotz J., Willmer C. N. A., Hsieh B. C., Chiueh T., Newman J. A., Novak G. S., Weiner B. J., Cooper M. C., 2008, ApJ, 681, 232
- Lotz et al. (2008a) Lotz J. M., Davis M., Faber S. M., Guhathakurta P., Gwyn S., Huang J., Koo D. C., Le Floc’h E., Lin L., Newman J., Noeske K., Papovich C., Willmer C. N. A., Coil A., Conselice C. J., Cooper M., Hopkins A. M., Metevier A., Primack J., Rieke G., Weiner B. J., 2008a, ApJ, 672, 177
- Lotz et al. (2008b) Lotz J. M., Jonsson P., Cox T. J., Primack J. R., 2008b, MNRAS, 391, 1137
- Lotz et al. (2008c) —, 2008c, ArXiv e-prints, 805
- Lotz et al. (2010a) —, 2010a, MNRAS, 404, 590
- Lotz et al. (2010b) —, 2010b, MNRAS, 404, 575
- Lotz et al. (2004) Lotz J. M., Primack J., Madau P., 2004, AJ, 128, 163
- Lovelace et al. (1999) Lovelace R. V. E., Zhang L., Kornreich D. A., Haynes M. P., 1999, ApJ, 524, 634
- Malin (1978) Malin D. F., 1978, Nature, 276, 591
- Mapelli et al. (2009) Mapelli M., Moore B., Bland-Hawthorn J., 2009, in IAU Symposium, Vol. 254, IAU Symposium, Andersen J., Bland-Hawthorn J., Nordström B., eds., pp. 40P–+
- Matthews et al. (1998) Matthews L. D., van Driel W., Gallagher III J. S., 1998, AJ, 116, 1169
- Muñoz-Mateos et al. (2009) Muñoz-Mateos J. C., Gil de Paz A., Zamorano J., Boissier S., Dale D. A., Pérez-González P. G., Gallego J., Madore B. F., Bendo G., Boselli A., Buat V., Calzetti D., Moustakas J., Kennicutt R. C., 2009, ApJ, 703, 1569
- Nilson (1973) Nilson P., 1973, Uppsala general catalogue of galaxies. Acta Universitatis Upsaliensis. Nova Acta Regiae Societatis Scientiarum Upsaliensis - Uppsala Astronomiska Observatoriums Annaler, Uppsala: Astronomiska Observatorium, 1973
- Noordermeer et al. (2001) Noordermeer E., Sparke L. S., Levine S. E., 2001, MNRAS, 328, 1064
- Noordermeer et al. (2005a) Noordermeer E., van der Hulst J. M., Sancisi R., Swaters R. A., van Albada T. S., 2005a, VizieR Online Data Catalog, 344, 20137
- Noordermeer et al. (2005b) —, 2005b, A&A, 442, 137
- Pirzkal et al. (2006) Pirzkal N., Xu C., Ferreras I., Malhotra S., Mobasher B., Rhoads J. E., Pasquali A., Panagia N., Koekemoer A. M., Ferguson H. C., Gronwall C., 2006, ApJ, 636, 582
- Ravindranath et al. (2006) Ravindranath S., Giavalisco M., Ferguson H. C., Conselice C., Katz N., Weinberg M., Lotz J., Dickinson M., Fall S. M., Mobasher B., Papovich C., 2006, ApJ, 652, 963
- Richter & Sancisi (1994) Richter O.-G., Sancisi R., 1994, A&A, 290, L9
- Rix & Zaritsky (1995) Rix H.-W., Zaritsky D., 1995, ApJ, 447, 82
- Scarlata et al. (2007) Scarlata C., Carollo C. M., Lilly S., Sargent M. T., Feldmann R., Kampczyk P., Porciani C., Koekemoer A., Scoville N., Kneib J.-P., Leauthaud A., Massey R., Rhodes J., Tasca L., Capak P., Maier C., McCracken H. J., Mobasher B., Renzini A., Taniguchi Y., Thompson D., Sheth K., Ajiki M., Aussel H., Murayama T., Sanders D. B., Sasaki S., Shioya Y., Takahashi M., 2007, ApJS, 172, 406
- Schoenmakers et al. (1997) Schoenmakers R. H. M., Franx M., de Zeeuw P. T., 1997, MNRAS, 292, 349
- Swaters & Balcells (2002) Swaters R. A., Balcells M., 2002, A&A, 390, 863
- Swaters et al. (1999) Swaters R. A., Schoenmakers R. H. M., Sancisi R., van Albada T. S., 1999, MNRAS, 304, 330
- Swaters et al. (2002) Swaters R. A., van Albada T. S., van der Hulst J. M., Sancisi R., 2002, A&A, 390, 829
- Takamiya (1999) Takamiya M., 1999, ApJS, 122, 109
- Trachternach et al. (2008) Trachternach C., de Blok W. J. G., Walter F., Brinks E., Kennicutt R. C., 2008, AJ, 136, 2720
- van der Hulst (2002) van der Hulst J. M., 2002, in Astronomical Society of the Pacific Conference Series, Vol. 276, Seeing Through the Dust: The Detection of HI and the Exploration of the ISM in Galaxies, Taylor A. R., Landecker T. L., Willis A. G., eds., pp. 84–+
- van der Hulst et al. (2001) van der Hulst J. M., van Albada T. S., Sancisi R., 2001, in Astronomical Society of the Pacific Conference Series, Vol. 240, Gas and Galaxy Evolution, Hibbard J. E., Rupen M., van Gorkom J. H., eds., pp. 451–+
- van Eymeren et al. (2011) van Eymeren J., Juette E., Jog C. J., Stein Y., Dettmar R., 2011, ArXiv e-prints
- Weniger et al. (2009) Weniger J., Theis C., Harfst S., 2009, ArXiv e-prints
- Yitzhaki (1991) Yitzhaki S., 1991, American Statistical Association, 9, 235
- Zaritsky & Rix (1997) Zaritsky D., Rix H.-W., 1997, ApJ, 477, 118