Coronal Shock Waves, EUV Waves, and Their Relation to CMEs. III. Shock-Associated CME/EUV Wave in an Event with a Two-Component EUV Transient
Abstract
On 17 January 2010, STEREO-B observed in extreme ultraviolet (EUV) and white light a large-scale dome-shaped expanding coronal transient with perfectly connected off-limb and on-disk signatures. Veronig et al. (2010, ApJL 716, 57) concluded that the dome was formed by a weak shock wave. We have revealed two EUV components, one of which corresponded to this transient. All of its properties found from EUV, white light, and a metric type II burst match expectations for a freely expanding coronal shock wave including correspondence to the fast-mode speed distribution, while the transient sweeping over the solar surface had a speed typical of EUV waves. The shock wave was presumably excited by an abrupt filament eruption. Both a weak shock approximation and a power-law fit match kinematics of the transient near the Sun. Moreover, the power-law fit matches expansion of the CME leading edge up to 24 solar radii. The second, quasi-stationary EUV component near the dimming was presumably associated with a stretched CME structure; no indications of opening magnetic fields have been detected far from the eruption region.
keywords:
Coronal Mass Ejections, Low Coronal Signatures; Coronal Mass Ejections, Initiation and Propagation; Radio Bursts, Type II; Waves, Shock1 Introduction
Large-scale wave-like transients called EUV waves or “EIT waves” are observed in extreme ultraviolet (EUV) and soft X-rays in association with coronal mass ejections (CMEs) and flares (Thompson et al., 1998; 1999). Efforts of researchers to understand the nature of EUV waves meet difficulties. The main observational material acquired with SOHO/EIT suffers from insufficient temporal coverage. Bright flare emission disfavors detection of faint EUV waves. Properties of their propagation, association with flares and metric type II bursts, etc. appear to be diverse and contradictory (e.g., \openciteBiesecker2002; \openciteKlassen2000). Deficiency of observations stimulated development of conflicting concepts based mainly on i) MHD fast-mode disturbances Thompson et al. (1999); Warmuth et al. (2001); Khan and Aurass (2002); Long et al. (2008); Gopalswamy et al. (2009) or ii) plasma compression in bases of stretching loops Delannée and Aulanier (1999); Chen et al. (2002); Chen, Fang, and Shibata (2005); Attrill et al. (2007) both caused by a CME eruption (see also \openciteZhukov2004; reviews of \openciteWillsDavey2009; \openciteGallagher2010). The former set of hypotheses (i) implies CME-related opening or reconnection of magnetic fields in the vicinity of an eruption site; the latter one (ii) assumes it to be global to describe both standing ‘EUV waves’ and those propagating over large distances.
The launch in 2006 of the twin-spacecraft Solar-Terrestrial Relations Observatory (STEREO; \openciteKaiser2008) carrying the Sun Earth Connection Coronal and Heliospheric Investigation instrument suites (SECCHI; \openciteHoward2008) significantly enhanced opportunities to study EUV waves, including their temporal coverage, with the Extreme Ultraviolet Imagers (EUVI). However, this has not lead to consensus about their nature. Several studies argued the shock-wave nature of observed EUV waves (e.g., \openciteKienreichTemmerVeronig2009; \opencitePatsourakosVourlidas2009; \opencitePatsourakos2009). Conversely, \inlineciteZhukov2009 presented an EUV wave incompatible with the fast-mode wave interpretation. Disappointing was the study of the 19 May 2007 event, which was considered both in favor of the shock-wave hypothesis Long et al. (2008); Veronig, Temmer, and Vršnak (2008); Gopalswamy et al. (2009) and against it Attrill (2010); Yang and Chen (2010) [our analysis in Paper I Grechnev et al. (2011) supports the shock-wave interpretation]. A recent analysis of an EUV wave observed in still more detail with Solar Dynamics Observatory provides more questions than answers Liu et al. (2010).
Diversity of EUV waves implies their probable relation to different phenomena Zhukov and Auchère (2004); Grechnev et al. (2008); Cohen et al. (2009). Our companion Papers I – III consider EUV waves presumably associated with coronal shock waves. Paper I shows how to reconcile shock-related EUV waves, type II bursts, and corresponding CMEs. We propose a simple quantitative description for all of these phenomena based on an approach of a self-similar shock wave. The large length of such a wave is comparable with the curvature radius of the wave front. Its deceleration is determined by the increasing mass inside the volume limited by the shock front. The self-similar approach describes propagation of strong shock waves. Our experience has revealed a convenient way to fit the kinematics of real coronal waves with direction-dependent power-law (PL) functions (abbreviated henceforth ‘shock-PL fit’). Afanasyev and Uralov (2011; Paper II) have considered the opposite limit of a weak shock calculated analytically in terms of the WKB (Wentzel – Kramers – Brillouin) approach taking account of nonlinear effects.
An eruptive event on 17 January 2010 produced a CME and wave, whose expanding three-dimensional dome with its lower skirt sweeping over the solar surface was observed in unprecedented detail by EUVI and coronagraphs on the STEREO-B spacecraft. EIT Delaboudinière et al. (1995) and LASCO Brueckner et al. (1995) instruments on SOHO also observed this transient. A weak type II burst was recorded by HiRAS (NICT, Japan) and Learmonth (US Air Force RSTN) spectrographs. \inlineciteVeronig2010 analyzed this backside event and concluded that the coronal transient observed both in EUV and white light was a dome of a ‘weakly shocked fast-mode MHD wave’. The authors found that the lateral expansion of the wave dome far from the eruption site was free, while, in their opinion, its upward expansion was driven by the CME all the time.
We analyzed this event independently and also inferred the shock-wave nature of this coronal transient. However, the scopes and some conclusions of our and \inlineciteVeronig2010 studies do not coincide. Unlike the authors, we find deceleration of both near-surface and off-limb traces of the wave. Our analysis shows that the shock wave was most likely excited by the impulsive-piston mechanism and freely propagated omnidirectionally afterwards as considered in Paper I. We study the shock wave propagation both on-disk and off-limb in comparison with the fast-mode speed () distribution and the drift rate of the type II burst. We explain the differences between our results and those of \inlineciteVeronig2010, and compare the results, which the self-similar shock approximation and modeling of a weak shock provide being applied to this event, including the wave propagation at larger distances from the Sun. We have revealed one more EUV transient, which adjoined the dimming and was quasi-stationary. This fact confirms that different kinds of “EIT waves” do exist. We analyze the observations in Section 2, compare the revealed properties of the wave with modeling results in Section 3, and summarize the outcome in Section 4.
2 Analysis of Observations
The two STEREO spacecraft were located behind the Earth and ahead of it. The eruption site shown by the flare was seen from STEREO-B at S25 E59 (heliolatitude ) and located for observers on the Earth behind the east limb with a projected position onto the visible solar surface of about S32 E55 (). The projected positions onto the visible solar surface observed from the Earth (and SOHO) and STEREO-B were close to each other. The radial CME extent and velocity were smaller by a factor of 1.13 for observers on the Earth (SOHO) with respect to observations on STEREO-B. The STEREO-A/COR1 coronagraph registered a wide transient around a position angle of (we do not consider STEREO-A or EIT data).
2.1 Eruption and a Probable Shock Wave
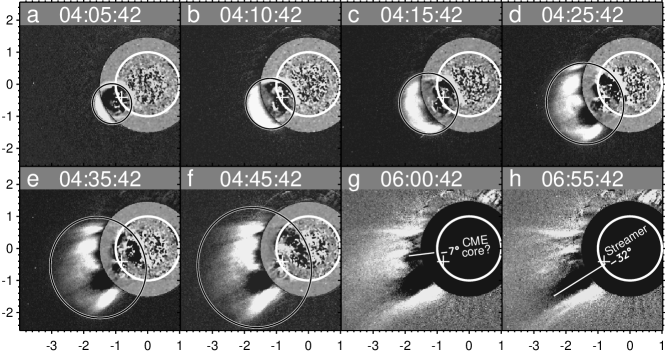
Figure 1a – d and the movie euvi_195.mpg in the electronic version of our paper show the onset of the event observed in EUVI 195 Å fixed-base ratio images. A dome-like EUV wave expanded above the limb and propagated along the solar surface. The boundary of the surface front passed into the off-limb dome suggesting their common nature. The front was followed by extended brightenings indicating a large length of the disturbance. Eruption and untwisting of a magnetic structure (probably, a filament) is seen inside the EUV wave dome. The motion of the eruption was three-dimensional. This fact, fading out of the eruption, and difficulties to distinguish it from the wave front make measurements of its kinematics unreliable. Nevertheless, it is possible to see in Figure 1a – d and in the movie that the eruption changed shape like a straightening mainspring. Its foremost edge was close to the wave front at 03:56. Thus, just an abrupt eruption of the rope structure could have played a role of an impulsive piston, which excited the wave, as was the case in events considered in Paper I.
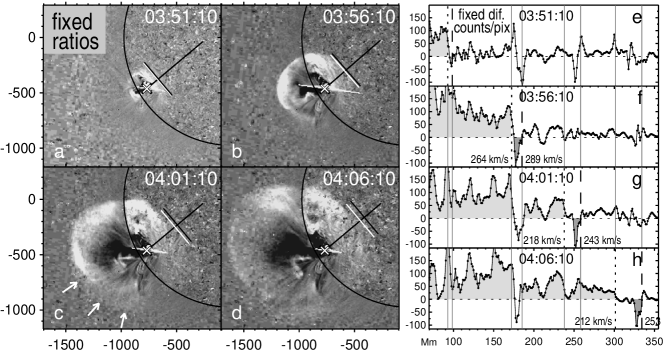
The wave front is sharpest in Figure 1b – d and Figure 4b just to the left from the eruption site (slanted cross) in the plane of the sky, while the fastest faint part of the front indicated by the white arrows in Figure 1c is closer to the radial direction. The sharper appearance of the front in the leftwards direction could be due to overlap with expanding loops and a stronger shock in this direction. The latter effect is consistent with the predominant upwards motion of the eruption. The faintness of the front in the South Pole’s environment is due to the closeness of the polar coronal hole, where the Alfvén velocity is much higher (Figure 4h). One more outcome is free propagation of the wave in the radial direction, where the front moved ahead of possible loops (Figure 1c).
Figure 1e – h shows plane-of-sky spatial profiles computed from the four fixed-difference 195 Å images within sectors of along the directions indicated with the black lines. The profiles show a relief constituted by variations of compact features. The chosen direction crosses features, which seem to have responded to the pass of the wave front. The EUV wave brightening appears in the profiles as an enhancement (light shading) to the left from the front (dotted). All the profiles show compact darkenings (dashed, darker shading) preceding the brightenings. The darkening and brightening regions in Figure 1e seem to be imperfectly resolved, which reduces the depth of the narrow darkening. The dashed and dotted lines in Figure 1e – h correspond to the black and white bars in Figure 1a – d. Comparison of all the panels e – h with each other reveals slightly variable compact features at the four fixed positions, where the front presumably showed up. Hits by a shock front probably disturbed the features, producing the sharp effect suggested by the profiles, but not a gradual elevation. The EUVI pixel size (small circles show the samples) was km; with exposure times of 16 s, a step-like front moving with plane-of-sky speeds shown in Figure 1f – h must be caught in 3 – 4 pixels. Thus, just such a response to a shock front is expected.
Comparison of the profiles with the quiet Sun’s level of about 290 counts/pixel shows that if this marginal effect was real, then its value could only be due to disturbance of low structures. The fact that the probable response of different solar features matched arrival of the wave front at different times indicates that the observed effect deserves attention to be checked in other events.
After the pass of the wave front, small features like coronal bright points got disturbed, but did not disappear (see also the euvi_195.mpg movie). This implies that closed magnetic fields in these configurations did not open. No irreversible changes are seen. No signatures of magnetic reconnection are detectable.
The plane-of-sky velocities of the presumable fronts systematically decreased, despite their propagation from the near-the-limb eruption site towards the solar disk center, that must increase the projected speed. The surface velocities estimated along an appropriate great circle all exceeded 390 km s-1 initially and all were less than 290 km s-1 finally, which indicates deceleration of the wave.
2.2 Global EUV Wave Fronts
We divided the problem of identifying the wave fronts into two tasks: 1) identification of global fronts and 2) analysis of smaller-scale properties of the EUV wave propagation (next Section). We reveal global wave fronts from ratios of running-difference images to preceding ones. To detect weak portions of the fronts, the images were rebinned to pixels and deeply filtered using smoothing with a boxcar, a median smoothing, and displayed by means of the sigrange SolarSoftware routine. The result is shown in Figure 2 (eight of 12 images used with a total coverage of 55 min). We separately outlined the on-disk and off-limb parts of the fronts with red and pink ovals, trying to catch their outermost envelopes over a maximal spatial extent. The distances were measured along the green great circle. The technique used by \inlineciteVeronig2010 was more sensitive. They analyzed spatial profiles computed within some sectors and searched for their foremost edges close to the visually identified fronts. The blue contours approximately reproduce the fronts, which the authors identified.
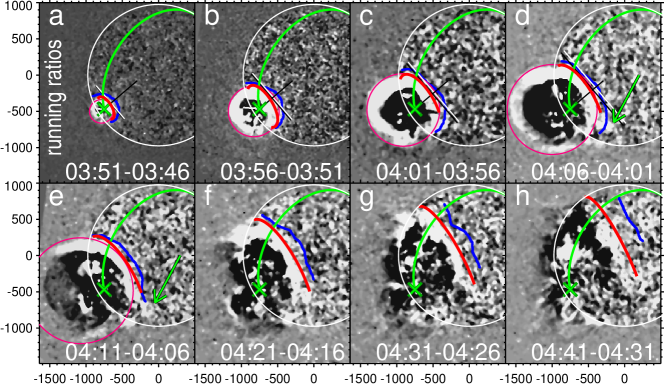
Figure 2 shows the following facts. 1) The fronts identified by Veronig et al. all lead our fronts with increasing separation. 2) The southern part of the front indicated by the arrows in Figure 2d, e moved considerably faster in the environment of the polar coronal hole, while the fronts themselves were difficult to detect there. 3) The wave dome expanded non-radially: with the southeastern position of the eruption site, expansion of the dome was pointed almost exactly to the left in the plane of the sky. Also, the projection of the off-limb dome center onto the solar surface increasingly shifted northeast, so that the fronts in later images were not parallel to the earlier ones (cf., e.g., Figure 2d and 2h).
The lag of the red fronts behind the blue ones is initially small and nearly constant, and then increases. Since the speed of the blue fronts was constant Veronig et al. (2010), this behavior implies deceleration of the red fronts. Indeed, our distance-time plots in Figures 7b, 8b (red symbols) show deceleration. The plots are well fitted with PL functions expected for a shock wave (see Paper I):
| (1) |
where and are current time and distance, = 03:47:48 is the wave start time (estimated in sequential attempts to fit the EUV wave and the type II burst), and correspond to one of the measured fronts, and the PL exponent with being a density falloff index in this formal approximation. We fitted the kinematics of the wave front with an exponent of () for the surface propagation and () for the off-limb expansion.
The measurements of the velocities along the great circle have largest uncertainties at earliest stages of the wave expansion, and for the initial interval of 15 min we also used 171 Å images observed with a higher imaging rate. The velocity corresponding to a power-law distance-time plot has a singularity in the origin and is not limited from below by at large distances. Hence, the parameter is expected to be slightly different for long and short time intervals beginning with (actually 55 min for 195 Å images and 15 min for 171 Å ones).
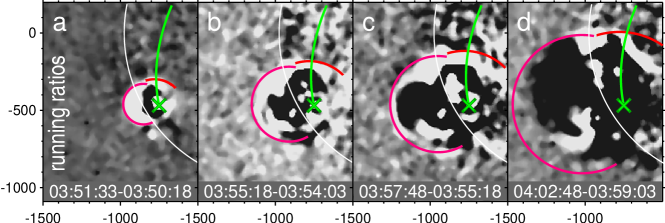
Figure 3 presents four of 12 EUVI 171 Å images which we used. Since the shock-PL fit applies, we used its parameters found from the 195 Å data as an initial estimate and endeavored to outline each of the on-disk and off-limb wave portions with ovals calculated from the shock-PL fit according to the observation times at 171 Å. The parameter was adjusted to match the fronts. If some parts of the fronts were not detectable, we used their other possible signatures. An extreme example is shown in Figure 3d. Here the reference regions for the off-limb oval were the upper (in the plane of the sky) brightening just above the limb and three faint lowermost compact regions. The on-disk oval was referred to the bright feature crossing the limb and a small portion of the front next to the former feature. The results of the measurements shown in Figures 7b and 8b with blue triangles are fitted with for the off-limb dome and for the surface propagation (blue curve). The difference between found from the 195 Å and 171 Å images is detectable in the velocity-time plot in Figure 8c.
The measurements based on outline of entire wave fronts reveal some indistinct effects such as the motion of the wave center and provide tighter uncertainties than, e.g., measurements of a fastest front portion do. Preconditioning with an expected analytic function still tightens the uncertainties. Estimating them is not a simple task. One way is to find the extreme envelopes enclosing possible options of the outline, but it is time consuming. We alternatively assumed extreme uncertainties of the front identification of 1.5 minor ticks (110 Mm) in the latest 195 Å images and twice lesser ones at 03:56. The uncertainty in estimated from the type II burst was assumed to be s. The resulting gray scatter bands in Figure 8b, c for the surface distance and velocity plots vs. time correspond to . The assumed uncertainties of the front identification appear to be well overestimated; realistic bands should be considerably narrower.
2.3 EUV Wave Components and Fast-Mode Speed Distribution
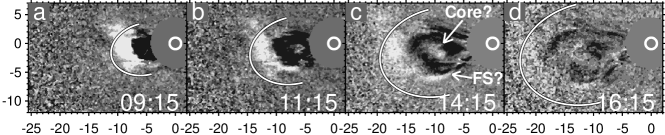
Running difference images are best suited to emphasize outermost fronts, but inner quasi-stationary features do not show up in such images. The EUV wave in this event is well visible in fixed-base ratio EUVI 195 Å images in Figure 4a – g allowing us to see what happened behind the expanding front. The whole large-scale brightening consisting of small patches was wide and complex. The outer propagating front included another, inner EUV transient. After an initial evolution, its on-disk part adjoining the dimming became stationary. Its brightness initially was comparable with the outer front and exceeded it later on. The inner component appears to have consisted of two parts distinguishable in Figure 4f,g and in the movie, with the northern part slowly moving northeast.
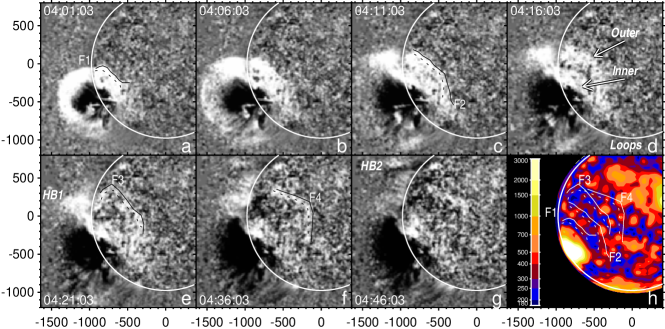
An off-limb brightening (HB1) visible up to 290 Mm above the inner component slowly expanded northwards along the limb for about half an hour following the outer front. This brightening could be due to a portion of the outer front sweeping over the backside part of the solar surface.
A high-altitude brightening HB2 (Figure 4f, g) at about 230 Mm appeared when the wave front reached it suggesting that a lower dense part of a coronal streamer highlighted the front. Long loops connecting the active region with a southwestern area (‘Loops’ in Figure 4d) also highlighted the wave. Most of the loops outside of the active region did not show any stretch, although the wave front passed through these loops. These facts support a wave nature of the outer EUV wave. There are no manifestations of magnetic field opening aside of the eruption region, where, however, the outer EUV wave was visible. The limited magnetic field opening is also confirmed by the confined coronal dimming region in Figure 4 that was first stated by \inlineciteVeronig2010. Just the stationary inner brightening appears to be related to a stretched CME structure.
The conclusion of \inlineciteYangChen2010 that ‘…EIT wave propagates more slowly in the regions of stronger magnetic field’ inspired us to compare near-surface EUV wave manifestations with the distribution ( with the sound speed is assumed to be 180 km s-1 everywhere). We calculate from the magnitude of the magnetic field, which determines the Alfvén speed rather than any magnetic component. The magnetic field was extrapolated to 30 Mm from a SOLIS magnetogram observed at 19:30 on 20 January using potential approximation Rudenko (2001). A simplest way to obtain a distribution is to assume a constant temperature and to take densities, e.g., from the Saito model. We attempt to get a somewhat more realistic density distribution using a SOHO/EIT 195 Å image observed on 20 January and an expression obtained by \inlineciteBrosius2002 in a study of a particular region ( is the electron density, is the brightness in the 195 Å EIT channel). This expression cannot be universal, because the EUV brightness, , depends on the depth . However, depends on the depth weakly, , and we restricted the density above quiet regions by limiting plasma beta (see, e.g., \openciteWarmuthMann2005). The resulting distribution is presented in Figure 4h (the highest-speed values above the active region are limited by km s-1 to reveal low-speed regions throughout the solar disk). This distribution is not accurate for the following reasons. Most likely, the high-speed area in the active region was smaller on 17 January than the three-days later magnetogram shows. The density could be underestimated there, thus somewhat increasing . We cannot untangle the height dependence of the density distribution from an EUV image of the solar disk. These inaccuracies are not essential for our results.
The shock formation time can be estimated from this distribution. A disturbance caused by an impulsive filament eruption steepens into a shock presumably in a region of a sharp falloff of due to jam of the wave profile. With a half-width of the high-speed area above the active region (white area in Figure 4h) of about 100 Mm, the shock must form in the lateral direction within one minute [consistent with the estimate of \inlineciteGrechnev2008 for a different event]. With the wave onset time 03:47:48, this estimate is consistent with the fact that the type II burst was observed as early as 03:51 indicating that the shock already existed in the upwards direction at that time.
The on-disk EUV wave was distinct in an area between the active region and a large northeastern high-speed domain. km s-1 dominated there. The surface EUV wave speed was from 300 – 325 km s-1 at 04:01 to 240 – 270 km s-1 (see Figure 8c) at it latest observation. Thus, the near-surface portion of the wave front was, most likely, in the weak shock regime in regions of low and propagated almost as a linear fast-mode wave in regions of increased .
Four distinct portions of the EUV wave fronts F1 – F4 are outlined both in EUVI images (Figure 4a, c, e, f) and on the distribution (Figure 4h). The solid lines trace the foremost fronts; the dotted lines trace their brightest parts. Comparison shows that the EUV wave was brightest in regions of lowest . The boundary of the EUV wave corresponded to regions, where increased. Portions of the fronts located in regions of increased stretched and lost brightness. Fronts sharpened, brightened and suspended motion in regions of low . Some suspended front portions are detectable in two or even more images. Practically the same front F4 persists in Figure 4f, g. The euvi_195.mpg movie shows other examples. The southern branch of front F2 is detectable at 04:06 – 04:16. The northern bend of front F3 is visible at 04:21 and 04:26. That is, the small-scale distribution did not determine the overall kinematics of the wave (see Figure 2), but affected the brightness and sharpness of the wave front. Indeed, the Mach number increases in regions of reduced , , i.e., the plasma compression is stronger.
These facts agree with the perturbation profile evolution revealed by \inlineciteVeronig2010 in averaging over a spherical sector of : the profile initially increased in magnitude and sharpened until 04:01, and thereafter evolved in the reverse manner. Since the shock most likely appeared 10 min before 04:01, the observed steepening was not due to the shock formation. The sharpest and brightest front found by the authors at 04:01 corresponds to our front F1 (Figure 4a, h), which was mostly aligned with a deep valley in the distribution. \inlineciteVeronig2010 estimated the Mach number averaged over the F1 front to be 1.15; we estimate that locally it could reach 1.5. Later on, the shock probably dampened, as the authors concluded. Besides, the depth, homogeneity, and orientation of each subsequent valley relative to the wave front and to the measurement direction were not as favorable as in the first valley. Dispersion of the front over increasing width of the authors’ measurement sector also increased.
Thus, kinematics of the shock wave was governed by the large-scale distribution: the wave ran much faster in the polar coronal hole and its environment. Conversely, when the wave expanded enough to exceed compact structures, the effect of the small-scale near-surface distribution of was more pronounced in sharpness and brightness of the EUV wave than in its local speed.
The two EUV wave components in this event remind us of two disturbances in Fig. 7 from \inlineciteChen2005. One disturbance is a compressive effect due to opening magnetic fields during the CME lift-off as initially proposed by \inlineciteDelannee1999. This disturbance moves slowly and stops at a magnetic separatrix. Such influence of the CME lift-off on magnetic fields is expected to diminish at distances well exceeding the initial size of an eruptive magnetic rope suggested by the post-eruptive arcade and the major deep stationary dimmings nearby (if the CME does not involve magnetic fields connected to remote active regions). The second, a faster disturbance is a trail of a coronal shock wave sweeping over the solar surface. With the qualitative and quantitative properties of the outer propagating disturbance revealed by \inlineciteVeronig2010 and in this Section, it is difficult to imagine an alternative to its interpretation as a trail of a coronal shock wave. The presence of both predicted wave and non-wave components of the EUV transient in this event offers a promising opportunity to settle debates over the nature of EUV waves.
2.4 White-light Coronal Transient Observed with COR1 and LASCO/C3
Figure 5 shows eight STEREO-B/COR1 images of a coronal transient. An image observed at 03:50 was subtracted from all others. The ovals outlining the edge of the transient correspond to the shock-PL fit with the same = 03:47:48. To coordinate the ovals with the non-radially expanding transient (Section 2.2), their centers are increasingly shifted and different expansion factors are used in the radial direction and the transversal one , i.e., the front tended to become oblate. The ovals match the fronts in EUVI images and cling to the outermost edges of the transient. The leading edge decelerated as a freely propagating shock wave. The foremost part looks like a plasma flow streaming along the fan of coronal rays. CME structures are surmised well behind the leading edge. This picture suggests the plasma flow successively involved into the motion by a freely propagating shock front, whose speed was the phase velocity of the involvement. A structure at an angle of () in Figure 5g, h might be the CME core. The density-depleted major streamer appears in difference images as a wide radial darkening around ().
We consider LASCO/C3 images only (C2 data became available later). Figure 6 presents four of 12 images, in which the CME is detectable. Probable frontal structure and core are indicated in Figure 6c. A ragged, diffuse presumable plasma flow seems to be present ahead. We outlined the CME with an oval corresponding to expansion of the shock wave. The ovals in Figure 6 calculated according to the shock-PL fit with the same start time 03:47:48 and embrace the CME but the fastest feature at , most likely of a non-wave nature. Rather poor observations and the low CME speed ( km s-1) do not allow us to find out if the change of its shape was due to effects of the shock propagation or acceleration of the solar wind. Nevertheless, the shock-wave kinematics does not contradict even LASCO/C3 observations up to .
2.5 Expansion of the Wave Dome and the Type II Burst Drift Rate
Figure 7a shows a dynamic spectrum combined from HiRAS and Learmonth records. The type II burst had a single band most likely corresponding to the second harmonic, because the fundamental emission must be strongly refracted due to the far backside location of the eruption site. \inlineciteVeronig2010 came to the same conclusion. The drift of the burst is well outlined with the PL model and the same wave start time = 03:47:48. The dashed outline corresponds to a presumable fundamental emission.
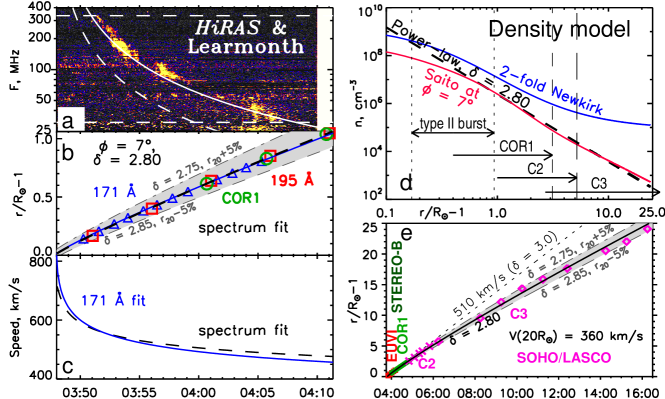
We consider the direction matching the sharpest part of the EUV wave front non-radially expanding above the limb and a probable CME core in Figure 5g. Figure 7b shows measurements of the wave dome from EUVI 171 Å and 195 Å images along with a shock-PL fit of the 171 Å data and the frequency drift converted into the height-time plot. Figure 7c shows speed-time plots corresponding to the 171 Å fit and the type II burst. Figure 7d presents our PL density model, the \inlineciteNewkirk1961 model, and the \inlineciteSaito1970 model at . The PL model is close to the 2-fold Newkirk model at the onset of the type II burst and later approaches the Saito model. The difference with the Newkirk model here, unlike the events addressed in Paper I, might be due to the non-radial wave expansion. The arrows show the height ranges corresponding to the type II burst and fields of view of coronagraphs.
Figure 7e shows an overall height-time plot including measurements from the SOHO LASCO CME Catalog (Yashiro et al., 2004, http://cdaw.gsfc.nasa.gov/CME˙list/) at up to . To coordinate the measurements at different position angles from two different vantage points of STEREO-B and SOHO, all the distances from the CME Catalog are increased by 4.2%. The shock-PL fit with corresponding to the Saito model matches all the data. The boundaries of the gray band in Figure 7b, e covering all the measurements in the Catalog correspond to , , and 03:47:48 s in expression (1). This band presents the scatter of measurements in the CME Catalog in terms of uncertainties of the shock-PL fit.
Deceleration of the wave is not pronounced within (Figure 7b). This explains why \inlineciteVeronig2010 found a constant wave speed of 650 km s-1 in the radial direction (). The linear-fit speed in the direction was 510 km s-1. Deceleration of the wave becomes detectable from COR1 measurements up to from the eruption site. In fact, this determines the measurement accuracy of ( for the constant speed). The dotted line in Figure 7e is a constant-speed plot extrapolating the linear fit in Figure 7b.
The fact that the shock-PL fit matches expansion of the slow coronal transient up to , where its speed became comparable with the solar wind speed, suggests that the leading wave and the trailing piston were not completely independent. Synergy between the piston and wave discussed in Paper I (Section 4.3) is indeed expected to become pronounced at large distances from the Sun.
3 Discussion
The detailed STEREO/SECCHI observations of the EUV wave allow us to compare the results of the shock-PL fit proposed in Paper I with those of the weak shock modeling described in Paper II (hereafter WS model). The EUV wave propagated mainly over quiet Sun’s regions without large-scale features except for the polar coronal hole. Since the EUV wave most likely was a near-surface trail of a large-scale coronal MHD wave, its kinematics should not be significantly affected by small-scale inhomogeneities, as the observations confirm (Section 2.3). We describe the global propagation of the EUV wave outside of the active region assuming only radial variations of coronal plasma parameters. The on-disk EUV wave decelerated from to km s-1 (Section 2.1); \inlineciteVeronig2010 found broadening of the wave profile. These facts along with estimates of in the lower corona above the quiet Sun indicate that the shock was weak to moderate, so that the WS model appears to apply.
The model is not yet able to incorporate coronal magnetic fields extrapolated from real magnetograms. We therefore model kinematics of only an on-disk wave running over the quiet Sun. We use the barometric density falloff of isothermal coronal plasma cm-3 with coronal temperature MK ( km s-1), and the radial magnetic field model G. km s-1 at 40 Mm and increases upwards. We assume that the wave originates at an initial surface as large as 200 Mm, inside which the wave source is located. Then an EUV wave front can be observed at 03:51. The model shock wave has an initial length of 80 Mm and an amplitude of ( corresponds to the source height of 80 Mm). We search for EUV signatures of the coronal wave at a height of 40 Mm.
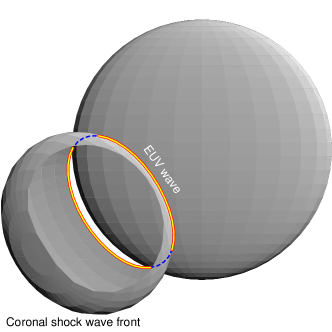
Figure 8 shows some results of the modeling and the measurements. Figure 8a presents the computed 3D shock front. The color rim is the section of the wave dome at 40 Mm. The on-disk EUV front could be partly covered by the dome. Figure 8b shows the distance-time plots of the on-disk EUV front measured at 195 Å (red squares) and 171 Å (blue triangles). The red and blue lines show the corresponding shock-PL fit; the black line presents model results. Figure 8c shows the velocity-time plots obtained by differentiating of the shock-PL curves and the modeled plot. The EUV wave appreciably decelerates due to damping and then slightly accelerates because of an increasing tilt of the front to the solar surface that is discussed in Paper II. The deviation of the speed supplied by the shock-PL fit from the result of the WS modeling does not exceed 15%.
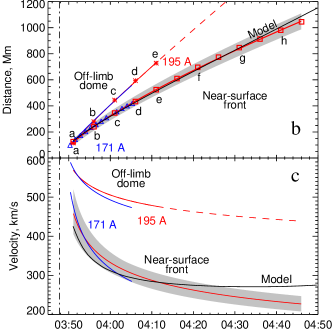
a
We have also modeled propagation of a shock wave upwards. Active regions determine a distribution in their vicinities. To simulate this effect, we have added a radial magnetic dipole into our radial magnetic field model as \inlineciteWarmuthMann2005 did. A ‘horizontal’ dipole seems to conform to the active region on 17 January. Embedding such a dipole into the model results in strongly anisotropic distribution in the corona with a domain of very low near a null point of the magnetic field and that of enhanced . This causes asymmetric wave front propagation actually observed in this event. However, the domain of influence of a ‘horizontal’ dipole is too large, comparable with the solar hemisphere, whereas an estimate from the extrapolated magnetic field shows it to be rather compact along the solar surface ( Mm). Therefore, we employ the ‘parallel’ dipole of \inlineciteWarmuthMann2005, which provides a compact domain of enhanced . We adjust the height falloff of the magnetic field above the active region following \inlineciteGary2001, but decrease the magnetic field strength to obtain a realistic distribution with model parameters used.
Figure 9 shows model results. The wave source is located above the limb in the equatorial plane. The shock front is oblate in the radial direction presumably due to dominating upwards increase of : ray trajectories are refracted into regions of lower . The effect agrees with the COR1 observations (Figure 5). The speed of the upwards wave expansion is about twice higher than that of the on-disk EUV wave (Figure 9b). This confirms our suggestion in Paper I to overcome the absence of correlation between the speeds of EUV waves and exciters of type II bursts stated by \inlineciteKlassen2000.

a b
The twice-higher upwards speed of the EUV wave relative to the on-disk one prompted \inlineciteVeronig2010 that the upward dome expansion was driven all the time by the CME. The authors mentioned that the upward-lateral speed difference could be due to direction-dependent falloffs of , but preferred the CME-driven option seemingly favored by the limited lateral extent of the dimming. However, the latter fact only means that CME-related opening magnetic fields occurred in a limited region and did not involve remote regions. The major expansion of all CMEs is radial, but this fact does not guarantee that all CME-associated shocks are driven continuously (see Paper I).
The speed difference in Figure 9 was obtained for a freely propagating wave and the direction-dependent above the active region. The front shapes match the observations. The results agree with our considerations and measurements in Paper I and support the scenario of an impulsively generated freely propagating weak shock wave (see also \opencitePomoellVainioKissmann2008).
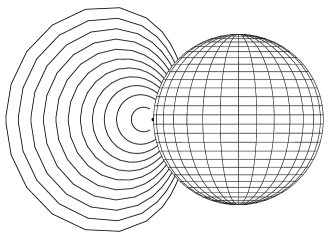
The WS modeling explains the disaccord between the EUV wave fronts identified by us and \inlineciteVeronig2010: our red fronts in Figure 2 lag behind the blue ones identified by the authors. The difference is most likely due to a projection effect combined with a different sensitivity of measurements as Figure 10 explains. Plasma is compressed by the shock front over the whole its surface. The largest column emission measure of the compression region is near the solar surface, where the plasma density is higher. \inlineciteVeronig2010 probably detected a high-altitude outermost edge of the convex wave front. Figure 10a demonstrates the calculated 2D cross section of the wave front with its outermost edge at a height of . Figure 10b presents a portion of the modeled wave front. Figure 10c shows the calculated on-disk projections of the faint leading edge and the main bright EUV wave front corresponding to about 04:30. The situation resembles the seemingly disaccord between the results of \inlineciteWarmuth2004a and \inlineciteWhiteThompson2005 discussed in Paper I for a similar reason, i.e., the convex shape of the wave front and its tilt towards the solar surface.
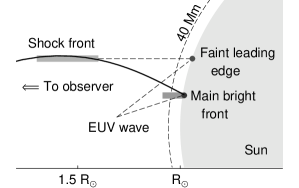
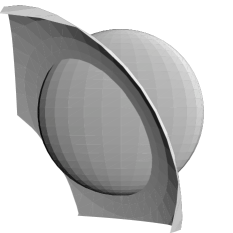

a b c
4 Summary and Concluding Remarks
Our analysis has confirmed the major conclusion of \inlineciteVeronig2010 that both the on-disk EUV wave and the dome expanding above the limb were due to a coronal shock wave. In addition to the authors’ arguments, we have established that (1) the front shape and its changes, (2) kinematics of both the on-disk front and the off-limb dome up to , and even (3) the difference between our and the authors’ measurements all corresponded to expected propagation of a shock wave. We have also found that, in agreement with the shock-wave hypothesis, kinematics of the global wave front (4) corresponded to the drift rate of the type II burst and (5) was controlled by large-scale distribution of the fast-mode speed, while its local inhomogeneities affected the brightness and sharpness of the EUV wave, e.g., it was brightest in loci of the fast-mode speed minima.
We do not see any support to the presumption of \inlineciteVeronig2010 that the shock wave was driven by the CME all the time. On the contrary, we consider the shock wave to be excited by an impulsively erupting magnetic rope structure and freely propagating afterwards like a decelerating blast wave. This scenario has been argued and observationally confirmed in Paper I. All the conclusions listed in the preceding paragraph are based on considerations and modeling of freely propagating shock waves. The free wave propagation is also consistent with the fastest expansion of its front in EUVI images in the radial direction, while CME structures apparently lagged behind the wave front.
The shock in this event was most likely weak, at least, near the solar surface, in agreement with the conclusion of \inlineciteVeronig2010. Model calculations for a weak shock match observations. Nevertheless, the power-law fit (formally derived under assumption of a strong self-similar shock wave with continuously increasing mass) provides reasonable results starting from the early shock appearance up to latest detectable signatures of the on-disk EUV wave, and even up to distances from the Sun, although with somewhat variable parameters.
We have additionally revealed another large-scale EUV brightening, which was quasi-stationary. No manifestations of magnetic field opening were found outside of the eruption region, while the propagating on-disk EUV wave was well visible there. The presence in this event of the two different EUV components predicted by models offers a promising opportunity to reconcile conflicting opinions about the nature of “EUV waves”: the propagating EUV wave was of a shock-wave nature for sure, and the quasi-stationary EUV transient was presumably associated with a stretching CME structure.
We specify the conclusion of \inlineciteVeronig2010 that the dome observed in white light was not the CME. Indeed, the leading part most likely was not a magnetoplasma CME component. Coronagraph images, their shock-PL fit, and our considerations indicate that this was a plasma flow successively involved into the motion by the freely propagating shock front. The plasma flow was slower than the shock front, whose speed was the phase velocity of this involvement. Thus, the leading part of the transient was a plasma flow, i.e., a coronal mass ejection by definition, but it was a shock-driven plasma flow.
Acknowledgements
We thank M. Temmer, A. Warmuth, and P.-F. Chen for fruitful discussions and S. Kalashnikov for the assistance in data processing. We thank an anonymous reviewer for useful remarks. We thank the teams operating all instruments whose data are used here for their efforts and open data policies: the ESA & NASA SOHO/EIT & LASCO and STEREO/SECCHI telescopes; the NICT HIRAS (Japan), the IPS Radio and Space Services Learmonth Observatory (Australia), and the USAF RSTN radio telescopes. We appreciatively use the CME catalog generated and maintained at the CDAW Data Center by NASA and the Catholic University of America in cooperation with the Naval Research Laboratory. SOLIS data used here are produced cooperatively by NSF/NSO and NASA/LWS. The research was supported by the Russian Foundation of Basic Research under grant 09-02-00115.
References
- Afanasyev and Uralov (2011) Afanasyev, A. N., Uralov, A. M.: 2011, Sol. Phys. In this issue. DOI: 10.1007/s11207-011-9730-9.
- Attrill (2010) Attrill, G. D. R.: 2010, ApJ 718, 494.
- Attrill et al. (2007) Attrill, G. D. R., Harra, L. K., van Driel-Gesztelyi, L., Démoulin, P.: 2007, ApJ 656, 101.
- Biesecker et al. (2002) Biesecker, D. A., Myers, D. C., Thompson, B. J., Hammer, D. M., Vourlidas, A.: 2002, ApJ 569, 1009.
- Brosius et al. (2002) Brosius, J. W., Landi, E., Cook, J. W., Newmark, J. S., Gopalswamy, N., Lara, A.: 2002, ApJ 574, 453.
- Brueckner et al. (1995) Brueckner, G. E, Howard, R. A., Koomen, M. J., Korendyke, C. M., Michels, D. J., Moses, J. D., et al.: 1995, Sol. Phys. 162, 357.
- Chen, Fang, and Shibata (2005) Chen, P. F., Fang, C., Shibata, K.: 2005, ApJ 622, 1202.
- Chen et al. (2002) Chen, P. F., Wu, S. T., Shibata, K., Fang, C.: 2002, ApJ 572, 99.
- Cohen et al. (2009) Cohen, O., Attrill, G. D. R., Manchester, W. B., IV., Wills-Davey, M. J.: 2009, ApJ 705, 587
- Delaboudinière et al. (1995) Delaboudinière, J.-P., Artzner, G. E., Brunaud, J., Gabriel, A. H., Hochedez, J. F., Millier, F. et al.: 1995, Sol. Phys. 162, 291.
- Delannée and Aulanier (1999) Delannée, C., Aulanier, G.: 1999, Sol. Phys. 190, 107.
- Gallagher and Long (2010) Gallagher, P. T., Long, D. M.: 2010, Space Sci. Rev. 127.
- Gary (2001) Gary, G. A.: 2001, Sol. Phys. 203, 71.
- Gopalswamy et al. (2009) Gopalswamy, N., Yashiro, S., Temmer, M., Davila, J., Thompson, W. T., Jones, S., McAteer, R. T. J., Wuelser, J.-P., Freeland, S., Howard, R. A.: 2009, ApJ 691, 123.
- Grechnev et al. (2008) Grechnev, V. V., Uralov, A. M., Slemzin, V. A., Chertok, I. M., Kuzmenko, I. V., Shibasaki, K.: 2008, Sol. Phys. 253, 263.
- Grechnev et al. (2011) Grechnev, V. V., Uralov, A. M., Chertok, I. M., Kuzmenko, I. V., Afanasyev, A. N., Meshalkina, N. S., Kalashnikov, S. S., Kubo, Y.: 2011, Sol. Phys. In this issue.
- Howard et al. (2008) Howard, R. A., Moses, J. D., Vourlidas, A., Newmark, J. S., Socker, D. G., Plunkett, S. P., Korendyke, C. M., Cook, J. W. et al.: 2008, Space Sci. Rev. 136, 67.
- Kaiser et al. (2008) Kaiser, M. L., Kucera, T. A., Davila, J. M., St. Cyr, O. C., Guhathakurta, M., Christian, E.: 2008, Space Sci. Rev. 136, 5.
- Khan and Aurass (2002) Khan, J. I., Aurass, H.: 2002, A&A 383, 1018.
- Kienreich, Temmer, and Veronig (2009) Kienreich, I. W., Temmer, M., Veronig, A. M.: 2009, ApJ 703, 118.
- Klassen et al. (2000) Klassen, A., Aurass, H., Mann, G., Thompson, B. J.: 2000, A&AS 141, 357.
- Liu et al. (2010) Liu, W., Nitta, N. V., Schrijver, C. J., Title, A. M., Tarbell, T. D.: 2010, ApJ 723, 53.
- Long et al. (2008) Long, D. M., Gallagher, P. T., McAteer, R. T. J.. Bloomfield, D. S.: 2008, ApJ 680, 81.
- Newkirk (1961) Newkirk, G. Jr.: 1961, ApJ 133, 983.
- Patsourakos and Vourlidas (2009) Patsourakos, S., Vourlidas, A.: 2009, ApJ 700, L182.
- Patsourakos et al. (2009) Patsourakos, S., Vourlidas, A., Wang, Y. M., Stenborg, G., Thernisien, A.: 2009, Sol. Phys. 259, 49.
- Pomoell, Vainio, and Kissmann (2008) Pomoell, J., Vainio, R., Kissmann, R.: 2008, Sol. Phys. 253, 249.
- Rudenko (2001) Rudenko, G. V.: 2001, Sol. Phys. 198, 5.
- Saito (1970) Saito, K.: 1970, Ann. Tokyo Astr. Obs. 12, 53.
- Thompson et al. (1998) Thompson, B. J., Plunkett, S. P., Gurman, J. B., Newmark, J. S., St. Cyr, O. C., Michels, D. J.: 1998, Geophys. Res. Lett. 25, 2465.
- Thompson et al. (1999) Thompson, B. J., Gurman, J. B., Neupert, W. M., Newmark, J. S., Delaboudinière, J.-P., St. Cyr, O. C., Stezelberger, S., Dere, K. P. et al.: 1999, ApJ 517, 151.
- Veronig et al. (2010) Veronig, A. M., Muhr, N., Kienreich, I. W., Temmer, M., Vršnak, B.: 2010, ApJ 716, 57.
- Veronig, Temmer, and Vršnak (2008) Veronig, A. M., Temmer, M., Vršnak, B.: 2008, ApJ 681, 113.
- Warmuth and Mann (2005) Warmuth, A., Mann, G.: 2005, A&A 435, 1123.
- Warmuth et al. (2001) Warmuth, A., Vršnak, B., Aurass, H., Hanslmeier, A.: 2001, ApJ 560, 105.
- Warmuth et al. (2004) Warmuth, A., Vršnak, B., Magdalenić, J., Hanslmeier, A., Otruba, W.: 2004, A&A 418, 1101.
- Wills-Davey and Attrill (2009) Wills-Davey, M. J., Attrill, G. D. R.: 2009, Space Sci. Rev. 149, 325.
- White and Thompson (2005) White, S. M., Thompson, B. J.: 2005, ApJ 620, 63.
- Yang and Chen (2010) Yang, H. Q., Chen, P. F. 2010, Sol. Phys. 266, 59.
- Yashiro et al. (2004) Yashiro, S., Gopalswamy, N., Michalek, G., St. Cyr, O. C., Plunkett, S. P., Rich, N. B., Howard, R. A.: 2004, J. Geophys. Res. 109, A07105.
- Zhukov and Auchère (2004) Zhukov, A. N., Auchère, F.: 2004, A&A 427, 705.
- Zhukov, Rodriguez, and de Patoul (2009) Zhukov, A. N., Rodriguez, L., de Patoul, J.: 2009, Sol. Phys. 259, 73.