A study of six low redshift QSO pairs
Abstract
The dynamical properties of six SDSS quasar pairs at are investigated. The pairs have proper transverse separation kpc, and velocity difference along the line of sight km/s. If they are bound systems their dynamical mass can be evaluated and compared with that of host galaxies. Evidence is found of an excess of the former mass with respect to the latter. This suggests that these quasar pairs are hosted by galaxies with massive dark halos or that they reside in a group/cluster of galaxies.
keywords:
QSOs: general1 Introduction
Quasars (QSO) are rare and short–lived objects (e.g., Martini, 2004; Hopkins et al., 2005), nevertheless a number of associations of QSOs have been discovered in the last decades (e.g., Shaver, 1984; Djorgovski, 1991; Zhdanov & Surdej, 2001). The study of these systems is important in the understanding of the evolutionary history of galaxies with cosmic time and the mechanism of QSO ignition (e.g., Di Matteo, Springel, & Hernquist, 2005; Foreman, Volonteri, & Dotti, 2009). Particular interest has been dedicated to binary QSOs, i.e., two QSOs that reside in the same galaxy and that are characterised by the presence of double systems of emission lines (e.g., Boroson & Lauer, 2009; Rosario et al., 2011). These systems are thought to form in the last stages of a major merger event (e.g., Colpi & Dotti, 2009, and references therein).
The search of QSO pairs (QSOP) at scales from tens to hundreds of kiloparsecs in large surveys was mainly focused on the investigation of QSO clustering properties (e.g., Hennawi et al., 2010; Shen et al., 2010) and in particular on the excess, with respect to the large scale extrapolation, found at separations of tens of kiloparsecs (e.g., Hennawi et al., 2006; Myers et al., 2007, 2008). The study of the clustering allows us to estimate the bound mass of the structures inhabited by QSOs (e.g., Croom et al., 2005; Shen et al., 2010), but little attention has been given thus far to the study of the dynamical properties of single QSOPs that, if isolated, are dominated by the mass of their host galaxies (e.g., Mortlock, Webster, & Francis, 1999; Brotherton et al., 1999). Although the Cold Dark Matter models of galaxy formation predict that QSOs, and in particular QSOPs, reside preferentially in particularly rich environments (e.g., Efstathiou & Rees, 1988; Hopkins et al., 2008), some observational evidence shows that QSOPs could be isolated systems (e.g., Fukugita et al., 2004; Boris et al., 2007).
In this paper we look for QSOPs in the Sloan Digital Sky Survey (SDSS; York et al., 2000), with the goal of reconstructing the systemic dynamics of the pairs. We found six QSOPs at redshift , for which the measurement of [OIII] lines allows us to pursue this study. In §2 we describe our sample. §3 deals with measurements of radial velocity differences. In §4 we compute virial masses and compare them with those of the host galaxies. We investigate the QSOP environment in §5. Implications of our results are discussed in §6.
Throughout this paper we consider a concordance cosmology with H km/s/Mpc, , and .
2 The quasar pair sample
We investigate the catalogue of spectroscopically confirmed QSOs constructed by Schneider et al. (2010) on the basis of the SDSS DR7 (Abazajian et al., 2009) which contains objects. We select as pairs two QSOs that have proper transverse separation kpc, and radial velocity difference km/s, as based on SDSS redshifts. pairs that satisfy the above criteria are found in the redshift range , with luminosities between and .
Since we are interested in the dynamical properties of these systems we also require that the forbidden [OIII] lines, which are used to measure the systemic velocity of the QSOs (see §3), are present in the SDSS spectra. This implies that the candidate QSOPs are at redshifts below 0.8. With this additional condition we obtain a list of six pairs of radio quiet QSOs (see Table 1), five of them considered also by Hennawi et al. (2006).
| QSO A | QSO B | |||||||
|---|---|---|---|---|---|---|---|---|
| ID | name | |||||||
| [mag] | [mag] | [arcsec] | [kpc] | [km/s] | ||||
| QP01 | SDSS J0117+0020AB | 0.6122 | -22.38 | 0.6130 | -24.65 | 44 | 300 | 149 |
| QP02 | SDSS J0747+4318AB | 0.5010 | -22.76 | 0.5012 | -22.61 | 9 | 56 | 40 |
| QP03 | SDSS J0824+2357AB | 0.5356 | -23.19 | 0.5365 | -23.19 | 15 | 94 | 176 |
| QP04 | SDSS J0845+0711AB | 0.5363 | -23.48 | 0.5373 | -23.20 | 62 | 393 | 195 |
| QP05 | SDSS J0856+5111AB | 0.5425 | -22.81 | 0.5434 | -23.59 | 22 | 139 | 175 |
| QP06 | SDSS J1249+4719AB | 0.4375 | -23.09 | 0.4382 | -22.63 | 79 | 446 | 146 |
The probability that they are chance superpositions is rather low. In fact, searching for QSOPs in a random sample generated with the redshift permutation method (e.g., Osmer, 1981; Zhdanov & Surdej, 2001), which consists of maintaining the position of the QSOs fixed, but to randomly permute the redshift, we expect to find such pairs compared to the observed. Note that in this new sample most of the correlations between objects are destroyed, but the angular correlation between QSOs is preserved, so the result can be considered as an upper limit for the number of chance QSOPs. Thus we assume that all these QSOP are physically associated.
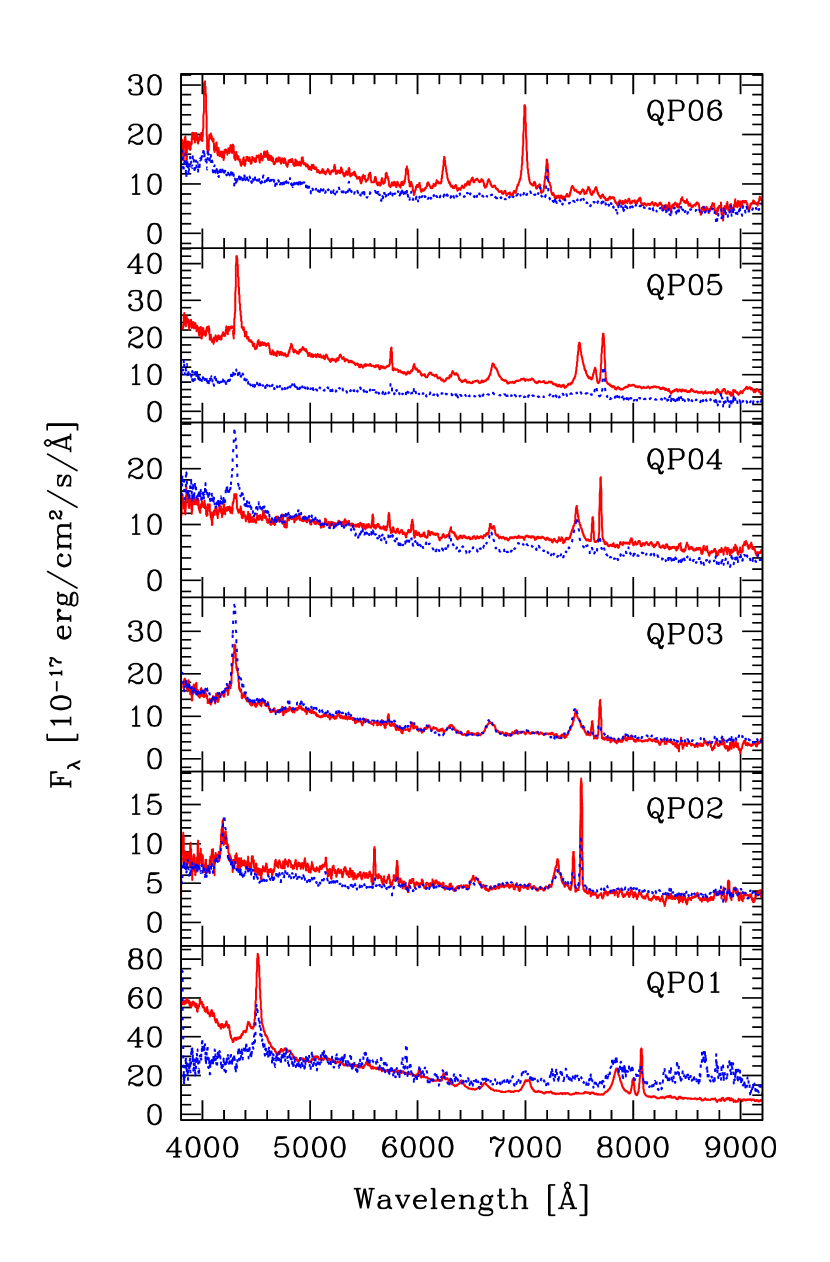
We can exclude that these QSOPs are gravitational lens images because: significant differences in the spectra of the two QSOs are apparent (see Figure 1), wide separation ( arcsec) lensed QSOs are quite rare (Kochanek, Falco, & Muñoz, 1999), and there is no evidence in SDSS images for luminous galaxies in the foreground of QSOPs that could act as a lens.
3 Velocity differences from [OIII] lines
We can also exclude the possibility that the velocity differences can be related to the Hubble Flow and therefore measure the physical distance of the pairs. In fact we verify that, under this hypothesis, in the Schneider et al. (2010) QSO catalogue there are pairs with Mpc and physical radial separation Mpc. Assuming that the 29 systems with Mpc are homogeneously distributed, we expect with kpc, while are found.
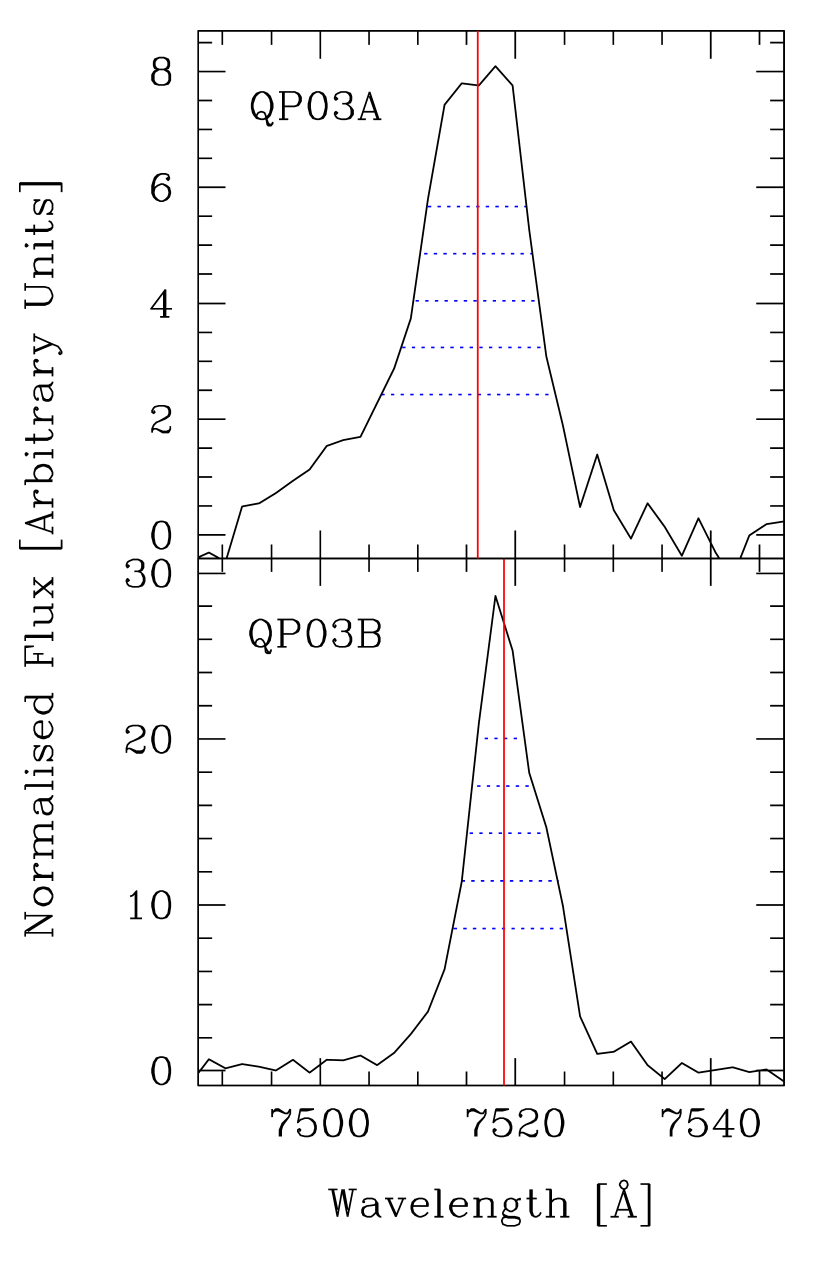
It is well known that the redshifts of QSOs derived from emission lines of various elements can differ by as much as km/s (e.g., Tytler & Fan, 1992; Bonning, Shields, & Salviander, 2007). Therefore the most reliable estimate of the systemic velocity of the QSOs is obtained from the measurements of narrow forbidden lines, such as [OIII]λ4949 and [OIII]λ5007 (e.g., Nelson & Whittle, 1996; Nelson, 2000; Boroson, 2005; Hewett & Wild, 2010).
We evaluate the baricentres of the lines considering the flux above various thresholds with respect to the peak flux (see Figure 2). We take the line position to be the median of the individual measurement of the baricentre, and the corresponding uncertainty is given by their interquartile range. The redshifts and the radial velocity differences that result from these measurements are reported in Table 2.
| ID | ||||
| [km/s] | [] | |||
| QP01 | 0.611420.00078 | 0.613410.00001 | 370171 | 2.8–20.4 |
| QP02 | 0.501080.00003 | 0.501740.00001 | 1327 | 0.2–0.3 |
| QP03 | 0.535270.00009 | 0.536780.00002 | 29521 | 1.6–2.2 |
| QP04 | 0.535090.00015 | 0.537540.00002 | 47835 | 17.9–24.0 |
| QP05 | 0.543220.00003 | 0.542390.00003 | 1619 | 0.7–0.9 |
| QP06 | 0.438610.00045 | 0.438590.00001 | … |
4 The mass of QSO pairs
Assuming that the QSOPs form bound systems and thus that the velocity difference measured is due to the mutual interaction between the two QSOs, we can infer the dynamical mass through the virial theorem:
| (1) |
where is the relative velocity of the two components, their separation, and the gravitational constant. For circular orbits, it is possible to calculate the radial component of the relative velocity () from the redshift difference (). One has:
| (2) |
where is the speed of light, the proper transverse separation of the pair (see Table 1), and the factor depends only on the inclination angle of the orbital plane , and on the phase angle and is given by:
| (3) |
The average values of is and the minimum value is .
In Table 2 we report for each QSOP the minimum virial mass (, corresponding to ), which represents the minimum mass of the system to be bound. In the case of QP06, since there is no significant difference of radial velocity, we cannot estimate its virial mass. In this case we are probably observing the pair orbit nearly face on.
It is of interest to compare these with the expected total mass of the pair based on the mass of their host galaxies. According to available measurements of QSO host galaxies (e.g., Kotilainen et al., 2009, and references therein) it is found that their mass changes little with redshift. The typical range of host mass, based on the galactic luminosity, for objects at is (Decarli et al., 2010, and references therein).
While for three QSO pairs (QP02, QP03, and QP05) their is consistent with that expected by the typical host galaxy masses, in two cases (QP01 and QP04) the minimum virial mass is substantially larger than that of their host galaxies (see Table 2). If one assumes the average value of () instead of its minimum, then the above cases are further strengthened and also QP03 would exhibit a significant mass excess. For the whole (small) sample the median value for the is .
A possible explanation for this mass excess is that QP01 and QP04 belong to a group or a cluster of galaxies. In this case in fact the measured velocity difference depends on the overall mass distribution. In the next session we investigate this possibility.
5 QSO pairs’ environment
We searched the SDSS –band images for an overdensity of galaxies that could justify the mass excess discussed above. The SDSS magnitude limit in this band is mag (York et al., 2000), thus it allows us to reach , where at (Wolf et al., 2003), therefore these images permit us to detect only the bright part of the galaxy luminosity function.
The galaxy search was performed using SExtractor (Bertin & Arnouts, 1996) on the SDSS images in an area of Mpc
around each pair. The threshold limits for the detections is set at times over the rms of the
background, and we classified as galaxy all the sources with the STARCLASS parameter lower than .
The number of galaxies in the fields (see Table 3) is consistent
with the expectation from the study performed up to mag by Postman et al. (1998) on a region of
, and the number of galactic stars with the prediction
of the TRILEGAL package111http://stev.oapd.inaf.it/cgi-bin/trilegal_1.4 by
Girardi et al. (2005).
| ID | n(bkg) | N( Mpc) | n( Mpc) | |
|---|---|---|---|---|
| [arcmin-2] | [arcmin-2] | |||
| QP01 | 1.20.2 | 5 | 1.40.6 | |
| QP02 | 1.40.1 | 8 | 1.40.5 | |
| QP03 | 2.10.1 | 26 | 4.70.9 | |
| QP04 | 1.90.1 | 15 | 2.70.7 | |
| QP05 | 1.80.2 | 5 | 0.90.4 | |
| QP06 | 1.90.2 | 12 | 2.30.7 | … |
In order to highlight a possible overdensity around the QSOPs, we compute the number of galaxies in annuli of kpc radius, starting from the centre of each pair. We then compare the galaxy density in the first kpc with that in the region between Mpc and Mpc, assumed as background. These values are reported in Table 3. Only QP03 shows a significant overdensity of galaxies. In the other cases there is no evidence for a galaxy excess above the background by more than .
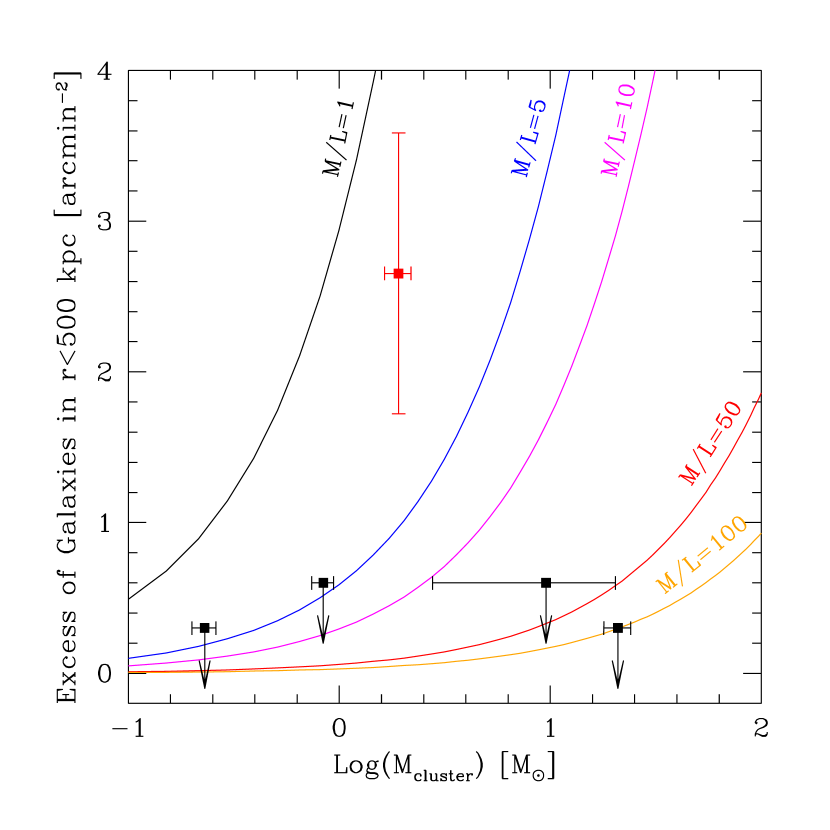
We evaluate the expected density of galaxies brighter than the SDSS luminosity limits ( mag) if a cluster of mass were associated with the QSOPs. We assume that the galaxies of the cluster follow the Schechter luminosity function with parameters given by Wolf et al. (2003), and that the galaxies are distributed according to a King profile with a virial radius calculated from the virial mass following the relations reported by Girardi et al. (1998).
We compare the expected galaxy density with that observed in SDSS images (see Figure 3). In all cases but one,we do not find indications for overdensities larger than times the variation of the background, thus, to explain the minimum virial masses of the pairs, these systems require a mass–to–light ratio – (see Table 3). Note that these values are comparable with those reported in various studies on dynamical properties of galaxy clusters (e.g., Popesso et al., 2005, and references therein).
6 Conclusions
The analysis of the properties of 6 low redshift QSO pairs has shown that in at least two cases the dynamical mass of the pair exceeds, by a factor , that expected from their host galaxies. A possible explanation of this excess is that the QSO host galaxies are surrounded by dark matter halos with masses similar to those found in massive ellipticals (e.g., Napolitano et al., 2009). Alternatively the observed velocity differences could be due to the presence of a cluster or a group of galaxies associated with the QSO pairs. An analysis of SDSS i–band images shows evidence for a significant overdensity of galaxies in only one case. For the other systems a lower limit to the mass–to–light ratio was determined at – for galaxy clusters with masses equal to the virial masses of the pairs.
In order to strengthen the evidence of a mass excess, we can consider a larger sample given by the lists of already known QSO pairs (Schneider et al., 2010; Hennawi et al., 2006, 2010; Myers et al., 2008). Most of these systems are at , excellent instrument capabilities are thus required to perform these studies.
Acknowledgements
We acknowledge helpful discussions with R. Decarli, R. Rampazzo, and M. Clemens. For this work EPF was supported by Società Carlo Gavazzi S.p.A. and by Thales Alenia Space Italia S.p.A.
Data for this work are from the Sloan Digital Sky Survey. The SDSS Web Site is http://www.sdss.org/.
References
- Abazajian et al. (2009) Abazajian K. N., et al., 2009, ApJS, 182, 543
- Bertin & Arnouts (1996) Bertin E., Arnouts S., 1996, A&AS, 117, 393
- Bonning, Shields, & Salviander (2007) Bonning E. W., Shields G. A., Salviander S., 2007, ApJ, 666, L13
- Boris et al. (2007) Boris N. V., Sodré L., Jr., Cypriano E. S., Santos W. A., de Oliveira C. M., West M., 2007, ApJ, 666, 747
- Boroson (2005) Boroson T., 2005, AJ, 130, 381
- Boroson & Lauer (2009) Boroson T. A., Lauer T. R., 2009, Nature, 458, 53
- Brotherton et al. (1999) Brotherton M. S., Gregg M. D., Becker R. H., Laurent-Muehleisen S. A., White R. L., Stanford S. A., 1999, ApJ, 514, L61
- Colpi & Dotti (2009) Colpi M., Dotti M., 2009, arXiv:0906.4339
- Croom et al. (2005) Croom S. M., et al., 2005, MNRAS, 356, 415
- Decarli et al. (2010) Decarli R., Falomo R., Treves A., Labita M., Kotilainen J. K., Scarpa R., 2010, MNRAS, 402, 2453
- Di Matteo, Springel, & Hernquist (2005) Di Matteo T., Springel V., Hernquist L., 2005, Nature, 433, 604
- Djorgovski (1991) Djorgovski S., 1991, ASPC, 21, 349
- Efstathiou & Rees (1988) Efstathiou G., Rees M. J., 1988, MNRAS, 230, 5P
- Foreman, Volonteri, & Dotti (2009) Foreman G., Volonteri M., Dotti M., 2009, ApJ, 693, 1554
- Fukugita et al. (2004) Fukugita M., Nakamura O., Schneider D. P., Doi M., Kashikawa N., 2004, ApJ, 603, L65
- Girardi et al. (1998) Girardi M., Giuricin G., Mardirossian F., Mezzetti M., Boschin W., 1998, ApJ, 505, 74
- Girardi et al. (2005) Girardi L., Groenewegen M. A. T., Hatziminaoglou E., da Costa L., 2005, A&A, 436, 895
- Hennawi et al. (2006) Hennawi J. F., et al., 2006, AJ, 131, 1
- Hennawi et al. (2010) Hennawi J. F., et al., 2010, ApJ, 719, 1672
- Hewett & Wild (2010) Hewett P. C., Wild V., 2010, MNRAS, 405, 2302
- Hopkins et al. (2005) Hopkins P. F., Hernquist L., Martini P., Cox T. J., Robertson B., Di Matteo T., Springel V., 2005, ApJ, 625, L71
- Hopkins et al. (2008) Hopkins P. F., Hernquist L., Cox T. J., Kereš D., 2008, ApJS, 175, 356
- Kochanek, Falco, & Muñoz (1999) Kochanek C. S., Falco E. E., Muñoz J. A., 1999, ApJ, 510, 590
- Kotilainen et al. (2009) Kotilainen J. K., Falomo R., Decarli R., Treves A., Uslenghi M., Scarpa R., 2009, ApJ, 703, 1663
- Martini (2004) Martini P., 2004, cbhg.symp, 169
- Mortlock, Webster, & Francis (1999) Mortlock D. J., Webster R. L., Francis P. J., 1999, MNRAS, 309, 836
- Myers et al. (2007) Myers A. D., Brunner R. J., Richards G. T., Nichol R. C., Schneider D. P., Bahcall N. A., 2007, ApJ, 658, 99
- Myers et al. (2008) Myers A. D., Richards G. T., Brunner R. J., Schneider D. P., Strand N. E., Hall P. B., Blomquist J. A., York D. G., 2008, ApJ, 678, 635
- Napolitano et al. (2009) Napolitano N. R., et al., 2009, MNRAS, 393, 329
- Nelson & Whittle (1996) Nelson C. H., Whittle M., 1996, ApJ, 465, 96
- Nelson (2000) Nelson C. H., 2000, ApJ, 544, L91
- Osmer (1981) Osmer P. S., 1981, ApJ, 247, 762
- Popesso et al. (2005) Popesso P., Biviano A., Böhringer H., Romaniello M., Voges W., 2005, A&A, 433, 431
- Postman et al. (1998) Postman M., Lauer T. R., Szapudi I., Oegerle W., 1998, ApJ, 506, 33
- Rosario et al. (2011) Rosario D. J., McGurk R. C., Max C. E., Shields G. A., Smith K. L., 2011, arXiv:1102.1733
- Schneider et al. (2010) Schneider D. P., et al., 2010, AJ, 139, 2360
- Shaver (1984) Shaver P. A., 1984, A&A, 136, L9
- Shen et al. (2010) Shen Y., et al., 2010, ApJ, 719, 1693
- Tytler & Fan (1992) Tytler D., Fan X.-M., 1992, ApJS, 79, 1
- Wolf et al. (2003) Wolf C., Meisenheimer K., Rix H.-W., Borch A., Dye S., Kleinheinrich M., 2003, A&A, 401, 73
- York et al. (2000) York D. G., et al., 2000, AJ, 120, 1579
- Zhdanov & Surdej (2001) Zhdanov V. I., Surdej J., 2001, A&A, 372, 1