An efficient and principled method for detecting communities in networks
Abstract
A fundamental problem in the analysis of network data is the detection of network communities, groups of densely interconnected nodes, which may be overlapping or disjoint. Here we describe a method for finding overlapping communities based on a principled statistical approach using generative network models. We show how the method can be implemented using a fast, closed-form expectation-maximization algorithm that allows us to analyze networks of millions of nodes in reasonable running times. We test the method both on real-world networks and on synthetic benchmarks and find that it gives results competitive with previous methods. We also show that the same approach can be used to extract nonoverlapping community divisions via a relaxation method, and demonstrate that the algorithm is competitively fast and accurate for the nonoverlapping problem.
pacs:
89.75.Hc,02.10.Ox,02.50.-rI Introduction
Many networked systems, including biological and social networks, are found to divide naturally into modules or communities, groups of vertices with relatively dense connections within groups but sparser connections between them GN02 ; Fortunato10 . Depending on context, the groups may be disjoint or overlapping. A fundamental problem in the theory of networks, and one that has attracted substantial interest among researchers in the last decade, is how to detect such communities in empirical network data DDDA05 ; Fortunato10 . There are a number of desirable properties that a good community detection scheme should have. First, it should be effective, meaning it should be able to accurately detect community structure when it is present. There are, for instance, many examples of networks, both naturally occurring and synthetic, for which the community structure is widely agreed upon, and a successful detection method should be able to find the accepted structure in such cases. Second, methods based on sound theoretical principles are preferable over those that are not. A method based on a mere hunch that something might work is inherently less trustworthy than one based on a provable result or fundamental mathematical insight. Third, when implemented as a computer algorithm, a method should ideally be fast and scale well with the size of the network analyzed. Many of the networks studied by current science are large, with millions or even billions of vertices, so a community detection algorithm whose running time scales, say, linearly with the size of the network is enormously preferred over one that scales as size squared or cubed.
In this paper we derive and demonstrate an algorithm for community detection that can find either overlapping or nonoverlapping communities and satisfies all of the demands above. On standard benchmark tests the algorithm has performance similar to the best previous algorithms in detecting known community structure. The algorithm is based on established methods of statistical inference, namely maximum likelihood and the expectation-maximization algorithm. And the algorithm is fast. In its simplest form it consists of the iteration of just two sets of equations, each iteration taking an amount of time that increases only linearly with system size. In practice the algorithm can handle networks with millions of vertices and edges in reasonable running times on a typical desktop computer. The largest network we have analyzed has over 4 million vertices and 40 million edges.
We approach the problem of community detection first as a problem of finding overlapping communities. Early efforts at community detection, going back to the 1970s, assumed nonoverlapping or disjoint communities, but as many researchers have argued in the last few years, it is common in practical situations for communities to overlap. In social networks, for example, people often belong to more than one circle of acquaintances—family, friends, coworkers, and so forth—and hence those circles should properly be considered as overlapping, since they have at least one common member. In biological networks too vertices can belong to more than one group. Metabolites in a metabolic network can play a role in more than one metabolic process or cycle; species in a food web can fall on the border between two otherwise noninteracting subcommunities and play a role in both of them. Thus the most general formulation of the community detection problem should allow for the possibility of overlap. Our approach is to develop a solution to this general problem first, then show how a variant of the same approach can be applied to nonoverlapping communities as well.
We tackle the detection of overlapping communities by fitting a stochastic generative model of network structure to observed network data. This approach, which applies methods of statistical inference to networks, has been explored by a number of authors for the nonoverlapping case, including some work that goes back several decades HLL83 ; Wang1987 ; Snijders1997 ; CMN08 . Extending the same approach to the overlapping case, however, has proved nontrivial. The crucial step is to devise a generative model that produces networks with overlapping community structure similar to that seen in real networks. The models used in most previous work are “mixed membership” models Airoldi2008 , in which, typically, vertices can belong to multiple groups and two vertices are more likely to be connected if they have more than one group in common. This, however, implies that the area of overlap between two communities should have a higher average density of edges than an area that falls in just a single community. It is unclear whether this reflects the behavior of real-world networks accurately, but it is certainly possible to construct networks that do not have this type of structure. Ideally we would prefer a less restrictive model that makes fewer assumptions about the structure of community overlaps.
Another set of approaches to the detection of overlapping communities are those based on local community structure. Rather than splitting an entire network into communities in one step, these methods instead look for local groups within the network, based on analysis of local connection patterns and ignoring global network structure. Methods of this kind give rise naturally to overlapping communities when one generates a large number of independent local communities throughout the network. Moreover, the communities tend to be compact and connected subgraphs, a requirement not always met by other methods. On the other hand, global detection methods can capture large-scale network structure better and are more appropriate when particular constraints, such as constraints on the number of communities, must be satisfied.
In this paper, we develop a global statistical method for detecting overlapping communities based on the idea of link communities which has been proposed independently by a number of authors both in the physics literature Ahn2010 ; Evans2009LG and in machine learning Parkinnen2009 ; Gyenge2010 . The idea is that communities arise when there are different types of edges in a network. In a social network, for instance, there are links representing family ties, friendship, professional relationships, and so forth. If we can identify the types of the edges, i.e., if we can cluster not the vertices in a network but the edges, then we can deduce the communities of vertices after the fact from the types of edges connected to them. This approach has the nice feature of matching our intuitive idea of the origin and nature of community structure while giving rise to overlapping communities in a natural way: a vertex belongs to more than one community if it has more than one type of edge.
Previous approaches to the discovery of link communities have made use of heuristic quality functions optimized over possible partitions of a network’s edges Ahn2010 ; Evans2009LG . Such quality functions, particularly the so-called modularity function NG04 , have been used in the past for nonoverlapping communities, but while in practice these functions often give reasonable results, they also have some deficiencies: the modularity for instance cannot be used to find very small communities FB07 , may not have a unique optimum Good2010 , and is somewhat unsatisfactory from a formal viewpoint Zhang2009 ; Bickel2009 . Recent results of Bickel and Chen Bickel2009 suggest that these deficiencies can be remedied by abandoning the quality function approach and instead fitting a generative model to the data. This is the approach we take, but the definition of a model for link communities demands some subtlety. In generative models for vertex communities one can assign vertices to groups first and then place edges based on that assignment. But for a model of link communities, where it is the edges that are partitioned, one cannot assign edges to groups until the edges exist, so the edges and their groupings have to be generated simultaneously. We describe in detail how we achieve this in the following section. Once we have the model, the goal will be to determine the values of its parameters that best fit the observed network and from those to determine the overlapping vertex communities.
The outline of the paper is as follows. First we define our model and then demonstrate how the best-fit values of its parameters can be calculated using a maximum likelihood algorithm. In its simplest form this algorithm is only moderately fast, but we demonstrate that many of the model parameters converge rapidly to trivial values and hence can be pruned from the calculation. We give a prescription for performing this pruning, resulting in a significantly faster algorithm which is practical for applications to very large networks. We give example applications to numerous real-world networks, as well as tests against synthetic networks that demonstrate that the algorithm can discover known overlapping community structure in such networks.
Finally, we show how our method can be used also to detect nonoverlapping communities by assigning each vertex solely to the community to which it most strongly belongs in the overlapping division. We demonstrate that this intuitive heuristic can be justified rigorously by regarding the link community model as a relaxation of a stochastic blockmodel for disjoint communities Karrer2010SB . Algorithms have been proposed previously for fitting this blockmodel, but their running time was always at least quadratic in the number of vertices, which limited their application to smaller networks. The algorithm proposed here is significantly faster and hence can be applied to the detection of disjoint communities in very large networks.
II A generative model for link communities
Our first step is to define the generative network model that we will use. The model generates networks with a given number of vertices and undirected edges divided among a given number of communities. It is convenient to think of the edges as being colored with different colors to represent the communities to which they belong. Then the model is parametrized by a set of parameters , which represent the propensity of vertex to have edges of color . Specifically, is the expected number of edges of color that lie between vertices and , the exact number being Poisson distributed about this mean value. Note that this means the network is technically a multigraph—it can have more than one edge between a pair of vertices. Most real-world networks have single edges only, and in this sense the model is unrealistic. However, allowing multiedges makes the model enormously simpler to treat and in practice the values of the will be small so that the number of multiedges, and hence the error introduced, is also small. The same approximation is made in most other random graph models of networks, including, for instance, the widely studied configuration model MR95 ; NSW01 . Our model also allows self-edges—edges that connect to the same vertex at both ends—with expected number , the extra factor of a half being convenient for consistency with later results. Again, the appearance of self-edges, while unrealistic in some cases, greatly simplifies the mathematical developments and is typical of other random graph models including the configuration model.
In the model defined here the link communities arise implicitly as the network is generated, as discussed in the introduction, rather than being spelled out explicitly. Two vertices which have large values of and for some value of have a high probability of being connected by an edge of color , and hence groups of such vertices will tend to be connected by relatively dense webs of color- edges—precisely the structure we expect to see in a network with link communities.
III Detecting overlapping communities
Given the model defined above, it is now straightforward to write down the probability with which any particular network is generated. Recalling that the sum of independent Poisson-distributed random variables is also a Poisson-distributed random variable, the expected total number of edges of all colors between two vertices and is simply (or for self-edges), and the actual number is Poisson-distributed with this mean. Thus the probability of generating a graph with adjacency matrix elements is
| (1) |
(Recall that the adjacency matrix element , by convention, takes the value if there is an edge between distinct vertices and , but for a self-edge—hence the additional factors of in the second product.)
We fit the model to an observed network by maximizing this probability with respect to the parameters , or equivalently (and more conveniently) maximizing its logarithm. Taking the log of Eq. (1), rearranging, and dropping additive and multiplicative constants (which have no effect on the position of the maximum), we derive the log-likelihood
| (2) |
Direct maximization of this expression by differentiating leads to a set of nonlinear implicit equations for that are hard to solve, even numerically. An easier approach is the following. First we apply Jensen’s inequality in the form note1 :
| (3) |
where the are any set of positive numbers and the are any probabilities satisfying . Note that the exact equality can always be achieved by making the particular choice . Applying Eq. (3) to Eq. (2) gives
| (4) |
where the probabilities can be chosen in any way we please provided they satisfy . Notice that the are only defined for vertex pairs that are actually connected by an edge in the network (so that ), and hence there are only as many of them as there are observed edges.
Since, as noted, the exact equality in this expression can always be achieved by a suitable choice of , it follows that the double maximization of the right-hand side of (4) with respect to both the and the is equivalent to maximizing the original log-likelihood, Eq. (2), with respect to the alone. It may appear that this does not make our optimization problem any simpler: we have succeeded only in turning a single optimization into a double one, which one might well imagine was a more difficult problem. Delightfully, however, it is not; the double optimization is actually very simple. Given the true optimal values of , the optimal values of are given by
| (5) |
since these are the values that make our inequality an exact equality. But given the optimal values of the , the optimal can be found by differentiating (4), which gives
| (6) |
Summing this expression over and rearranging gives us
| (7) |
and combining with (6) again then gives
| (8) |
Maximizing the log-likelihood is now simply a matter of simultaneously solving Eqs. (5) and (8), which can be done iteratively by choosing a random set of initial values and alternating back and forth between the two equations. This type of approach is known as an expectation-maximization or EM algorithm and it can be proved that the log-likelihood increases monotonically under the iteration, though it does not necessarily converge to the global maximum. To guard against the possibility of getting stuck in a local maximum, we repeat the entire calculation a number of times with random initial conditions and choose the result that gives the highest final log-likelihood.
The value of in Eq. (5) has a simple physical interpretation: it is the probability that an edge between and has color , which is precisely the quantity we need in order to infer link communities in the network. Notice that is symmetric in , as it should be for an undirected network.
The calculation presented here is mathematically closely related to methods developed in the machine learning community for the analysis of text documents. Specifically, the model we fit can be regarded as a variant of a model used in probabilistic latent semantic analysis (PLSA)—a technique for automated detection of topics in a corpus of text—adapted to the present context of link communities. Connections between text analysis and community detection have been explored by several previous authors. Of particular interest is the work of Psorakis et al. Psorakis2010 , which, though it does not focus on link communities, uses another variant of the PLSA model, coupling it with an iterative fitting algorithm called nonnegative matrix factorization to find overlapping communities in directed networks. Also of note is the work of Parkinnen et al. Parkinnen2009 , who consider link communities as we do, but take a contrasting algorithmic approach based on a Bayesian generative model and Markov chain Monte Carlo techniques. A detailed description of the interesting connections between text processing and network analysis would take us some way from the primary purpose of this paper, but for the interested reader we give a discussion and references in Appendix A.
IV Implementation
The method outlined above can be implemented directly as a computer algorithm for finding overlapping communities, and works well for networks of moderate size, up to tens of thousands of vertices. For larger networks both memory usage and run-time become substantial and prevent the application of the method to the largest systems, but both can be improved by using a more sophisticated implementation which makes applications to networks of millions of vertices possible.
The algorithm’s memory use is determined by the space required to store the parameters: the require space while the require , where and are the numbers of vertices and edges in the network. Since is usually substantially larger than , this means that memory use is dominated by the . We can reduce memory use by reorganizing the algorithm in such a way that the are never stored. Rather than focusing on the , we work instead with the average number of ends of edges of color connected to vertex :
| (9) |
Given the values of these quantities on a given iteration of the algorithm, the calculation of the values at the next iteration is then as follows. First we define a new set of quantities that will store the new values of the . Initially we set all of them to zero. We also calculate the average number of edges of color summed over all vertices
| (10) |
in terms of which the original parameters are
| (11) |
Next we go through each edge in the network in turn and calculate the denominator of Eq. (5) for that and from the values of the thus:
| (12) |
Armed with this value we can calculate the value of for this and all from Eq. (5):
| (13) |
Now we add this value onto the quantities and , discard the values of and , and repeat for the next edge in the network. When we have gone through all edges in this manner, the quantities will be equal to the sum in Eq. (9), and hence will be the correct new values of .
This method requires us to store only the old and new values of , for a total of quantities, and not the values of , which results in substantial memory savings for larger networks.
As for the running time, the algorithm as we have described it has a computational complexity of operations per iteration of the equations, where is again the number of edges in the network. The primary determinant of the total run-time is the number of iterations that have to be performed before the values of the converge. In practice, we find in many cases that a rather large number of iterations is required, which slows the performance of the method, but the speed can be improved as follows.
In a typical application of the algorithm to a network, the end result is that each vertex belongs to only a subset of the possible communities. To put that another way, we expect that a large fraction of the parameters will tend to zero under the EM iteration. It is straightforward to see from the equations above that if a particular ever becomes zero, then it must remain so for all future iterations, which means that it no longer need be updated and we can save ourselves time by excluding it from our calculations. This leads to two useful strategies for pruning our set of variables. In the first, we set to zero any that falls below a predetermined threshold . Once a has been set to zero, the corresponding values of the on all the adjacent edges are also zero and therefore need not be calculated. Thus, for each edge, we need only calculate the values of for those colors for which both and are nonzero, i.e., for the intersection of the sets of colors at vertices and . This strategy leads to significant speed increases when the number of communities is large. For smaller values of the speed savings are outweighed by the additional computational overhead and it is more efficient to simply calculate all , but we nonetheless still set the values of the to zero below the threshold because it makes possible our second pruning strategy.
Our second strategy, which can be used in tandem with the first and gives significant speed improvements for all values of , is motivated by the observation that if all but one of the for a particular vertex are set to zero, then the color of the vertex is fixed at a single value and will no longer change at all. If both vertices at the ends of an edge have this property, if both of them have converged to a single color and are no longer changing, then the edge connecting them no longer has any effect on the calculation and can be deleted entirely from the network.
By the use of these two strategies the speed of our calculations is improved markedly. We find in practice that the numbers of parameters and edges both shrink rapidly and substantially with the progress of the calculation, so that the majority of the iterations involve only a subset, typically those associated with the vertices whose community identification is most ambiguous. If the value of the threshold is set to zero, then the pruned algorithm is exactly equivalent to the original EM algorithm and the results are identical, yet even with this choice we find substantial speed improvements. If is chosen small but nonzero—we use in our calculations note2 —then we introduce an approximation into the calculation which means the results will be different in general from the original algorithm. In practice, however, the difference is small, and the nonzero gives us an additional significant speed improvement.
A detailed comparison of results and run-times for the pruned and original versions of the algorithm is given in Appendix B for a range of networks. Unless stated otherwise, all calculations presented in the remainder of the paper are done with the faster version of the algorithm.
V Results
We test the performance of the algorithm described above using both synthetic (computer-generated) networks and a range of real-world examples. The synthetic networks allow us to test the algorithm’s ability to detect known, planted community structure under controlled conditions, while the real networks allow us to observe performance under practical, real-world conditions.
V.1 Synthetic networks
Our synthetic network examples take the form of a classic consistency test. We generate networks using the same stochastic model that the algorithm itself is based on and measure the algorithm’s ability to recover the known community divisions for various values of the parameters. One can vary the values to create networks with stark community structure (which should make detection easy) or no community structure at all (which makes it impossible), and everything in between, and we can thereby vary the difficulty of the challenge we pose to the algorithm.
The networks we use for our tests have vertices each, divided into two overlapping communities. We place vertices in the first community only, meaning they have connections only to others in that community, vertices in the second community only, and the remaining vertices in both communities, with equal numbers of connections to vertices in either group on average. We fix the expected degree of all vertices to take the same value .
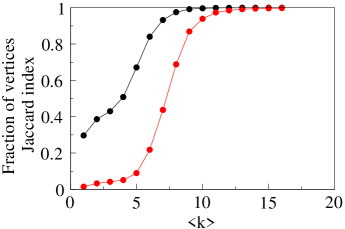
We perform three sets of tests. In the first we fix the size of the overlap between the communities at , divide the remaining vertices evenly , and observe the behavior of the algorithm as we vary the value of . When there are no edges in the network and hence no community structure, and we expect the algorithm (or any algorithm) to fail. When is large, on the other hand, it should be straightforward to work out where the communities are.
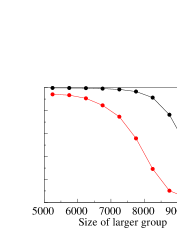
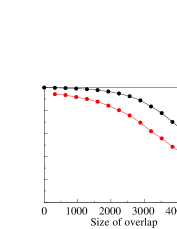
For our second set of tests we again set the overlap at but this time we fix and vary the balance of vertices between and . Finally, for our third set of tests we set and constrain and to be equal, but allow the size of the overlap to vary.
In Fig. 1 we show the measured fraction of vertices classified correctly (black curve) in each of these three sets of tests (the three separate panels), averaged over 100 networks for each point. To be considered correctly classified a vertex’s membership (or lack of membership) in both groups must be reported correctly by the algorithm, and the algorithm considers any vertex to be a member of a group if, on average, it has at least one edge of the appropriate color when the maximum likelihood fitting procedure is complete. In mathematical terms, a vertex belongs to community if its expected degree with respect to color , given by , is greater than one.
As the figure shows, there are substantial parameter ranges for all three tests for which the algorithm performs well, correctly classifying most of the vertices in the network. As expected the accuracy in the first test increases with increasing and for values of greater than about ten—a figure easily attained by many real-world networks—the algorithm identifies the known community structure essentially perfectly. In the other two tests accuracy declines as either the asymmetry of the two groups or the size of the overlap increases, but approaches 100% when either is small.
To probe in more detail the algorithm’s ability to identify overlapping communities, we have also measured, for the same test networks, a Jaccard index: if is the set of vertices in the true overlap and is the set the algorithm identifies as being in the overlap, then the Jaccard index is . This index is a standard measure of similarity between sets that rewards accurate identification of the overlap while penalizing both false positives and false negatives. The values of the index are shown as the red curves in Fig. 1 and, as we can see, the general shape of the curves is similar to the overall fraction of correctly identified vertices. In particular, we note that for networks with sufficiently high average degree the value of tends to 1, implying that the overlap is identified essentially perfectly.
V.2 Real networks
We have also tested our method on numerous real-world networks. In this section we give detailed results for three specific examples. Summary results for a number of additional examples are given in Appendix B.
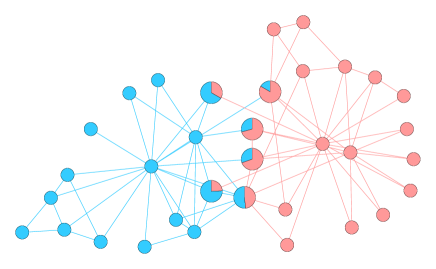
Our first example is one that has become virtually obligatory in tests of community detection, Zachary’s “karate club” network, which represents friendship patterns between members of a university sports club, deduced from an observational study Zachary77 . The network is interesting because the club split in two during the study, as a result of an internal dispute, and it has been found repeatedly that one can deduce the lines of the split from a knowledge of the network structure alone.
Figure 2a shows the decomposition of the karate club network into two overlapping groups as found by our algorithm. The colors in the figure show both the division of the vertices and the division of the edges. The split between the two groups in the club is clearly evident in the results and corresponds well with the acknowledged “ground truth,” but in addition the algorithm assigns several vertices to both groups. The individuals represented by these overlap vertices, being by definition those who have friends in both camps, might be supposed to have had some difficulty deciding which side of the dispute to come down on, and indeed Zachary’s original discussion of the split includes some indications that this was the case. Note also that, in addition to identifying overlapping vertices, our method can assign to each a fraction by which it belongs to one community or the other, represented in the figure by the pie-chart coloring of the vertices in the overlap. The fraction is calculated as the expected fraction of edges of each color incident on the vertex.
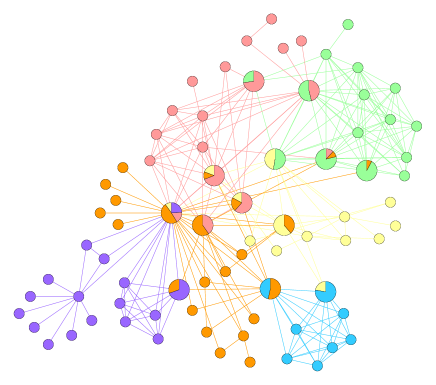
Our second example is another social network and again one whose community structure has been studied previously. This network, compiled by Knuth Knuth93 , represents the patterns of interactions between the fictional characters in the novel Les Misérables by Victor Hugo. In this network two characters are connected by an edge if they appear in the same chapter of the book. Figure 2b shows our algorithm’s partition of the network into six overlapping communities and the partition accords roughly with social divisions and subplots in the plot-line of the novel. But what is particularly interesting in this case is the role played by the hubs in the network—the major characters who are represented by vertices of especially high degree. It is common to find high-degree hubs in networks of many kinds, vertices with so many connections that they have links to every part of the network, and their presence causes problems for traditional, nonoverlapping community detection schemes because they do not fit comfortably in any community: no matter where we place a hub it is going to have many connections to vertices in other communities. Overlapping communities provide an elegant solution to this problem because we can place the hubs in the overlaps. As Fig. 2b shows, our algorithm does exactly this, placing many of the hubs in the network in two or more communities. Such an assignment is in this case also realistic in terms of the plot of the novel: the major characters represented by the hubs are precisely those that appear in more than one of the book’s subplots.
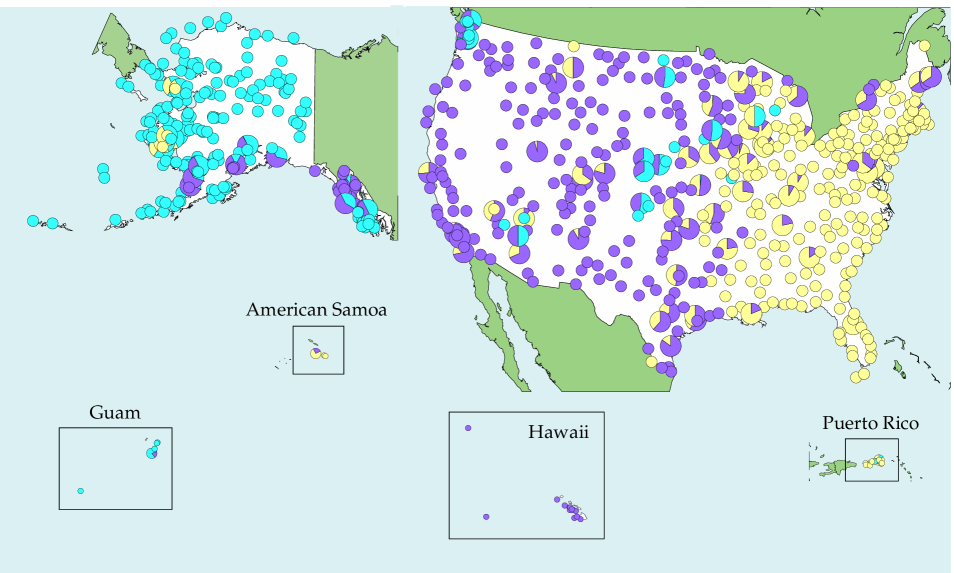
A similar behavior can be seen in our third example, which is a transportation network, the network of passenger airline flights between airports in the United States. In this network, based on data for flights in 2004, the vertices represent airports and an edge between airports indicates a regular scheduled direct flight. Spatial networks, those in which, as here, the vertices have well-defined positions in geographic space, are often found to have higher probability of connection for vertex pairs located closer together GN06b ; Barthelemy2010 , which suggests that communities, if they exist, should be regional, consisting principally of blocks of nearby vertices. The communities detected by our algorithm in the airline network follow this pattern, as shown in Fig. 3. The three-way split shown divides the network into east and west coast groups and a group for Alaska. The overlaps are composed partly of vertices that lie along the geographic boundaries between the groups, but again include hubs as well, which tend to be placed in the overlaps even when they don’t lie on boundaries. As with the previous example, this placement gives the algorithm a solution to the otherwise difficult problem of assigning to any one group a hub that has connections to all parts of the network, but it also makes intuitive sense. Hubs are the “brokers” of the airline network, the vertices that connect different communities together, since they are precisely the airports that one passes through in traveling between distant locations. Thus it is appropriate that they be considered members of more than one group. In most cases the hubs belong most strongly to the community in which they are geographically located, and less strongly to other communities.
VI Nonoverlapping communities
As we have described it, our algorithm is an algorithm for finding overlapping communities in networks, but it can be used to find nonoverlapping communities as well. As pointed out by a number of previous authors Zarei2009 ; Wang2010 ; Psorakis2010 , any algorithm that calculates proportional membership of vertices in communities can be adapted to the nonoverlapping case by assigning each vertex to the single community to which it belongs most strongly. In our case, this means assigning vertices to the community for which the value of is largest. It turns out that this procedure can be justified rigorously in our case by regarding the link community model as a relaxation of a nonoverlapping degree-corrected stochastic blockmodel. The details are given in Appendix C. Here we give some example applications to show how the approach works in practice.
As with the overlapping case, we test the method on both synthetic and real-world networks. For the synthetic case we use a standard test, the LFR benchmark for unweighted undirected networks with planted community structure Lancichinetti2008 ; Lancichinetti2009 . To make comparisons simple we use the same parameters as in Ref. Lancichinetti2009 with networks of 1000 and 5000 vertices, average degree 20, maximum degree 50, degree exponent , and community exponent . We also use the same two ranges of community sizes, with communities of 10 to 50 vertices for one set of tests (labeled S for “small” in our figures) and 20 to 100 vertices for the other set (labeled B for “big”). The value of for the detection algorithm was set equal to the number of communities in the benchmark network (which, because of the nature of the benchmark, is not a constant but varies from one network to another).
To quantify our algorithm’s success at detecting the known communities in the benchmark networks we use the variant normalized mutual information measure proposed in Lancichinetti2009 . We note that this measure is different, and in general returns different results, from the traditional normalized mutual information used to evaluate community structure DDDA05 , but using it allows us to make direct comparisons with the results for other algorithms given in Lancichinetti2009 .
In our benchmark tests we find that the simplistic rounding method described above for nonoverlapping communities, just choosing the community with the highest value of , returns only average performance when compared to the other algorithms tested in Ref. Lancichinetti2009 . However, a simple modification of the algorithm produces significantly better results: after generating a candidate division into communities using the rounding method, we then apply a further optimization step in which we move from one community to another the single vertex that most increases the log-likelihood of the division under the stochastic blockmodel, and repeat this exercise until no further such moves exist. This process, which is easy to implement and carries little computational cost when compared to the calculation of the initial division, improves our results dramatically.
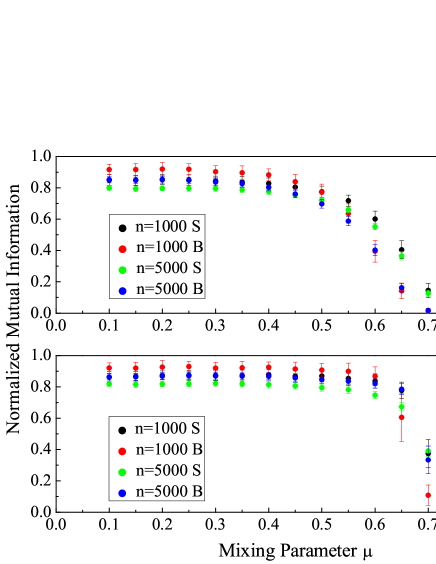
The results of our tests are shown in Figure 4. The top panel shows the performance of the algorithm without the additional optimization step and the results fall in the middle of the pack when compared to previous algorithms, better than some methods but not as good as others. The bottom panel shows the results with the additional optimization step added, and now the algorithm performs about as well as, or better than, the algorithms analyzed in Ref. Lancichinetti2009 . The general shape of the mutual information curve is similar to that of the best competing methods, falling off around the same place, although the mutual information values are somewhat lower for low values of the mixing parameter, indicating that the method is not getting the community structure exactly correct in this regime. Examining the communities in detail reveals that the method occasionally splits or merges communities. It is possible that performance could be improved further by a less simple-minded post-processing step for optimizing the likelihood.
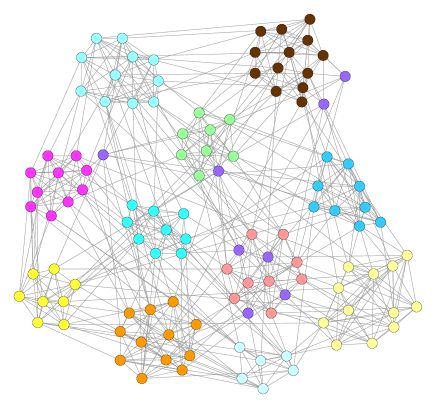
We also give, in Fig. 5, an example of a test of the method against a real-world network, in this case the much studied college football network of Ref. GN02 . In this network the vertices represent university teams in American football and the edges represent the schedule of games for the year 2000 football season, two teams being connected if they played a game. It has been found in repeated analyses that a clustering of this network into communities can retrieve the organizational units of US college sports, called “conferences,” into which universities are divided for the purposes of competition. In 2000 there were 11 conferences among the Division I-A teams that make up the network, as well as 8 teams independent of any conference. As Fig. 5 shows, every single team that belongs in a conference is placed correctly by our algorithm.
VII Conclusion
In this paper we have described a method for detecting communities, either overlapping or not, in undirected networks. The method has a rigorous mathematical foundation, being based on a probabilistic model of link communities; is easy to implement, fast enough for networks of millions of vertices; and gives results competitive with other algorithms.
Nonetheless, the method is not perfect. Its main current drawback is that it offers no criterion for determining the value of the parameter we call , the number of communities in a network. This is a perennial problem for community detection methods of all kinds. Some methods, such as modularity maximization, do offer a solution to the problem, but that solution is known to give biased answers or be inconsistent under at least some circumstances FB07 ; Bickel2009 . More rigorous approaches such as the Bayesian information criterion and the Akaike information criterion are unfortunately not applicable here because many of the model parameters are zero, putting them on the boundary of the parameter space, which invalidates the assumptions made in deriving these criteria.
Another approach is to perform the calculations with a large value of and regularize the parameters in a manner such that some communities disappear, meaning that zero edges are associated with those communities. For example, Psorakis et al. Psorakis2010 , in studies using their matrix factorization algorithm, used priors that penalized their model for including too many nonzero parameter values and hence created a balance between numbers of communities and goodness of fit to the network data. Unfortunately, the priors themselves contain undetermined parameters whose values can influence the number of communities and hence the problem is not completely solved by this approach.
We believe that statistical model selection methods applied to generative models should in principle be able to find the number of communities in a consistent and satisfactory manner. We have performed some initial experiments with such methods, and the quality of the results seems promising, but the methods are at present too computationally demanding to be applied to any but the smallest of networks. It is an open problem whether a reliable method can be developed that runs in reasonable time on the large networks of interest to today’s scientists.
Acknowledgements.
The authors thank Qiaozhu Mei, Cris Moore, and Lenka Zdeborova for useful conversations. This work was funded in part by the National Science Foundation under grant DMS–0804778 and by the James S. McDonnell Foundation.Appendix A Community detection and statistical text analysis
As mentioned in the main text, the generative model we use is the network equivalent of a model used in text analysis called probabilistic latent semantic analysis (PLSA) Hofmann1999 ; Hofmann2001 ; Hofmann2004 , modified somewhat for the particular problem we are addressing. In this appendix, we describe PLSA and related methods and models and their relationship to the community detection problem.
A classic problem in text analysis, which is addressed by the PLSA method, is that of analyzing a “corpus” of text documents to find sets of words that all (or mostly) occur in the same documents. The assumption is that these sets of words correspond to topics or themes that can be used to group documents according to content. The PLSA approach regards documents as a so-called “bag of words,” meaning one considers only the number of times each word occurs in a document and not the order in which words occur. (Also, one often considers only a subset of words of interest, rather than all words that appear in the corpus.)
Mathematically a corpus of documents and words of interest is represented by a matrix having elements equal to the number of times word appears in document . To make the connection to networks, this matrix can be thought of as the incidence matrix of a weighted bipartite network having one set of vertices for the documents, one for the words, and edges connecting words to the documents in which they appear with weight equal to their frequency of occurrence.
In PLSA each word-document pair—an edge in the corresponding network picture—is associated with an unobserved variable which denotes one of topical groups. Each edge is assumed to be placed independently at random in the bipartite graph, with the probability that an edge falls between word and document being broken down in the form , where is the probability that the edge belongs to topic , is the probability that an edge with topic connects to word , and is the probability that an edge with topic connects to document . Note that, given the topic, the document and word ends of each edge are placed independently. (Hofmann Hofmann1999 calls this parametrization a “symmetric” one, meaning that the word and the document play equivalent roles mathematically, but in the networks jargon this would not be considered a symmetric formulation—the network is bipartite and the incidence matrix is not symmetric, nor even, in general, square.)
An alternative description of the model, which is useful for actually generating the incidence matrix and which corresponds with our formulation of the equivalent network problem, is that each matrix element takes a random value drawn independently from a Poisson distribution with mean . In the language of networks, each edge is placed with independent probability , where . In our work, where we focus on one-mode networks and a symmetric adjacency matrix instead of an incidence matrix, the parameter is redundant and we omit it.
PLSA involves using the edge probability above to calculate a likelihood for the entire word-document distribution, then maximizing with respect to the unknown probabilities , , and . The resulting probabilities give one a measure of how strongly each word or document is associated with a particular topic , but since the topics are arbitrary, this is effectively the same as simply grouping the words and documents into “communities.” Alternatively, one can use the probabilities to divide the edges of the bipartite graph among the topical groups, giving the text equivalent of the “link communities” that are the focus of our calculations.
A number of methods have been explored for maximizing the likelihood. Mathematically the one most closely related to our approach is the expectation-maximization (EM) algorithm of Hoffman Hofmann1999 ; Hofmann2001 ; Hofmann2004 , though the correspondence is not exact. Hofmann’s work focuses solely on text processing—the connection to networks was not made until later—and the method cannot be translated directly for applications to standard undirected one-mode networks. It is possible to generalize the method to directed one-mode networks in a fairly straightforward fashion, and one might imagine that the undirected case could then be treated as a directed network with directed edges running in both directions between every connected pair of vertices. Unfortunately, this approach does not work, since in general it results in a posterior edge probability which is asymmetric in and . This asymmetry causes problems when we want to associate a community with an undirected edge. If , then the edge may be in one community when considered as an edge from to and a different community when considered as an edge from to .
Rather than applying the standard PLSA model to network problems, therefore, a better approach is to use a model that is intrinsically symmetric from the outset, and this leads us to the formulation in this paper. This symmetric formulation and the corresponding EM algorithm have not, to our knowledge, been used previously for community detection in networks, but several other related approaches have, including ones based on the techniques known as nonnegative matrix factorization (NMF) Lee99 ; Ding2008 and latent dirichlet allocation (LDA) Blei2003 ; Girolami2003 . These formulations have similar goals to ours, but are typically asymmetric (and hence unsuitable for undirected networks) and use different algorithmic approaches for maximizing the likelihood. The NMF formulation is similar in style to an EM algorithm, using an iterative maximization scheme, but the specific iteration equations are different. Several papers have recently proposed using NMF to find overlapping communities Zarei2009 ; Wang2010 ; Psorakis2010 , and the work of Psorakis et al. Psorakis2010 in particular uses NMF with the PLSA model, although again in an asymmetric formulation, and not applied to link communities.
Recent work by Parkinnen et al. Parkinnen2009 and Gyenge et al. Gyenge2010 does consider link communities, in an asymmetric formulation, but uses algorithmic approaches that are different again. Parkinnen et al. Parkinnen2009 use a model that attaches conjugate priors to the parameters and then samples the posterior distribution of link communities with a collapsed Gibbs sampler.
LDA Blei2003 ; Girolami2003 offers an alternative but related approach that also attaches priors to the parameters, but in a specific way that relies on the asymmetric formulation of the model. In Henderson2009 and Zhang07 , LDA is adapted to networks by treating vertex-edge pairs as analogous to word-document pairs and then associating communities with the vertex-edge pairs. This is an interesting approach but differs substantially from the others discussed here, including our own, in which vertex-vertex pairs (i.e., edges) are the quantity analogous to word-document pairs.
Finally, in Appendix C we show that our model can be used to find nonoverlapping communities by viewing it as a relaxation of a nonoverlapping stochastic blockmodel. A corresponding relaxation has been noted previously for a version of NMF and was shown to be related to spectral clustering Ding05 ; Ding2008a .
Appendix B Results for running time
As discussed in Section IV, a naive implementation of the EM equations gives an algorithm that is only moderately fast—not fast enough for very large networks. We described a more sophisticated implementation that prunes unneeded variables from the iteration and achieves significantly greater speed. In this appendix we give a comparison of the performance of the two versions of the algorithm on a set of test networks.
The results are summarized in Table 1, which gives the CPU time in seconds taken to complete the overlapping community detection calculation on a standard desktop computer (circa 2011) for each of the test networks. In these tests we use 100 random initializations of the variables and take as our final result the run that gives the highest value of the log-likelihood. For each network we give the results of three different calculations: (1) the calculation performed using the naive EM algorithm; (2) the calculation using the pruned algorithm with the threshold parameter set to zero, meaning the algorithm gives results identical to the naive algorithm except for numerical rounding; and (3) the calculation performed using the pruned algorithm with , which introduces an additional approximation that typically results in a slightly poorer final value of the log-likelihood, but gives a significant additional speed boost.
The largest network studied, which is a network of links in the online community LiveJournal, is an exception to the pattern: for this network, which contains over 40 million edges, we performed single runs only, with one random initialization each, using the pruned algorithm with and with . The run with took about 50 minutes to complete and the run with took about 11 hours.
| Running conditions | Time (s) | Iterations | Log-likelihood |
|---|---|---|---|
| US air transportation, , , | |||
| naive, | 15.71 | 55719 | |
| fast, | 14.67 | 55719 | |
| fast, | 2.17 | 26063 | |
| Network science collaborations Newman06c , , , | |||
| naive, | 0.93 | 13165 | |
| fast, | 0.82 | 13165 | |
| fast, | 0.13 | 10747 | |
| Network science collaborations, , , | |||
| naive, | 3.19 | 18246 | |
| fast, | 3.15 | 18246 | |
| fast, | 0.49 | 12933 | |
| Network science collaborations, , , | |||
| naive, | 6.16 | 19821 | |
| fast, | 6.09 | 19821 | |
| fast, | 0.94 | 14010 | |
| Running conditions | Time (s) | Iterations | Log-likelihood |
|---|---|---|---|
| Political blogs AG05 , , , | |||
| naive, | 11.42 | 13773 | |
| fast, | 11.46 | 13773 | |
| fast, | 4.14 | 13861 | |
| Physics collaborations Newman01a , , , | |||
| naive, | 4339.57 | 424077 | |
| fast, | 2557.91 | 424077 | |
| fast, | 253.41 | 61665 | |
| Amazon copurchasing Leskovec2003 , , , | |||
| naive, | 170646.9 | 1222937 | |
| fast, | 105042.3 | 1222937 | |
| fast, | 11635.0 | 120612 | |
| LiveJournal Backstrom2006 ; Leskovec2008 , , , | |||
| fast, | 39834.3 | 26163 | |
| fast, | 3093.7 | 1389 | |
While the algorithm described is fast by comparison with most other community detection methods, it is possible that its speed could be improved further (or that the quality of the results could be improved while keeping the speed the same). Two potential improvements are suggested by the text processing literature discussed in Appendix A. The first, from Hofmann Hofmann2004 , is to use the so-called tempered EM algorithm. The second, from Ding et al. Ding2008 , is to alternate between the EM algorithm and a nonnegative matrix factorization algorithm, exploiting the fact that both maximize the same objective function but in different ways.
Appendix C Nonoverlapping communities
In Section VI we described a procedure for extracting nonoverlapping community assignments from network data by first finding overlapping ones and then assigning each vertex to the community to which it belongs most strongly. This procedure was presented as a heuristic strategy for the nonoverlapping problem, but in this appendix we show how it can be derived in a principled manner as an approximation method for fitting the data to a degree-corrected stochastic blockmodel.
Methods have been proposed for discovering nonoverlapping communities in networks by fitting to the class of models known as stochastic blockmodels. As discussed in Ref. Karrer2010SB , it turns out to be crucial that the blockmodel used incorporate knowledge of the degree sequence of the network if it is to produce useful results, and this leads us to consider the so-called degree-corrected blockmodel, which can be formulated as follows. We consider a network of vertices, with each vertex belonging to exactly one community. The community assignments are represented by an indicator variable which takes the value 1 if vertex belongs to community and zero otherwise. To generate the network, we place a Poisson distributed number of edges between each pair of vertices , such that the expected value of the adjacency matrix element is if vertex belongs to group and vertex belongs to group , where and are parameters of the model. To put this another way, the mean value of the adjacency matrix element is for every vertex pair. The normalization of the parameters is arbitrary, since we can rescale all by the same constant if we simultaneously rescale all . In our calculations we fix the normalization so that the sum to unity within each community: for all .
Now one can fit this model to an observed network by writing the probability of generation of the network as a product of Poisson probabilities for each (multi-)edge, then maximizing with respect to the parameters and and the community assignments . Unfortunately, while the maximization with respect to the continuous parameters and is a simple matter of differentiation, the maximization with respect to the discrete variables is much harder. A common way around such problems is to “relax” the discrete variables, allowing them to take on continuous real values, so that the optimization can be performed by differentiation. In the present case, we would allow the to take on arbitrary non-negative values, subject to the constraint that . In effect, now represents the fraction by which vertex belongs to group , with the constraint ensuring that the fractions add correctly to 1.
With this relaxation, we can now absorb the parameters into the , defining with , and the mean number of edges between vertices and becomes . This is an extended form of the overlapping communities model studied in this paper, generalized to include the extra matrix . In the language of link communities, this generalization gives us a model in which the two ends of an edge can belong to different communities. One can think of each end of the edge as being colored with its own color, instead of the whole edge taking only a single color. If is constrained to be diagonal, then we recover the single-color version of the model again.
We can fit the general (nondiagonal) model to an observed network using an expectation-maximization algorithm, just as before. Defining a probability that an edge between and has colors and , the EM equations are now
| (14) |
and
| (15) |
By iterating these equations we can find a solution for the parameters . But and, summing both sides over , we get , since . Hence
| (16) |
Thus we can calculate the values of and once we have these we can then reverse the relaxation of the model by rounding the values to zero or one, which is equivalent to assigning each vertex to the community for which is largest, or equivalently the community for which is largest.
Thus the final algorithm for dividing the network is simply to iterate the EM equations to convergence and then assign each vertex to the community for which is largest. This is precisely the algorithm that we used in Section VI, except that the model is generalized to include the matrix , where in our original calculations this matrix was absent which is equivalent to assuming it to be diagonal. In our experiments, however, we have found that even when we allow to be nondiagonal, the algorithm commonly chooses a diagonal value anyway, which implies that the output of our original algorithm and the generalized algorithm should be the same. (We note that in practice the diagonal version of the algorithm runs faster, and that both are substantially faster than the vertex moving heuristic proposed for the stochastic blockmodel in Ref. Karrer2010SB .)
It is entirely possible, however, that there could be networks with interesting nondiagonal group structure that could be detected using the more general model. The model including the matrix can in principle find disassortative community structure—structure in which connections are less common within communities than between them—as well as the better studied assortative structure. For example, the model can detect bipartite structure in networks, whereas the unadjusted model can not.
References
- (1) M. Girvan and M. E. J. Newman, Community structure in social and biological networks. Proc. Natl. Acad. Sci. USA 99, 7821–7826 (2002).
- (2) S. Fortunato, Community detection in graphs. Phys. Rep. 486, 75–174 (2010).
- (3) L. Danon, J. Duch, A. Diaz-Guilera, and A. Arenas, Comparing community structure identification. J. Stat. Mech. P09008 (2005).
- (4) P. W. Holland, K. B. Laskey, and S. Leinhardt, Stochastic blockmodels: Some first steps. Social Networks 5, 109–137 (1983).
- (5) Y. J. Wang and G. Y. Wong, Stochastic blockmodels for directed graphs. Journal of American Statistical Association 82, 8–19 (1987).
- (6) T. A. Snijders and K. Nowicki, Estimation and prediction for stochastic blockmodels for graphs with latent block structure. Journal of Classification 14, 75–100 (1997).
- (7) A. Clauset, C. Moore, and M. E. J. Newman, Hierarchical structure and the prediction of missing links in networks. Nature 453, 98–101 (2008).
- (8) E. M. Airoldi, D. M. Blei, S. E. Fienberg, and E. P. Xing, Mixed membership stochastic blockmodels. J. Mach. Learn. Res. 9, 1981–2014 (2008).
- (9) Y.-Y. Ahn, J. P. Bagrow, and S. Lehmann, Link communities reveal multi-scale complexity in networks. Nature 466, 761–764 (2010).
- (10) T. S. Evans and R. Lambiotte, Line graphs, link partitions, and overlapping communities. Phys. Rev. E 80, 016105 (2009).
- (11) J. Parkinnen, A. Gyenge, J. Sinkkoken, and S. Kaski, A block model suitable for sparse graphs. In Proceedings of the 7th International Workshop on Mining and Learning with Graphs, Association of Computing Machinery, New York (2009).
- (12) A. Gyenge, J. Sinkkonen, and A. A. Benczúr, An efficient block model for clustering sparse graphs. In Proceedings of the 8th International Workshop on Mining and Learning with Graphs, pp. 62–69, Association of Computing Machinery, New York (2010).
- (13) M. E. J. Newman and M. Girvan, Finding and evaluating community structure in networks. Phys. Rev. E 69, 026113 (2004).
- (14) S. Fortunato and M. Barthélémy, Resolution limit in community detection. Proc. Natl. Acad. Sci. USA 104, 36–41 (2007).
- (15) B. H. Good, Y.-A. de Montjoye, and A. Clauset, Performance of modularity maximization in practical contexts. Phys. Rev. E 81, 046106 (2010).
- (16) X. S. Zhang, R. S. Wang, Y. Wang, J. Wang, Y. Qiu, L. Wang, and L. Chen, Modularity optimization in community detection of complex networks. Europhys. Lett. 87, 38002 (2009).
- (17) P. J. Bickel and A. Chen, A nonparametric view of network models and Newman–Girvan and other modularities. Proc. Natl. Acad. Sci. USA 106, 21068–21073 (2009).
- (18) B. Karrer and M. E. J. Newman, Stochastic blockmodels and community structure in networks. Phys. Rev. E 83, 016107 (2011).
- (19) M. Molloy and B. Reed, A critical point for random graphs with a given degree sequence. Random Structures and Algorithms 6, 161–179 (1995).
- (20) M. E. J. Newman, S. H. Strogatz, and D. J. Watts, Random graphs with arbitrary degree distributions and their applications. Phys. Rev. E 64, 026118 (2001).
- (21) This is a special case of the general observation that the log of the average of any set of numbers is never less than the average of the log, since the logarithm is concave down. If the numbers in question are and the average is taken with weights this observation leads immediately to the inequality given.
- (22) I. Psorakis, S. Roberts, and B. Sheldon, Soft partitioning in networks via Bayesian non-negative matrix factorization. In 24th Annual Conference on Neural Information Processing Systems, Workshop on Networks Across Disciplines: Theory and Applications (2010).
- (23) If the value of is greater than , then it is possible inadvertently to prune all of the colors from a vertex, leaving it in no community at all. To avoid this, we must choose , which we have done in all the calculations presented here.
- (24) W. W. Zachary, An information flow model for conflict and fission in small groups. Journal of Anthropological Research 33, 452–473 (1977).
- (25) D. E. Knuth, The Stanford GraphBase: A Platform for Combinatorial Computing. Addison–Wesley, Reading, MA (1993).
- (26) M. T. Gastner and M. E. J. Newman, The spatial structure of networks. Eur. Phys. J. B 49, 247–252 (2006).
- (27) M. Barthélémy, Spatial networks. Physics Reports 499, 1–101 (2011).
- (28) M. Zarei, D. Izadi, and K. A. Samani, Detecting overlapping community structure of networks based on vertex vertex correlations. J. Stat. Mech. P11013 (2009).
- (29) F. Wang, T. Li, X. Wang, S. Zhu, and C. Ding, Community discovery using nonnegative matrix factorization. Data Mining and Knowledge Discovery 22, 493–521 (2011).
- (30) A. Lancichinetti, S. Fortunato, and F. Radicchi, Benchmark graphs for testing community detection algorithms. Phys. Rev. E 78, 046110 (2008).
- (31) A. Lancichinetti and S. Fortunato, Community detection algorithms: A comparative analysis. Phys. Rev. E 80, 056117 (2009).
- (32) T. Hofmann, Probabilistic latent semantic indexing. In Proceedings of the 22nd Annual International ACM Conference on Research and Development in Information Retrieval, pp. 50–57, Association of Computing Machinery, New York (1999).
- (33) T. Hofmann, Unsupervised learning by probabilistic latent semantic analysis. Mach. Learn. 42, 177–196 (2001).
- (34) T. Hofmann, Latent semantic models for collaborative filtering. ACM Trans. Inf. Syst. 22, 89–115 (2004).
- (35) D. D. Lee and H. S. Seung, Learning the parts of objects by nonnegative matrix factorization. Nature 401, 788–791 (1999).
- (36) C. Ding, T. Li, and W. Peng, On the equivalence between non-negative matrix factorization and probabilistic latent semantic indexing. Comput. Stat. Data Anal. 52, 3913–3927 (2008).
- (37) D. M. Blei, A. Y. Ng, and M. I. Jordan, Latent Dirichlet allocation. J. Mach. Learn. Res. 3, 993–1022 (2003).
- (38) M. Girolami and A. Kabán, On an equivalence between plsi and lda. In Proceedings of the 26th Annual International ACM Conference on Research and Development in Information Retrieval, pp. 433–434, Association of Computing Machinery, New York (2003).
- (39) K. Henderson and T. Eliassi-Rad, Applying latent Dirichlet allocation to group discovery in large graphs. In Proceedings of the 2009 ACM Symposium on Applied Computing, pp. 1456–1461, Association of Computing Machinery, New York (2009).
- (40) H. Zhang, B. Qiu, C. L. Giles, H. C. Foley, and J. Yen, An LDA-based Community Structure Discovery Approach for Large-Scale Social Networks. In Proceedings of the IEEE International Conference on Intelligence and Security Informatics, pp. 200–207 (2007).
- (41) C. Ding, X. He, and H. D. Simon, On the equivalence of nonnegative matrix factorization and spectral clustering. In Proceedings of the SIAM Data Mining Conference, pp. 606–610 (2005).
- (42) C. Ding, T. Li, and M. Jordan, Nonnegative matrix factorization for combinatorial optimization: Spectral clustering, graph matching, and clique finding. In Proceedings of the 8th IEEE International Conference on Data Mining, pp. 183–192 (2008).
- (43) M. E. J. Newman, Finding community structure in networks using the eigenvectors of matrices. Phys. Rev. E 74, 036104 (2006).
- (44) L. A. Adamic and N. Glance, The political blogosphere and the 2004 US election. In Proceedings of the WWW-2005 Workshop on the Weblogging Ecosystem (2005).
- (45) M. E. J. Newman, The structure of scientific collaboration networks. Proc. Natl. Acad. Sci. USA 98, 404–409 (2001).
- (46) J. Leskovec, L. A. Adamic, and B. A. Huberman, The dynamics of viral marketing. ACM Trans. Web 1 (2007).
- (47) L. Backstrom, D. Huttenlocher, J. Kleinberg, and X. Lan, Group formation in large social networks: Membership, growth, and evolution. In Proceedings of the 7th ACM International Conference on Knowledge Discovery and Data Mining, pp. 44–54, Association of Computing Machinery, New York (2006).
- (48) J. Leskovec, K. J. Lang, A. Dasgupta, and M. W. Mahoney, Community structure in large networks: Natural cluster sizes and the absence of large well-defined clusters. Preprint arXiv:0810.1355 (2008).