Investigating the Distribution of Password Choices
Abstract
In this paper we will look at the distribution with which passwords are chosen. Zipf’s Law is commonly observed in lists of chosen words. Using password lists from four different on-line sources, we will investigate if Zipf’s law is a good candidate for describing the frequency with which passwords are chosen. We look at a number of standard statistics, used to measure the security of password distributions, and see if modelling the data using Zipf’s Law produces good estimates of these statistics. We then look at the the similarity of the password distributions from each of our sources, using guessing as a metric. This shows that these distributions provide effective tools for cracking passwords. Finally, we will show how to shape the distribution of passwords in use, by occasionally asking users to choose a different password.
1 Introduction
In this paper we investigate if password frequency distribution can be modelled by Zipf’s Law. Zipf’s Law is a probability distribution where the frequency of an event is inversely proportional to its rank on a frequency table. Here the rank of the most common event is 1, the rank of the second most common is 2, and so on. Zipf’s Law has been observed when looking at the frequencies with which words are used in natural language. In our case, an event will be the use of a particular password by a user. To study this, we use lists of users and passwords from hotmail.com, flirtlife.de, computerbits.ie and rockyou.com. In each case, the list of usernames and passwords were made public after a security incident. The lists have 1800 users to 32 million users each.
There are a number of substantial differences between the choice of passwords and the use of words in natural language. In particular, passwords are usually chosen to be hard to guess and there is a large literature of advice on how to choose passwords (e.g. [10]). However, there are many reasons for not choosing a password according to the recommendations: the advice is arduous, it takes a long time to produce a compliant password, the resulting password is likely to be a hash of letters and numbers that will be hard to memorise. It has even been argued that in general, the cost of choosing one of these passwords is far greater than the cost of losing the information it is trying to protect [6].
Thus, rather than uniformly choosing from a list of non-dictionary words the average user is likely to choose a password which they can easily remember, such as their name, city where they live, favourite team and so on which leads to certain passwords being used more frequently than others. Since Zipf’s Law has been observed in many empirical data sets, we would like to investigate if it provides a reasonable model for the passwords we see. To our knowledge, this is the first paper to study if Zipf’s Law applies to the choice of passwords.
Seeing Zipf’s Law, or any other distribution that is skewed in favour of a number of passwords, has implications for security. If the right distribution of passwords can be identified, the cost of guessing a password can be reduced. One naturally expects that, say, the demographic of users of a site could be used to target an attack; a website with a .ie domain is more likely to have Irish themed passwords than a site with a .fr domain.
Zipf’s law tells us that the number of occurrences of something is inversely proportional to its rank on a frequency table, , where is a parameter that is close to 1. By plotting our datasets and fitting a value for , we will see that, while a Zipf distribution does not fully describe our data, it provides a reasonable model, particularly of the long tail of password choices. The heavy-tailed distribution of password choices could be used by algorithm designers to more efficiently deal with passwords, such those described in [13].
To establish if models, such as a Zipf distribution, can provide useful predictions, we use metrics such as the guesswork [11] and Shannon entropy. We calculate these metrics for both the fitted model and the actual data, and compare the results. We find that the actual metrics are within a factor of two of those predicted by the Zipf distribution, and that the Zipf model usually provides better predictions than a simple uniform model.
Another important question is how much one set of password choices tells us about password choices in general. Consequently, we compare the similarity of our different data sets using guessing as a metric. We will show that by using common passwords from one list, a speed up can be obtained when guessing the passwords from another list.
Finally, we introduce a technique for making the passwords used by users more uniform. When a user sets or resets a password, this technique probabilistically asks them to choose a different password. By basing this technique on the Metropolis-Hastings algorithm, we can design it to produce a more uniform distribution of passwords in use.
2 Overview of Datasets
We collected sets of passwords belonging to sites which were previously hacked and the lists of passwords subsequently publicly leaked. Since the sets were gathered by different methods, such as key-logging, network sniffing or database dumps, the lists may only contain a random, and possibly biased, sample of users. Our lists are from the 2009 hotmail.com list, the 2006 flirtlife.de list, the 2009 computerbits.ie list and the 2009 rockyou.com list.
Some of the lists also give multiple passwords for a small number of users. In this case, we cleaned up the sets by taking the user’s password as the last entry seen for that user, which would hopefully correspond to a user initially typing the wrong password and then typing the correct one, or in the case that the password was changed, the most recent password. We also omitted any user with a whitespace password. After the data was cleaned up, we produced a table ranking passwords in order of decreasing frequency of use by users. Table 1 shows the number of users and the number of distinct passwords for each set of data. As is obvious from the table, for smaller lists there are relatively more unique passwords.
| Site | #users | #pass | |
|---|---|---|---|
| hotmail | 7300 | 6670 | 0.91 |
| flirtlife | 98930 | 43936 | 0.44 |
| computerbits | 1795 | 1656 | 0.92 |
| rockyou | 32603043 | 14344386 | 0.44 |
Table 2 summarises the top 10 passwords in each list. We see that passwords such as 123456 and password are very common. The most common password, “123456” accounts for 0.7% of the total passwords in the hotmail data, 3.3% in the flirtlife list and 2.0% in the rockyou list; “password” accounts for 1.2% of the total passwords of the computerbits list. This indicates that the password distribution is skewed in favour of some common passwords.
The demographic of the users from each list is quite clear form the first 10 passwords of the lists with each ccTLD. Note that the hotmail.com data is believed to have been collected with phishing targeted at the Latino community. The flirtlife list shows clear signs of users speaking German and Turkish, and the computerbits list contains place names of Irish interest. If we look at the data from computerbits and rockyou we see that the name of the website appears in the top ten of each list. It seems likely that this method for choosing a password will also be used on other sites.
| Rank | hotmail | #users | flirtlife | #users | computerbits | #users | rockyou | #users |
|---|---|---|---|---|---|---|---|---|
| 1 | 123456 | 48 | 123456 | 1432 | password | 20 | 123456 | 290729 |
| 2 | 123456789 | 15 | ficken | 407 | computerbits | 10 | 12345 | 79076 |
| 3 | 111111 | 10 | 12345 | 365 | 123456 | 7 | 123456789 | 76789 |
| 4 | 12345678 | 9 | hallo | 348 | dublin | 6 | password | 59462 |
| 5 | tequiero | 8 | 123456789 | 258 | letmein | 5 | iloveyou | 49952 |
| 6 | 000000 | 7 | schatz | 230 | qwerty | 4 | princess | 33291 |
| 7 | alejandro | 7 | 12345678 | 223 | ireland | 4 | 1234567 | 21725 |
| 8 | sebastian | 6 | daniel | 185 | 1234567 | 3 | rockyou | 20901 |
| 9 | estrella | 6 | 1234 | 175 | liverpool | 3 | 12345678 | 20553 |
| 10 | 1234567 | 6 | askim | 171 | munster | 3 | abc123 | 16648 |
By taking obvious passwords and knowing the demographic of the users at which the site is aimed one could build a comprehensive dictionary that could be expected to cover the most common passwords in use at a site. This implies that users, if they are concerned about their accounts being hacked, should use less common passwords. Even something as simple as changing some of the characters to upper-case or writing the word in ‘leet speak’, could be expected to move the password out of the most-common list. These results also confirms something that system administrators have observed empirically, that including a localised dictionary when checking password hashes with crack will usually increase the number of recovered passwords.
3 Distribution of Passwords


In this section we will look at how passwords are distributed in our lists, and see how well these distributions match a Zipf model. We will be interested in the frequency with which we see the most popular password. Where passwords are seen equal numbers of times, we break the tie randomly.
Fig. 3.1 shows the rank vs. frequency of our data plotted on a linear scale for the hotmail list. There are a small number of passwords with a high frequency, and many passwords with a frequency of 1 or 2, which makes the graphs hard to read. Instead, we plot the frequency versus rank on a log-log scale in Figure 3.2. These graphs certainly show evidence of heavy-tailed behaviour, with the frequency dropping much more slowly than exponential. A Zipf distribution would appear as a straight line on a log-log plot, where the parameter is the negative of the slope.
If we fit a least-squares line to this data, as shown in Figure 3.2, we get a slope which is too shallow because a large fraction of the points have frequency 1 or 2, which biases the slope towards 0. To account for this, we follow the method in [1] and bin the data logarithmically, as shown in Figure 3.3. Here, we sum the frequency of all ranks between and . We see that this gives us a slope which better fits our data, and that the line appears a relatively good fit. We use this binned slope as a basis for modelling our data with a Zipf distribution.


An alternate way to view the data is to look at the number of passwords that are each used by exactly users. We plot this in Figure 3.4 on a log-log scale. As explained in [1], if the data is Zipf-distributed, we expect this graph to also be a straight line with slope . As we can see, we also need to bin this data before fitting a line, and the result it shown in Figure 3.5. Again, we see a line is a relatively good fit, with the largest discrepancy appearing for computerbits, the smallest list. The resulting slopes are summarised in Table 3.


| hotmail | flirtlife | c-bits | rockyou | |
|---|---|---|---|---|
| 0.16 | 0.64 | 0.15 | 0.51 | |
| raw | ||||
| 0.44 | 0.69 | 0.45 | 0.78 | |
| binned | ||||
| 2.46 | 1.72 | 2.56 | 1.37 | |
| raw | ||||
| 3.07 | 2.32 | 3.10 | 2.23 | |
| binned | ||||
| 3.27 | 2.45 | 3.22 | 2.28 | |
| binned |
We can also build a maximum liklihood estimator (MLE) for a truncated Zipf distribution, which assigns probability proportional to to passwords with rank . The MLE for is just the number of passwords with non-zero frequency and the MLE for can be constructed using standard techniques as described in [3]. This has the advantage of providing both estimates of the standard error in and a p-value111P-values are calculated by generating samples using a Zipf with the estimated parameters, applying the same process of sorting and estimation. We then calculate the fraction which exceed the Anderson-Darling modification of the K-S statistic of our actual data.. The results are shown in Table 4.
| hotmail | flirtlife | c-bits | rockyou | |
| 0.246 | 0.695 | 0.23 | 0.7878 | |
| MLE | ||||
| 0.009 | 0.001 | 0.02 | ||
| stderr | ||||
| p-value | 0.57 |
We see that the estimates for provided by the MLE for the flirtlife and rockyou data are quite close to those provided by least-squares estimate. The MLE estimates for for the smaller data sets are between the binned values (around 0.45) and the raw values (around 0.15). We see that the p-values indicate that the hotmail, computerbits and rockyou data are unlikely to actually be Zipf distributed. However, for the hotmail and computerbits data the largest discrepancy between the Zipf’s Law and the data is for the first few passwords, indicating that the tail of the data could pass for Zipf with a higher p-value.
To summarise, we have seen that the password frequency data has heavy-tailed characteristics by plotting it on a log-log plot. Both least-squares and maximum-liklihood estimates indicate that if Zipf distributed, the parameter is small. However, p-values indicate the data is unlikely to be drawn exactly from Zipf’s Law.
4 Password Statistics
In this section we will look at a number of statistics relevant to passwords that can be derived from the distribution of how passwords are chosen. We will look at these statistics when calculated directly from our lists, and when calculated using two simple models of the lists. For the real lists, we calculate our statistics assuming the probability of the password of rank appearing is , where is the frequency with which we observed that password and is the total number of passwords observed.
The first model assumes password choices are uniform over all passwords seen, i.e., if the number of passwords is then a password is chosen with probability . The second model assumes that password choices are distributed with a Zipf distribution, i.e., the probability of password with rank being used is , where is the parameter found in Section 3 and K is a normalising constant.
Now let us consider the statistics of interest. Some of these statistics place considerable emphasis on the tail of the distribution, and can be sensitive to relatively small gaps between the model and the data. The first statistic is the guesswork, which is the mean number of guesses needed to correctly guess the password [11], when the ranked list of passwords is known, but the exact password is not. Guesswork is given by
where is the probability of the password of rank .
Another strategy for guessing passwords, given the distribution, is to try the common passwords, but to give up when some fraction of the distribution has been covered. The mean number of guesses associated with this is known as the -guesswork, [11]. Its value is given by
where is the rank of the password when the cumulative probability of being successful is at least . We will work with , so that we cover most of the distribution, but avoid the tail.
The Shannon Entropy,
is a common measure of the number of bits of uncertainty associated with a random variable. While Shannon Entropy has been used as a measure of security of password and key distributions, it does not relate directly to how easy it is to guess a password [9, 7]. Rényi entropy, which is a generalization of Shannon entropy, is given by
It is asymptotically related to the guessability of a password [2, 8]. The min-Entropy is also used as a conservative measure of password/key security [5].
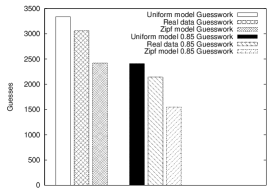
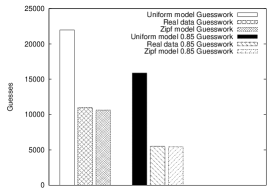
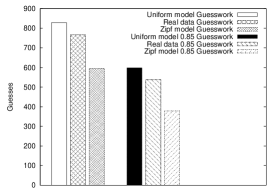
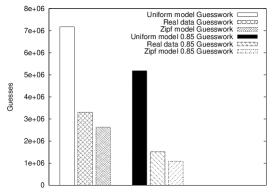
Figure 4.1 compares the guesswork statistics for the uniform model, the real data and the Zipf model. The three bars on the left show the guesswork and the three on the right show the 0.85-guesswork. As expected, the guesswork estimates for the uniform model overestimate the required number of guesses. A relatively small percentage of the total number of passwords in the hotmail.com and computerbits.ie lists are shared. This seems to be reflected in the predictions for guesswork, where the uniform distribution provides a relatively good prediction for hotmail and computerbits, while the Zipf model underestimates. For flirtlife and rockyou, shared passwords make up a larger percentage of the total passwords, and the guesswork is far lower than the uniform guesswork, but the Zipf model provides better predictions, though it still underestimates.
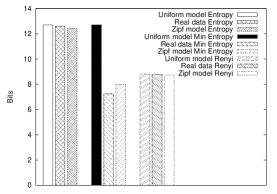
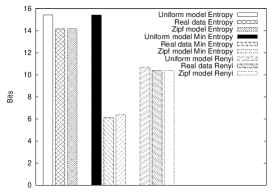
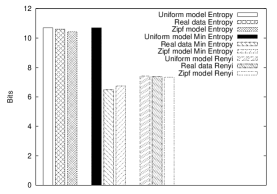
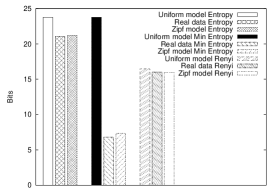
Figure 4.2 shows the Entropy values for the actual data and models. Shannon Entropy is shown on the left, min-Entropy in the middle and Rényi Entropy on the right. The Uniform model, again as expected, tends to overestimate the Entropy. However, for the Rényi Entropy both models and the data seem to give results that are close together. The Zipf model seems to provide relatively good approximations in all cases.
5 The Relation between Distributions
We have seen that while the popular passwords in our lists have things in common (for example, the password 123456), they also show features specific to the website or service. In Section 3 we also saw that all lists have a number of relatively frequently used passwords followed by a long tail of uncommon passwords. In this section, we would like to quantify how much overlap there is between the passwords in these lists.
Consider the problem of guessing the password of a randomly selected user from one of our lists. If we guess the passwords in the order from most popular to least popular in that list, then after guesses we will have guessed the passwords used by
users. If we guess one password at each trial, guessing in this order recovers users’ passwords as quickly as possible, and is in this sense optimal. Figure 5.1 shows as a solid line for each of our datasets. The right-hand axis shows , which we can interpret as the probability of successfully guessing in guesses or the fraction of users whose passwords have been guessed. For example, after 100 guesses using the hotmail data, we have recovered around 400 users’ passwords, which represents a 5% probability of success against a particular user. Since we guess in the optimal order, other orderings must recover fewer users and have a lower probability of success.
If we do not know the optimal order in which to guess the passwords, we may instead guess them in the optimal order for another reference data set. Suppose we have a password of rank in the reference data set, and it has rank in the data set being guessed. If we guess in the order given by the reference data set, after guesses, we will have guessed the passwords of
users, where we assume is zero if password is not in the list we are guessing. If the ordering of the passwords by popularity is the same for both lists, then this function will be , otherwise .
Figure 5.1 shows for each of our lists, when using each of the other lists as a reference. Consider the situation after 1000 trial guesses. The number of users whose passwords match one of these 1000 guesses, , can be seen to vary by almost an order of magnitude, depending on the list used as a reference. Thus, to guess passwords quickly, we would like a good reference list.
Observe that for any list, once we have made more than 10–100 guesses, the larger reference lists lead to more successes than smaller reference lists. This suggests that beyond the most popular passwords, there may be a more general ordering of passwords that is more apparent from the larger data sets. The rockyou list is quite effective and the top one million rockyou passwords cover close to 40% of users in the other lists.


We can apply this directly to a password cracking problem. In December 2010, the password database from Gawker.com was leaked. This database did not contain plaintext passwords, but instead contained hashes of passwords using the well-known DES and Blowfish password hashing schemes. We can use the words in our list as guesses in an off-line cracking attack against the Gawker hashes.
The Gawker dataset contained 748,090 users potentially valid (i.e. 13 character) DES hashes. The hashes use 3844 different salts. A simple perl script can attempt passwords at a rate of approximately 80,000 trials per hour per core on a modern CPU. As the DES hash truncates passwords to 8 characters, we truncate long passwords and reaggregate our previous lists. The number of users whose passwords were cracked after trials is shown in Figure 5.2.

Again, the large lists provide the fastest recovery of passwords, and recovers 40% of users in less than one million trials. Even our smaller lists do well, recovering the passwords of more than 10,000 users in around 1,000 trials (less than one minute of CPU time).
For comparison, in Figure 5.2 we show the results of using a dictionary in lexical order as list of guesses. The dictionary is based on the contents of /usr/share/dict/ on Mac OS X, truncated to 8 characters and sorted using the Unix sort command. This results in a return on effort that is substantially lower than with ranked password lists.
Up to now, we have measured the effectiveness of guessing passwords by counting the number of distinct users whose passwords would have been correctly guessed after guesses. An alternative to this metric, is to look at the number of distinct passwords that have been correctly guessed after guesses. In this case, we recover either zero or one password after each guess.
Figure 5.3 shows the results for our main lists. The optimal rate at which we can recover passwords is 1 per guess, so we plot the optimal line . We see that with about 500,000–5,000,0000 guesses we can obtain about 40% of the passwords, except when guessing rockyou passwords, when the other lists simply do not have enough guesses to reach 40%. Despite this, when guessing passwords from the rockyou dataset, the curves for the other lists stay close to the optimal line, showing that there is a good return for each guess.
Figure 5.4 shows the results for guessing the Gawker passwords, in terms of fraction of passwords recovered. As not all hashes have been cracked and the hashes are salted, we do not know the total number of distinct passwords. However, we can upper bound the number by assuming that all uncracked passwords are unique.


First we note that using other password lists to guess still provides significantly better return than using a dictionary. Indeed, the curves stay relatively close to the optimal line for guesses based on the rockyou data set for between 10 and 10,000 guesses, indicating a success rate of almost 100%. After using all 14 million passwords in this list, we have cracked close to 40% of the passwords. The curve for dictionary words stays a significant distance from the optimal line, suggesting less than 10% of dictionary words are actually used as passwords in the Gawker data set.
In [4], the authors consider various techniques for generating candidate passwords for guessing/cracking. These techniques include dictionary attacks, mangled dictionaries and Markov generators, which can be trained on sample passwords. They assess these techniques using the fraction of passwords recovered in three data sets. They show that in order to recover a substantial fraction of passwords, say 40%, the number of required guesses is over 100 million, unless the password-generating technique is trained on a similar dataset.
Our results show that the use of a large set of passwords as a source of guesses seems to offer considerably better returns than these techniques, being able to recover 40% of passwords in a less than 10 million guesses. Of course, once exhausted, a list provides no more candidate guesses, whereas the mangling and Markov techniques can theoretically yield unbounded data sets.
6 Making Password Choices More Uniform
We have seen that people’s choice of passwords is quite non-uniform, leading to some passwords appearing with a high frequency. The previous section demonstrated one consequence of this: a relatively small number of words can have a high probability of matching a user’s password. It has been relatively common practice to ban dictionary words or common passwords (e.g. the Twitter banned password list [14]), in an effort to drive users away from more common passwords.
In fact, if password choices were uniform (over a large set of passwords) some attacks based on the existence of common passwords become ineffective. Based on this, a scheme was suggested in [13] which prevents uses from choosing particular passwords when they become relatively too popular, in an effort to reduce the non-uniformity of the password distribution.
However, there are well-known schemes that use the output from a random generator and manipulate it to achieve a different distribution. For example, the Metropolis-Hastings scheme allows us to generate a desired distribution by probabilistically accepting/rejecting the steps of a Markov chain . It has a useful feature that the density of the desired distribution does not need to be known, as long as a function proportional to the density is known.
The basic Metropolis-Hastings scheme is as follows:
-
1.
Set , choose .
-
2.
Generate with distribution .
-
3.
With probability
go to step 4 (accept), otherwise return to step 2 (reject).
-
4.
, .
where the terms of the sequence are the output. Usually, the initial outputs are discarded, to wash out the initial choice of and allow the sequence to move closer to its stationary behaviour. This is sometimes referred to as burn in.
We can apply such a scheme to produce a more uniform choice of passwords. Our desired distribution will be uniform over all passwords that users are willing to use, so . Next, we suppose that if a user is asked to choose a password that they choose it independently of previous choices with probability . Since we do not know , we will estimate it in an online fashion, by tracking the frequencies with which users suggest passwords.
This suggests the following scheme when users select a password.
-
1.
Choose a password uniformly from all previously seen passwords.
-
2.
Ask user for a new password .
-
3.
Generate a uniform real number in the range and then increment . If go to step 4 (accept), otherwise return to step 2 (reject).
-
4.
Accept use of as password.
This scheme aims to generate a uniform distribution via users’ choices using the Metropolis-Hastings scheme. There are a few things to note. First, by choosing uniformly over all seen passwords, we aim to avoid the need for a burn-in period, because we begin with a choice drawn from the distribution we want. Second, the password is never actually used, only its frequency , so we can use for if the scheme has seen no previous passwords. Finally, the scheme learns on-line, so the more password choices it sees, the better we expect it will be at making choices uniform.
We implemented this scheme and tested it by choosing passwords from the rockyou dataset, where the probability a password was selected was proportional to its frequency in the dataset. We generated passwords for 1,000,000 users, with the Metropolis-Hastings scheme and, for comparison, when users were free to choose any password. The results are shown in Figure 6.1.

We see that with the Metropolis-Hastings scheme, the distribution is much more uniform, and the frequencies of the most common passwords have been reduced from over 1,000 to just over 10, a reduction of more than two orders of magnitude. One concern with this scheme is that is may reject a user’s choice of password many times, and frustrate the user. However, over these trials, users are asked on average for 1.28 passwords with a variance of 0.61.
We note that this scheme has some similarities to the scheme in [13]. Both schemes must store frequency information about passwords. To avoid storing the passwords in plain text, one could store the frequency of hashed passwords. Our scheme, however, stores information about the frequency with which users choose a password rather than the frequency information for passwords in use. This has some advantages if the frequency table is stolen by an attacker, as even if the hashes can be cracked, frequent choices are not so commonly used because of the Metropolis-Hastings scheme.
Rather than using a simple frequency table, both these schemes can be implemented with count-min sketches. This is an efficient data structure that stores estimates of frequencies. As described in detail in [13], there are advantages to storing the information in a sketch, particularly if the sketch is stolen by an attacker. This is because it uses multiple hash functions with a smaller output space, leading to false-positives if an attacker tries to identify high-frequency passwords.
One difference in these schemes is that the Metropolis-Hastings algorithm aims to make the whole distribution more uniform, rather than limit the frequency of the most popular passwords. As we saw in Section 5 mid-ranked passwords, say from rank 10–1,000, are important for increasing the success rate when guessing a user’s password; these guesses increase the success probability from a fraction of a percent up to a few percent. By moderating the frequency of these passwords, we reduce the effectiveness of attacks that use both high- and mid-ranked passwords.
We also note that while this scheme learns the password frequency distribution on-line, it could also be initialised using a known list of password frequencies. While we chose to target a uniform distribution, this scheme could also be combined with a list of banned passwords (by setting the desired frequency to be zero) or implement a soft-ban on some passwords (by reducing for those passwords).
7 Discussion
We have seen that while Zipf’s law is not an exact match, it seems to provide a passable description of the frequencies with which passwords are chosen. Estimates of the parameter are considerably less than one. While this might be interpreted as indicating a strongly heavy tailed behaviour, another interpretation is that as the distribution becomes uniform, which is actually desirable for passwords. These observations may be of use to algorithm designers, for dimensioning data structures or even taking advantage of the relatively heavy-tailed nature of users’ choices.
We also see that fitting a distribution provides relatively good approximations of the Shannon Entropy, guesswork and other statistics that are of interest when assessing a password distribution. Using a uniform model, where all passwords are equally likely, provides reasonable approximations for the data sets with smaller , but provides a poor estimate of min-Entropy.
We have seen that demography of the userbase choosing the passwords can be evident in the most popular passwords, and even the name of the website is a likely password. Some sites, for example Twitter, have noticed this and implement banned password lists [14], which includes many of the more common passwords, including the name of the site. This also gives weigth to the advice that administrators checking the security of passwords in use at their site using password cracking software should include custom dictionaries including locally used terms.
The Zipf distribution decays relatively slowly, so we expect there to be a large number of relatively commonly chosen passwords. We investigated if these passwords change much from one list to another. We see that this is the case, and that while not optimal, larger lists provide good guidance about the ranking of passwords in other lists. We’ve demonstrated that this can provide a significant speedup in guessing or cracking passwords with moderate numbers of guesses, particularly over simple dictionary attack, but also over a range of the guess-generating techniques described in [4].
An attacker who has collected leaked passwords from a collection of websites has a useful starting point for cracking a password. If a hashed password is exposed, the time for an attacker to try, say, 20 million passwords is relatively small, even on a single CPU. We note that this adds some extra weight to the advice that reusing passwords between websites is a risk, even if there is no way for an attacker to identify which pairs of users are common to the websites. This is because if just one site stores the password in an unhashed format and that password is leaked, then it facilitates the subsequent cracking of that password on a system where the passwords are hashed.
Banning more commonly chosen passwords may result in a more even spread of password in use. Interestingly, we saw that most English dictionary words are not necessarily common passwords: out of more than 220,000 dictionary words, less than 15,000 appeared as passwords in the Gawker data set. We proposed a scheme based on the Metropolis-Hastings algorithm that aims to generate more uniform password choices, without having to know a list of common passwords in advance. A basic implementation of this is relatively straight forward, and could be easily incorporated into a PAM module [12].
8 Conclusion
We have seen that a Zipf distribution is a relatively good match for the frequencies with which users choose passwords. We have also seen that the passwords found in the lists that we have studied have relatively similar orderings. Consequently, passwords from one list provide good candidates when guessing or cracking passwords from another list. Finally, we present a scheme that can guide users to distribute their passwords more uniformly.
Acknowledgment: The authors would like to thank Ken Duffy for thought-provoking comments and Dermot Frost for the offer of spare CPU cycles.
References
- [1] Lada A. Adamic. Zipf, power-laws, and pareto-a ranking tutorial. Xerox Palo Alto Research Center, http://www.hpl.hp.com/research/idl/papers/ranking/ranking.html, 2000.
- [2] Erdal Arikan. An inequality on guessing and its application to sequential decoding. IEEE Transactions on Information Theory, 42, Janurary 1996.
- [3] A. Clauset, C.R. Shalizi, and M.E.J. Newman. Power-law distributions in empirical data. SIAM review, 51(4):661–703, 2009.
- [4] Matteo Dell’Amico, Pietro Michiardi, and Yves Roudier. Password Strength: An Empirical Analysis. In INFOCOM, pages 1–47, 2010.
- [5] Donald E. Eastlake, Jeffrey I. Schiller, and Steve Crocker. RFC 4086: Randomness Requirements for Security. pages 1–47, 2005.
- [6] C. Herley. So long, and no thanks for the externalities: the rational rejection of security advice by users. In Proceedings of the 2009 workshop on New security paradigms, pages 133–144. ACM, 2009.
- [7] D. Malone and W. Sullivan. Guesswork is not a substitute for Entropy. In Proceedings of the Information Technology and Telecommunications Conference. Citeseer, 2005.
- [8] David Malone and Wayne G. Sullivan. Guesswork and entropy. IEEE Transactions on Information Theory, 50(3):525–526, 2004.
- [9] James L. Massey. Guessing and entropy. In In Proceedings of the 1994 IEEE International Symposium on Information Theory, page 204, 1994.
- [10] Mindi McDowell, Jason Rafail, and Shawn Hernan. Cyber security tip st04-002. http://www.us-cert.gov/cas/tips/ST04-002.html, 2009.
- [11] John O. Pliam. The disparity between work and entropy in cryptology. Theory of Cryptography Library: Record, pages 98–24, 1998.
- [12] Vipin Samar. Unified login with pluggable authentication modules (PAM). In Proceedings of the 3rd ACM conference on Computer and communications security (CCS’96), pages 1–10, 1996.
- [13] Stuart Schechter, Cormac Herley, and Michael Mitzenmache. Popularity is everything: a new approach to protecting passwords from statistical-guessing attacks. In HotSec’10 Proceedings of the 5th USENIX conference on Hot topics in security, pages 1–6, 2010.
- [14] twitter.com. Source code from twitter registration page. view-source:https://twitter.com/signup (search for twttr.BANNED_PASSWORDS), 2010.