Phase separation and frustrated square lattice magnetism of Na1.5VOPO4F0.5
Abstract
Crystal structure, electronic structure, and magnetic behavior of the spin- quantum magnet Na1.5VOPO4F0.5 are reported. The disorder of Na atoms leads to a sequence of structural phase transitions revealed by synchrotron x-ray powder diffraction and electron diffraction. The high-temperature second-order transition at 500 K is of the order-disorder type, whereas the low-temperature transition around 250 K is of the first order and leads to a phase separation toward the polymorphs with long-range () and short-range () order of Na. Despite the complex structural changes, the magnetic behavior of Na1.5VOPO4F0.5 probed by magnetic susceptibility, heat capacity, and electron spin resonance measurements is well described by the regular frustrated square lattice model of the high-temperature -polymorph. The averaged nearest-neighbor and next-nearest-neighbor couplings are K and K, respectively. Nuclear magnetic resonance further reveals the long-range ordering below K in low magnetic fields. Although the experimental data are consistent with the simplified square-lattice description, band structure calculations suggest that the ordering of Na atoms introduces a large number of inequivalent exchange couplings that split the square lattice into plaquettes. Additionally, the direct connection between the vanadium polyhedra induces an unusually strong interlayer coupling having effect on the transition entropy and the transition anomaly in the specific heat. Peculiar features of the low-temperature crystal structure and the relation to isostructural materials suggest Na1.5VOPO4F0.5 as a parent compound for the experimental study of tetramerized square lattices as well as frustrated square lattices with different values of spin.
pacs:
75.50.Ee, 75.30.Et, 75.10.Jm, 61.66.FnI Introduction
Among a broad family of low-dimensional and frustrated magnets, systems based on the frustrated square lattice (FSL) model enjoy special attention from theory and experiment. The model entails competing exchange couplings along sides () and diagonals () of the square and is mostly studied for purely Heisenberg Hamiltonian and spin-. Extensive theoretical workMisguich and Lhuillier (2004); Shannon et al. (2004) convincingly established three ordered ground states that emerge for different values of the frustration ratio . The Néel and columnar antiferromagnetic (AFM) states are separated by a critical spin-liquid region around the quantum critical point at (Refs. Darradi et al., 2008; Isaev et al., 2009; Reuther and Wölfle, 2010; Richter and Schulenburg, 2010). At , the columnar AFM phase should border the ferromagnetic (FM) phase. However, the precise nature of this boundary remains controversial. While an earlier report proposed a nematic phase separating the regions of FM and columnar AFM ground states,Shannon et al. (2006) Richter et al.Richter et al. (2010) demonstrated the single abrupt transition without any intermediate phases around .
Experimentally, the FSL-type magnetic behavior has been observed in V+4 compounds with [VOXO4] layers comprising VO5 square pyramids and non-magnetic XO4 tetrahedraMelzi et al. (2000); Carretta et al. (2002); Kaul et al. (2004) (the only known exception is PbVO3 with magnetic layers formed by VO5 pyramids exclusivelyTsirlin et al. (2008); *oka2008). If X is a main group () cation, the leading coupling is AFM , whereas is usually weaker and can be either FM (X = P) or AFM (X = Si, Ge), see also Table 7.Rosner et al. (2002); Kaul et al. (2004); Tsirlin and Rosner (2009) Recent efforts in crystal growthKaul and experimental investigationMelzi et al. (2001); Carretta et al. (2002, 2009); Tsirlin et al. (2009); Bossoni et al. (2011) of such compounds established the columnar AFM ground stateBombardi et al. (2004); Skoulatos et al. (2009); Nath et al. (2009) and revealed simple trends in thermodynamic properties,Kaul ; Nath et al. (2008); Tsirlin et al. (2010) in line with theoretical predictions.Shannon et al. (2004) A thorough comparison between experiment and theory, however, spots certain discrepancies. For example, the sublattice magnetization is gradually reduced from 0.6 in Li2VOSiO4 () to 0.5 in Pb2VO(PO () and 0.4 in SrZnVO(PO ().Bombardi et al. (2004); Skoulatos et al. (2009) By contrast, theory predicts a nearly constant sublattice magnetization of 0.6 in this range of (Ref. Richter et al., 2010). The discrepancy may arise from the spatial anisotropy of the FSL due to the low crystallographic symmetry of Pb2VO(PO and SrZnVO(PO. In fact, none of the reported FSL-type phosphates, VO(PO ( = Pb2, PbZn, SrZn, BaZn, BaCd) with FM , are tetragonal, thereby the effects of the spatial anisotropy are expected.Tsirlin and Rosner (2009)
| Polymorph | Temperature | Space group | |||
|---|---|---|---|---|---|
| (K) | (Å) | (Å) | |||
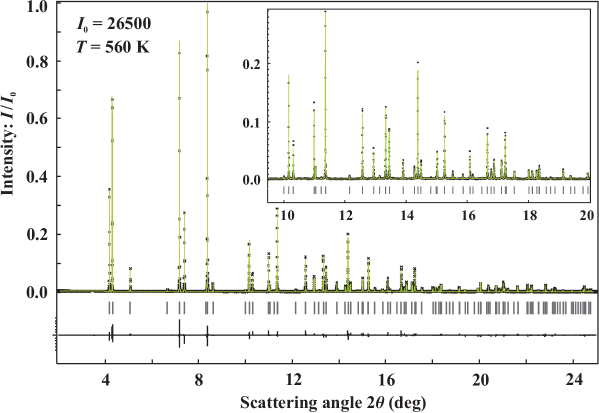
| 560 | 6.39563(1) | 10.65908(2) | 0.031/0.109 | ||
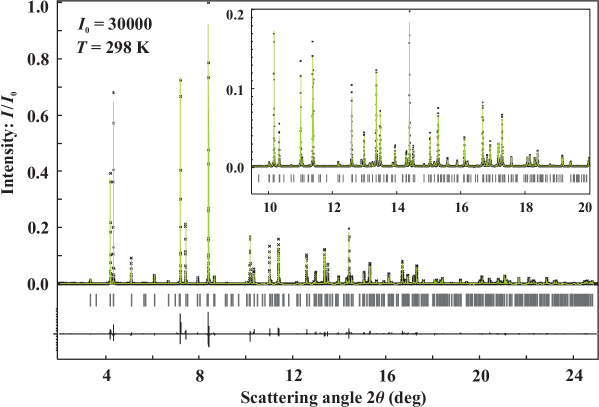
| 298 | 9.03051(2) | 10.62002(3) | 0.035/0.103 | ||
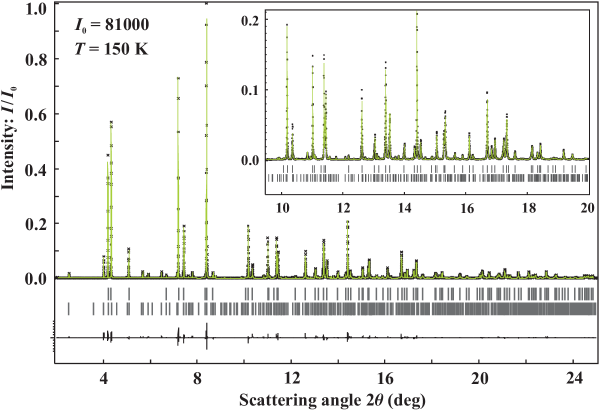
| 150 | 12.76716(2) | 10.57370(4) | 0.033/0.073 | ||
| 150 | 6.37996(4) | 10.5910(1) | 0.022/0.073 |
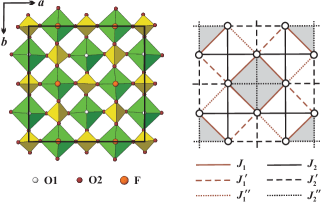
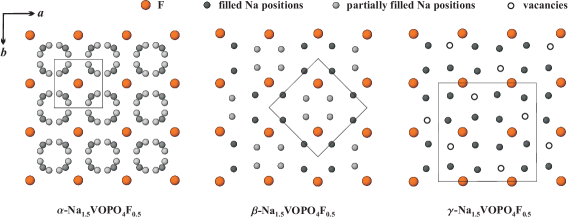
To facilitate the experimental verification of theoretical results for the FSL model, tetragonal systems with a perfect square lattice of magnetic atoms are required. Motivated by this challenge, we explored the structure and properties of Na1.5VOPO4F0.5. This compound was prepared in 2002 by a hydrothermal method. Massa et al.Massa et al. (2002) found a tetragonal crystal structure with the three-dimensional (3D) VOPO4F0.5 framework formed by the FSL-type VOPO4 layers (Fig. 1). Sauvage et al.Sauvage et al. (2006) claimed to prepare the same compound by a high-temperature annealing in air, and reported a very similar structure refinement. Since Na atoms in Na1.5VOPO4F0.5 and related systems are readily deintercalated and exchanged with Li,Sauvage et al. (2006); Gover et al. (2006) the frustration ratio could be tuned, making Na1.5VOPO4F0.5 an appealing FSL system. To explore this possibility, we performed a comprehensive study of the parent compound Na1.5VOPO4F0.5.
The outline of the paper is as follows. We list experimental and computational procedures in Sec. II, and proceed to details of the crystal structure in Sec. III. Further on, we perform thermodynamic and magnetic resonance measurements (Sec. IV) and band structure calculations (Sec. V) to evaluate the low-temperature magnetic behavior and the microscopic magnetic model. The comparison of Na1.5VOPO4F0.5 to known FSL compounds and other structural analogs is given in Sec. VI followed by a summary and outlook.
II Methods
Powder samples of Na1.5VOPO4F0.5 were prepared by a solid-state reaction of Na4P2O7, VO2, and NaF in an evacuated and sealed silica tube at 700 ∘C for 24 hours. The stoichiometric mixtures of reactants were pelletized, placed into corundum crucibles, and covered with lids to avoid the reaction between silica and NaF. Na4P2O7 was obtained by the decomposition of Na2HPO4 in air at 400 ∘C. The bluish-green powders of Na1.5VOPO4F0.5 were single-phase, as confirmed by laboratory x-ray diffraction (XRD) measured with Huber G670 Guinier camera (CuKα1 radiation, angle range, image-plate detector).
High-resolution XRD data for structure refinement were collected in the K temperature range at the ID31 beamline of European Synchrotron Radiation Facility (ESRF) with a constant wavelength of about 0.4 Å. The signal was measured by eight scintillation detectors, each preceded by a Si (111) analyzer crystal, in the angle range deg. The powder sample was contained in a thin-walled borosilicate glass capillary with an external diameter of 0.5 mm. The sample was cooled below room temperature in a He-flow cryostat and heated above room temperature with a hot-air blower. To achieve good statistics and to avoid the effects of the preferred orientation, the capillary was spun during the experiment. The JANA2006 program was used for the structure refinement.Petřiček et al. (2006) Symmetry changes at the structural phase transitions were analyzed with ISODISPLACE program.Stokes et al. (2006)
The samples for an electron diffraction (ED) study were prepared by crushing the powder in ethanol and depositing the suspension on a holey carbon grid. ED patterns were taken at room temperature (RT) and at 100 K using a Philips CM20 microscope equipped with a Gatan cooling holder.
The differential scanning calorimetry (DSC) measurement was performed with a Perkin Elmer DSC 8500 instrument in the temperature range K in argon atmosphere with a heating/cooling rate of 10 K/min. The powder sample of Na1.5VOPO4F0.5 was placed into a corundum crucible.
The magnetic susceptibility of Na1.5VOPO4F0.5 was measured with an MPMS SQUID magnetometer in the temperature range K in applied fields up to 5 T. Heat capacity measurements on a pressed pellet were performed by relaxation technique with a Quantum Design PPMS instrument in the temperature range K and in fields up to 11 T. The data below 1.8 K were collected with a 3He insert.
The electron spin resonance (ESR) measurements were performed at X-band frequency ( GHz) on a Bruker ELEXSYS E500-CW spectrometer, equipped with a continuous He-gas flow cryostat (Oxford Instruments) operating in the temperature range K. The polycrystalline powder sample was fixed in a quartz tube with paraffin and mounted in the center of the microwave cavity. The field derivative of the microwave–absorption signal was detected as a function of the static magnetic field due to the lock-in technique with field modulation. Resonance absorption occurs when the incident microwave energy matches the energy of magnetic dipolar transitions between the electronic Zeeman levels.
The nuclear magnetic resonance (NMR) measurements were carried out using pulsed NMR techniques on 31P (nuclear spin and gyromagnetic ratio MHz/T) nuclei in the temperature range K. We did the measurements at radio frequencies of MHz and MHz, which correspond to applied fields of about T and T, respectively. The spectra were obtained either by sweeping the field or by doing the Fourier transform. The NMR shift was determined by measuring the resonance field of the sample () with respect to a nonmagnetic reference H3PO4 (resonance field ). The 31P spin-lattice relaxation rate was measured by the conventional single saturation pulse method.
Scalar-relativistic band-structure calculations for Na1.5VOPO4F0.5 were performed within the framework of density functional theory (DFT) using the basis set of local orbitals (FPLO9.01-35 code).Koepernik and Eschrig (1999) We applied the local density approximation (LDA) with the exchange-correlation potential by Perdew and WangPerdew and Wang (1992) and a mesh of 216 points in the first Brillouin zone (40 points in the irreducible wedge). Exchange couplings were evaluated by mapping V bands onto a multi-orbital Hubbard model (see Sec. V for further details).
III Crystal structure
III.1 High-temperature -polymorph
According to RT studies of Refs. Massa et al., 2002; Sauvage et al., 2006, Na1.5VOPO4F0.5 has a body-centered tetragonal unit cell with Å and Å. Our RT XRD pattern is largely consistent with this unit cell, although 10 weak reflections remained unindexed. These reflections can be assigned to the supercell and evidence the superstructure formation at RT. The superstructure reflections in Na1.5VOPO4F0.5 disappeared upon heating. Above 500 K, the patterns could be fully indexed on the body-centered tetragonal unit cell that we further refer as -modification, in contrast to -modification at RT (Table 1).
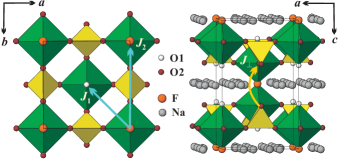
The structure refinementsup for the -phase (Table 2) conforms to the atomic positions given in Ref. Massa et al., 2002. We find a 3D framework of corner-sharing VO5F octahedra and PO4 tetrahedra (Fig. 1). Vanadium atoms form one short bond to the O1 atom (along the direction), four longer bonds to oxygens in the plane (the O2 position), and one long bond to the fluorine atom (also along ), see Table 3. The octahedra are linked via the PO4 tetrahedra in the plane, whereas the fluorine atoms connect the octahedra into pairs along . Na atoms occupy the voids of the resulting framework.
At this point, the question concerning the arrangement of O and F atoms may arise. Since atomic numbers of these elements differ by unity, it is hard to distinguish between O and F using XRD, especially in a powder experiment. The single-crystal refinementMassa et al. (2002) proposed the complete ordering of the O and F atoms. The ordered arrangement of these atoms is also supported by empirical arguments. The O1 position corresponds to the short V–O bond which is typical for oxygen and uncommon for fluorine, e.g., in oxyfluorides.[Forexample:][]aldous2007 Further on, the O2 atoms in the plane are parts of rigid PO4 tetrahedra and can not mix with fluorine. Therefore, fluorine is left to its position with two long bonds to vanadium. Note also that our ESR and NMR experiments (Sec. IV) suggest unique (or very similar) positions for vanadium and phosphorous, respectively, thus indicating the ordered arrangement of O and F atoms below RT.
| Atom | Position | |||||
| Na1 | 0.2651(5) | 0.2651(5) | 0 | 2.9(2) | 0.52(1) | |
| 0.2627(8) | 0.2627(8) | 0 | 0.6(1) | 0.49(2) | ||
| Na2 | 0.394(3) | 0.209(2) | 0 | 3.5(5) | 0.11(1) | |
| 0.336(3) | 0.229(2) | 0 | 0.6(1) | 0.13(1) | ||
| V | 0 | 0 | 0.1982(1) | 0.94(3) | 1 | |
| 0 | 0 | 0.1996(1) | 0.37(4) | 1 | ||
| P | 0 | 0.78(4) | 1 | |||
| 0 | 0.02(6) | 1 | ||||
| O1 | 0 | 0 | 0.3507(3) | 1.8(1) | 1 | |
| 0 | 0 | 0.3555(4) | 0.22(6) | 1 | ||
| O2 | 0.3091(2) | 0 | 0.1634(1) | 0.98(5) | 1 | |
| 0.3082(4) | 0 | 0.1626(2) | 0.22(6) | 1 | ||
| F | 0 | 0 | 0 | 1.2(1) | 1 | |
| 0 | 0 | 0 | 0.22(6) | 1 |
| V–O1 | 1.626(3) | V–O1 | 1.636(2) | V–O1 | 1.629(3) |
| V–O2 | V–O2 | V–O2 | 2.032(9) | ||
| V–O3 | 1.991(5) | V–O3 | 1.986(9) | ||
| V–O4 | 2.023(5) | V–O4 | 1.992(9) | ||
| V–O5 | 2.01(1) | ||||
| P–O2 | P1–O2 | P1–O2 | |||
| P2–O3 | P2–O3 | ||||
| P2–O4 | P3–O4 | ||||
| P3–O5 | |||||
While the O and F atoms in Na1.5VOPO4F0.5 form an ordered framework, the Na atoms are disordered. Our refinement for the -modification identifies two Na positions, (Na1) and (Na2). After constraining the sum of occupancies to the Na1.5VOPO4F0.5 composition and refining atomic displacement parameters (ADPs) together with the occupancies, we found that the position is approximately half-filled, whereas the position is filled by (i.e., twice less Na atoms than in ).not This is in line with Ref. Massa et al., 2002 that reported the occupancies of and for and , respectively (our experiment is done at 560 K compared to 300 K in Ref. Massa et al., 2002, hence a redistribution of Na atoms is possible). By contrast, Ref. Sauvage et al., 2006 assigns Na2 to a position with a negligible occupancy of , i.e., 0.5 atoms per unit cell in compared to approximately 2 atoms in in our refinement.
III.2 Room-temperature -polymorph
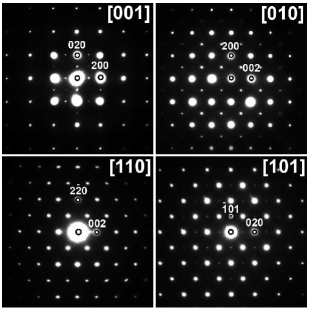
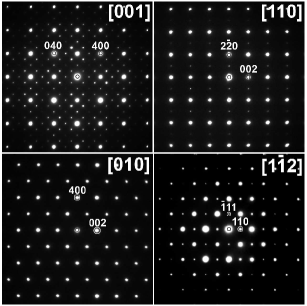
The superstructure formation in the RT -polymorph is confirmed by ED (Fig. 2). While the intense reflections are assigned to the body-centered tetragonal unit cell of the -polymorph, weaker superstructure reflections are clearly visible in the [001], [010], and [101] patterns. XRD and ED suggest a primitive tetragonal unit cell, with the reflection condition , that identifies the space group. This reflection condition is present in the [010] pattern (Fig. 2). The emergence of the forbidden reflections, such as 100 and 010 in the [001] pattern, is caused by the multiple diffraction. Finally, the [110] pattern reveals sharper reflection conditions and corresponding to the body-centered unit cell of the -polymorph. The lack of superstructure reflections, such as , in the [110] ED pattern is due to their zero structure factors, in agreement with the complete absence of these reflections in the XRD pattern.
The superstructure formation at room temperature is related to the partial ordering of the Na atoms in the -modification. The structure refinement (Table 4)sup showed that the VOPO4F0.5 framework remains intact (Table 3), whereas Na atoms are partially ordered in two positions. The Na1 position is completely filled, and the Na2 position is exactly half-occupied under the constraint of the Na1.5VOPO4F0.5 composition.
| Atom | Position | ||||
| Na1 | 0.5144(5) | 0.2314(7) | 0 | 2.8(1) | |
| Na2 | 0.785(1) | 0.028(1) | 0 | 6.0(4) | |
| V | 0.2484(1) | 0.2484(1) | 0.80118(6) | 0.60(1) | |
| P1 | 0 | 0.6(1) | |||
| P2 | 0 | 0 | 0.2558(3) | 0.2(1) | |
| O1 | 0.2499(4) | 0.2499(4) | 0.3529(2) | 1.3(1) | |
| O2 | 0.0957(6) | 0.4031(6) | 0.1623(6) | 0.7(2) | |
| O3 | 0.0949(6) | 0.0949(6) | 0.1662(7) | 0.5(2) | |
| O4 | 0.4037(6) | 0.4037(6) | 0.1617(8) | 1.0(3) | |
| F | 0.2450(4) | 0.2450(4) | 0 | 0.8(1) |
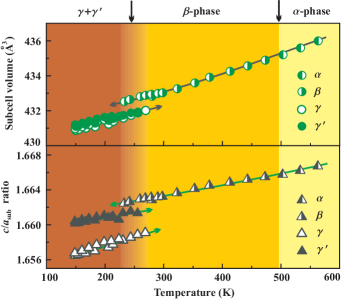
The structure refinements for - and -Na1.5VOPO4F0.5 suggest that the phase transition at 500 K is of the second order (order-disorder type). Indeed, the temperature evolution of lattice parameters (Fig. 3) shows a smooth change in the cell volume around 500 K. The structural change also conforms to symmetry requirements for a second-order transition: the space group can be derived from using the irreducible representation. Similar to second-order transitions in (CuCl)LaNb2O7 (Ref. Tsirlin et al., 2010), we did not observe the transformation by DSC, presumably, due to the small change in the entropy.
III.3 Low-temperature phase separation
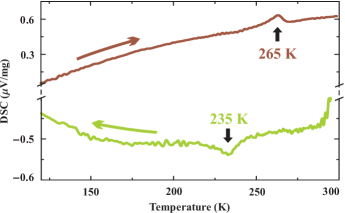
Below RT, one can expect a further ordering of the Na atoms. Indeed, we found another structural transformation around 250 K. This transition is of the first-order type, as shown by: i) the temperature hysteresis (about 235 K on cooling and about 265 K on heating, Fig. 4); ii) the coexistence of the low-temperature and high-temperature phases in a certain temperature range; iii) the abrupt change in the cell volume (Fig. 3). The transition is also revealed by an abrupt change in the ESR linewidth (see Sec. IV.3).
| Atom | Position | ||||
| Na1 | 0.3715(4) | 0.6291(4) | 0 | 0.69(5) | |
| Na2 | 0.1186(4) | 0.5951(4) | 0 | 0.69(5) | |
| Na3 | 0.3486(4) | 0.3764(3) | 0 | 0.69(5) | |
| V | 0.2511(1) | 0.1991(1) | 0.35(3) | ||
| P1 | 0 | 0 | 0.29(3) | ||
| P2 | 0 | 0.29(3) | |||
| P3 | 0.2490(2) | 0.7490(2) | 0.29(3) | ||
| O1 | 0.2440(4) | 0.3522(3) | 0.28(4) | ||
| O2 | 0.0957(7) | 0.0079(4) | 0.3400(6) | 0.28(4) | |
| O3 | 0.5965(7) | 0.3379(6) | 0.28(4) | ||
| O4 | 0.2583(3) | 0.3476(7) | 0.3261(6) | 0.28(4) | |
| O5 | 0.7567(4) | 0.3440(8) | 0.3436(6) | 0.28(4) | |
| F | 0.2463(4) | 0 | 0.28(4) |
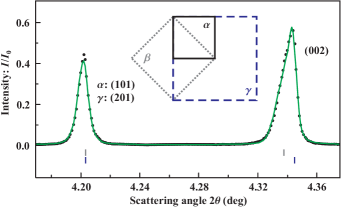
Upon cooling the sample, new reflections appeared below 235 K, and the reflections of the -phase fully disappeared at 210 K. Below 210 K, the pattern could be indexed on a tetragonal unit cell that we further refer as -modification. However, a closer examination showed a complex shape of the reflections with non-zero . In particular, the reflection at could not be fitted as a single peak (Fig. 5). This points to the coexistence of two phases with slightly different lattice parameters.
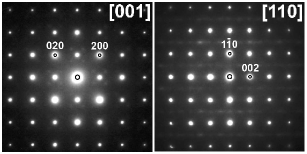
The low-temperature ED study confirmed the presence of two different phases below RT. One of the phases is the ordered -polymorph that shows sharp superstructure reflections of the unit cell (Fig. 6). The crystallites of the second phase are less ordered and reveal diffuse satellites or diffuse intensity lines instead of the superstructure reflections (Fig. 7). The -polymorph has a primitive tetragonal unit cell. The reflection conditions , ([110] pattern) and , ([001] and [010] patterns) were confirmed by XRD, and resulted in the space group. Similar to the [110] pattern of -Na1.5VOPO4F0.5 (Fig. 2), the [010] pattern of the -polymorph contains subcell reflections only.
The second low-temperature phase, further referred as -polymorph, reveals sharp subcell reflections as well as diffuse satellites on the [001] pattern and diffuse lines along on the [110] pattern (Fig. 7). The intensity of the diffuse lines is modulated in a way that the maxima coincide with the superstructure reflections of the -phase. This suggests that the two low-temperatures polymorphs develop a similar supercell, with the long-range order in and the short-range order in . While the ordered structure of -Na1.5VOPO4F0.5 can be determined from XRD (see below), the nature of the short-range order in -Na1.5VOPO4F0.5 is difficult to establish because the compound is unstable under the electron beam.
In XRD, the diffuse intensity produced by the -polymorph is smeared. The remaining subcell reflections are formally equivalent to that of the -phase. The 150 K pattern could be refined as a two-phase mixture of the -phase with the unit cell and the -phase with the unit cell. The refined composition of the mixture yields about 40 % of the -phase. This ratio is nearly constant within the temperature range under investigation.
The structure refinement of -Na1.5VOPO4F0.5 (Table 5)sup identifies three Na positions which are fully occupied, as evidenced by their low ADPs.not The ordering of Na has moderate effect on the framework: the V–O and P–O distances are nearly unchanged compared to the - and -phases (Table 3). The refined structure of -Na1.5VOPO4F0.5 closely resembles the -polymorph (Table 2). Based on the XRD and ED data, we suggest that Na1.5VOPO4F0.5 develops a two-phase mixture at the first-order transition around 250 K. Specific heat, DSC, and ESR measurements (Sec. IV.3 and Ref. sup, ) do not reveal any further structural changes below this temperature.
At low temperatures, the - and -phases have the same subcell volume but a different ratio (Fig. 3). Based on our synchrotron XRD data as well as magnetization, NMR, and ESR measurements (Sec. IV), we conjecture that both phases contain V+4, and their composition is, therefore, similar (within the available resolution). The origin of the phase separation in Na1.5VOPO4F0.5 is presently unclear and should be disclosed in future studies. For a further discussion on Na ordering in Na1.5VOPO4F0.5 and related compounds, we refer the reader to Sec. VI.1.
IV Magnetic behavior
IV.1 Magnetization
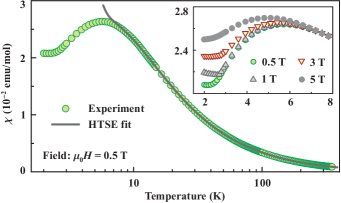
The temperature dependence of the magnetic susceptibility () of Na1.5VOPO4F0.5 is typical for a low-dimensional (and possibly frustrated) antiferromagnet, see Fig. 8. At low fields ( T), the maximum at K manifests the onset of AFM short-range correlations followed by a kink at K due to the long-range ordering (see also the specific heat and NMR spin-lattice relaxation rate data in Figs. 10 and 16, respectively). A stronger magnetic field has a pronounced effect on : the maximum shifts to lower temperatures, whereas slightly increases (see also Fig. 11). Above 50 K, shows a nearly linear behavior indicating the Curie-Weiss paramagnetic regime. No signatures of the transition around 250 K could be observed.
Above 50 K, the fit of the data with the Curie-Weiss law:
| (1) |
yields temperature-independent susceptibility emu/mol (core diamagnetism and Van Vleck paramagnetism), the Curie constant emu K/mol, and the Curie-Weiss temperature K. The effective magnetic moment of 1.71(1) conforms to the expected value of for V+4 where we used and the powder-averaged from ESR (see Sec. IV.3).
Despite the 3D nature of the crystal structure, a low-dimensional magnetic behavior should be expected. Previous studies of V+4 compoundsNath et al. (2008); Tsirlin et al. (2010); Mazurenko et al. (2006) identify the typical orbital ground state driven by the short V–O1 bond along the direction. Since the orbital does not overlap with the orbitals of the axial O1 and F atoms, exchange couplings along the direction are weak. In the case of Na1.5VOPO4F0.5, this implies the formation of VOPO4 magnetic layers, similar to VO(PO FSL-type vanadium phosphates (see the left panel of Fig. 1).Kaul et al. (2004); Nath et al. (2008); Tsirlin and Rosner (2009) Three different phosphorus positions in the -Na1.5VOPO4F0.5 structure lead to a number of inequivalent exchange couplings (Sec. V and Fig. 18). However, the thermodynamic properties in the high-temperature region () should follow the predictions for the ideal FSL model, and allow one to evaluate and , the averaged nearest-neighbor (NN) and next-nearest-neighbor (NNN) couplings on the square lattice.Tsirlin and Rosner (2009)
Based on the above arguments, we fit the magnetic susceptibility of Na1.5VOPO4F0.5 with the high-temperature series expansion (HTSE) for the FSL model:Rosner et al. (2003)
| (2) |
where is similar to Eq. (1), is Avogadro’s number, is the -factor, and with are coefficients of the HTSE. Owing to the internal symmetry of the model, one typically finds two equivalent fits with different and (see Refs. Kaul et al., 2004; Kaul, ; Nath et al., 2008; Tsirlin et al., 2010). For example, fitting the data above 12 K, we arrive at FM K and AFM K (, emu/mol) or AFM K and FM K (, emu/mol). The correct solution can be determined from the specific heat data,Kaul the saturation field,Nath et al. (2008) or band structure calculations.Tsirlin and Rosner (2009); Tsirlin et al. (2010) In the case of Na1.5VOPO4F0.5, band structure calculations provide a solid evidence for leading AFM couplings between next-nearest neighbors (see Sec. V). The analysis of the saturation field also favors the solution with FM and AFM (see below).
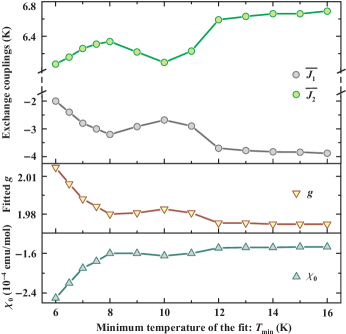
A more subtle problem of the HTSE fit lies in the choice of the fitting range. The convergence of the HTSE depends on the frustration ratio , hence the lower limit of the fitting range () is not universal. Fitting the data with different , we find a stable solution for K (Fig. 9). The resulting emu/mol and are in excellent agreement with the Curie-Weiss fit ( emu/mol, ). At lower , the high-temperature part of the HTSE fit deviates from the Curie-Weiss fit, thereby less accurate estimates of and are obtained. Using K and K, we arrive at that coincides with the frustration regimes of Pb2VO(PO, BaZnVO(PO, and PbZnVO(PO, see Table 7 as well as Refs. Nath et al., 2008, 2009.
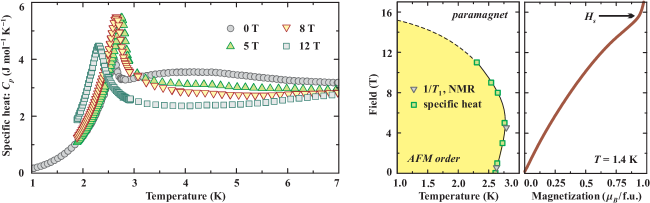
The magnetization curve of Na1.5VOPO4F0.5 (right panel of Fig. 11)Tsirlin et al. (2009) is typical for a two-dimensional (2D) antiferromagnet. The linear increase in the magnetization () at low fields is followed by a slight curvature and the saturation at T. To test our estimates of and against , we use the expression from Ref. Schmidt et al., 2007 for the columnar AFM state () on the regular square lattice:
| (3) |
Assuming from ESR (Sec. IV.3), one finds T which is about 1 T lower than the experimental value. The solution with AFM implies the Néel ordering (antiparallel spins on nearest neighbors), leads to T, and overestimates , which in this case is proportional to instead of in Eq. (3).Schmidt et al. (2007) While the saturation field itself does not allow us to choose the correct solution, DFT results (Sec. V) put forward the sizable AFM and, therefore, FM – AFM regime with an additional interlayer coupling. This interlayer coupling contributes to the saturation field, and explains the underestimate of in the purely 2D model described by Eq. (3). By contrast, the AFM – FM regime overestimates even in the 2D model, thereby any additional couplings will only exaggerate the discrepancy between the exchange integrals and saturation field. This way, we choose the FM – AFM solution, which is confirmed by the similarity to other FSL-type vanadium phosphates.Kaul ; Nath et al. (2008); Tsirlin et al. (2010)
IV.2 Heat capacity
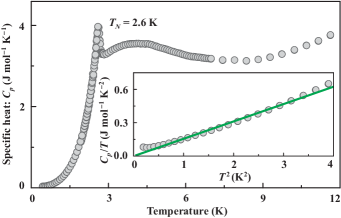
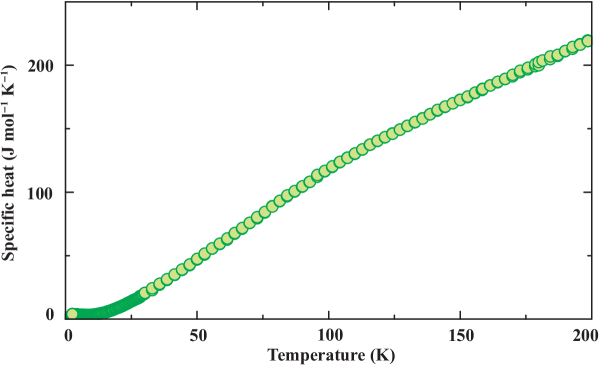
The measured specific heat ()sup of Na1.5VOPO4F0.5 resembles that of BaCdVO(PO and other FSL compounds.Kaul ; Nath et al. (2008); Tsirlin et al. (2010) The sharp anomaly at K is followed by a maximum around 4 K and an increase in above 8 K (Fig. 10). The maximum is a signature of the magnetic contribution , whereas the data above 8 K are dominated by the phonon contribution. Unfortunately, we were unable to fit the high-temperature part with Debye functions and extract the magnetic contribution. The fitting problem may be related to the coexistence of - and -polymorphs having different phonon spectra.
The specific heat maximum around 4.0 K suggests weaker exchange couplings in Na1.5VOPO4F0.5 compared to Pb2VO(PO and PbZnVO(PO that reveal K and the maxima of at a higher temperature of K.Kaul ; Tsirlin et al. (2010) By contrast, Li2VOSiO4 with a similar K has the maximum of at 3.6 K.Melzi et al. (2001); Kaul Since the phonon contribution at 4 K is small, the measured value of is a reasonable estimate for the maximum of . This way, we find that compares well to 0.44, as expected for the unfrustratedSengupta et al. (2003) or moderately frustratedShannon et al. (2004) square lattice, and experimentally observed in a number of FSL compounds.Kaul ; Tsirlin et al. (2010)
The low-temperature evolution of resembles classical antiferromagnets. However, the data do not follow a simple behavior (see the inset of Fig. 10). The origin of this deviation is presently unclear. Note that other FSL-type compounds also show complex low-temperature features in the specific heat. The data for Pb2VO(PO and Li2VOGeO4 can be described by a combination of cubic and linear terms.Kaul In Na1.5VOPO4F0.5, the linear term is vanishingly small, but the cubic term itself poorly fits the data below 2 K.
Heat capacity measurements in magnetic field establish the temperature-vs-field phase diagram of Na1.5VOPO4F0.5 (Fig. 11). With increasing magnetic field, the specific heat maximum is suppressed, whereas the transition anomaly is growing and increases up to 2.8 K at 5 T. Above 5 T, both the anomaly and are gradually suppressed. The overall shape of the phase boundary is typical for 2D antiferromagnets.Nath et al. (2008); Tsirlin et al. (2010); Sengupta et al. (2009) The initial increase in is due to the field-induced anisotropy that weakens quantum fluctuations. Upon further increase in the field, the tendency towards the fully polarized state competes with AFM correlations and impedes the AFM long-range ordering.
IV.3 Electron spin resonance
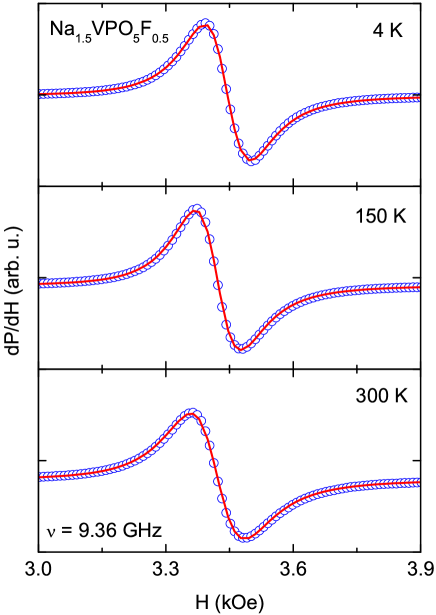
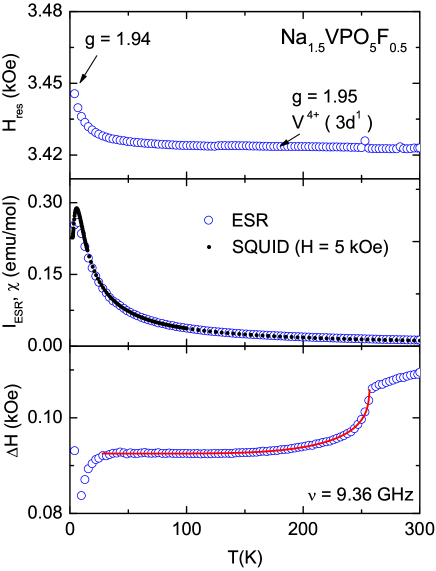
Typical ESR spectra of Na1.5VOPO4F0.5 are shown in Fig. 12. The compound reveals a single exchange-narrowed resonance line which is perfectly described by a Lorentzian curve in the whole temperature range under investigation. The temperature dependence of the corresponding fit parameters, i.e., the resonance field , intensity , and half-width at half-maximum , is illustrated in Fig. 13. At room temperature, the -factor, derived from the resonance field Oe via is found to be , which is a typical value for V4+ () ions coordinated by oxygen atoms in a square pyramid or an octahedron.Abragam and Bleaney (1970) On approaching , the -value decreases only slightly. The integrated ESR intensity nicely matches the static susceptibility obtained from SQUID measurements, and exhibits a maximum around K. This indicates that all vanadium spins are observed by ESR.
The linewidth is Oe at room temperature, and exhibits two anomalies upon cooling. One anomaly is close to , probably due to short-range order effects, while the other one matches the structural transition at K. Similar to the structural phase transition in the quasi one-dimensional magnet CuSb2O6,Heinrich et al. (2003) the change in the ESR linewidth for is well described in terms of a thermally activated behavior:
| (4) |
with the BCS-like mean-field gap . We obtain K, K, Oe, and the residual linewidth Oe. It is interesting to consider the relation between the energy gap and the transition temperature , which yields . This is enhanced compared to the value of 3.52 predicted by mean-field theory for a second-order phase transition. Indeed, the transition at is of the first order, as shown by the temperature evolution of unit cell parameters (Fig. 3).
IV.4 Nuclear magnetic resonance
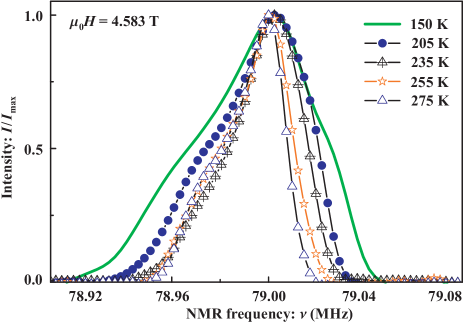
For an nucleus, one expects a single spectral lineNath et al. (2005, 2008, 2008) that is indeed observed in the NMR spectra of Na1.5VOPO4F0.5 in the K temperature range (Fig. 14). Although our structural study (Sec. III) identifies two inequivalent phosphorous positions at 300 K (-phase) and at least three inequivalent phosphorous positions in the -phase below K, this will not necessarily lead to separate lines in the spectra. The line shift for an individual P site is determined by its local environment and the hyperfine couplings to electronic spins on V+4. Since the inequivalent P sites have very similar coordination and similar connections to the four surrounding vanadium atoms (Table 3 and Fig. 18), we believe that the line splitting is too small to be observed in the present experiment. While this does not allow to refine our model of the low-temperature crystal structure and phase separation, the single spectral line facilitates the study of the magnetic properties by NMR.
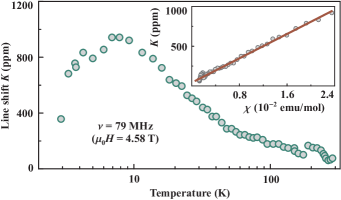
Since our measurements are done on randomly-oriented polycrystalline samples, the asymmetric shape of the spectra corresponds to a powder pattern due to an asymmetric hyperfine coupling constant and an anisotropic susceptibility. The line position was found to shift with temperature, similar to the magnetic susceptibility (Fig. 15). To establish the relation between and , we use the expression:Nath et al. (2009)
| (5) |
where is the temperature-independent chemical shift, is the hyperfine coupling constant, and is the intrinsic (spin) magnetic susceptibility of Na1.5VOPO4F0.5 in units of /Oe per electronic spin (i.e., per formula unit). In order to calculate , we plotted vs. with as an implicit parameter (the inset of Fig. 15).not The linear fit with Eq. (5) over the whole temperature range yields Oe/ that is comparable to hyperfine couplings found in other FSL-type vanadium phosphates.Nath et al. (2009)
For an nucleus, the recovery of the longitudinal magnetization is expected to follow a single-exponential behavior. In Na1.5VOPO4F0.5, the recovery of the nuclear magnetization after a saturation pulse was indeed fitted well by the exponential function
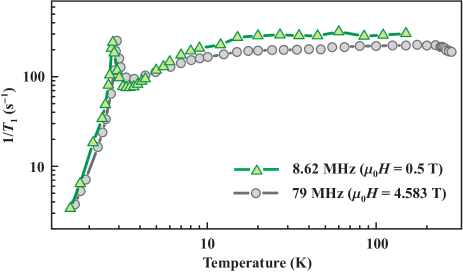
| (6) |
where is the nuclear magnetization at a time after the saturation pulse, and is the equilibrium magnetization. The temperature dependence of is depicted in Fig. 16. Above 10 K, is essentially temperature-independent, which is typical for paramagnetic moments fluctuating fast and at random.Moriya (1956) Below 10 K, decreases slowly, shows a peak around 2.8 K, and further decreases at low temperatures. A similar behavior has been observed in Pb2VO(PO from 31P NMR (Ref. Nath et al., 2009), SrZnVO(PO4)2 from 31P NMR (Ref. Bossoni et al., 2011), VOMoO4 from 95Mo NMR (Ref. Carretta et al., 2002), and Cu(HCO2)D2O from 1H NMR (Ref. Carretta et al., 2000). The decrease in can be explained by the cancellation of antiferromagnetic spin fluctuations at the probed nuclei.Carretta et al. (2000)
The sharp peak in identifies the onset of the long-range magnetic ordering. The peak position depends on the NMR frequency and reveals the field dependence of . In Fig. 11, we plot the two transition temperatures derived from our NMR experiments, and find perfect agreement with the phase boundary obtained from the heat capacity measurements.
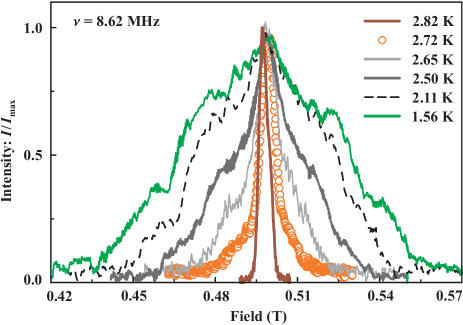
Below , the 31P line measured at 79 MHz broadens abruptly. In order to check whether any extra features could be resolved, we remeasured the spectra at a lower frequency of 8.62 MHz (Fig. 17). Two symmetrical shoulder-like features develop on both sides of the central line and move systematically away from each other with decrease in temperature. The symmetric position and the systematic evolution of the shoulders in the low-frequency low-temperature spectra is an indication of a commensurate magnetic ordering. Our low-temperature spectral shape can be compared to the 7Li-NMR spectra of Li2VOSiO4 reported by Melzi et al.Melzi et al. (2000, 2001) In the columnar AFM phase, they observed a central line and two symmetrical satellites from the single-crystal measurement. In our case, such satellites appear as broad shoulders due to the random distribution of the internal field for the measurements on polycrystalline samples. Nevertheless, the overall spectral shape is consistent with 7Li-NMR results on Li2VOSiO4 and hence points to the columnar AFM ordering in Na1.5VOPO4F0.5.
V Microscopic magnetic model
Despite the tetragonal crystallographic symmetry, the complex low-temperature superstructure of -Na1.5VOPO4F0.5 gives rise to a number of inequivalent superexchange pathways and the overall distortion of the FSL. Using the atomic positions for -Na1.5VOPO4F0.5 (Table 5), we arrive at six different couplings in the plane: , and between nearest neighbors as well as , and between next-nearest neighbors, see Fig. 18. The spin lattice entails regular plaquettes alternated with less regular plaquette-like units having one type of the NNN couplings (either or ) yet different NN couplings.
While it is hardly possible to evaluate all the six aforementioned parameters experimentally, DFT calculations are capable of providing microscopic insight into individual superexchange pathways and establishing realistic spin models for complex crystal structures.Nath et al. (2008); Mazurenko et al. (2006); Tsirlin et al. (2011) In the following, we present DFT results for the ordered structure of -Na1.5VOPO4F0.5. The second low-temperature phase, the -polymorph with the short-range order of Na atoms (Sec. III), is more difficult to model due to the unresolved short-range order, although we may expect a similar scenario with FM couplings between nearest neighbors and AFM couplings between next-nearest neighbors.
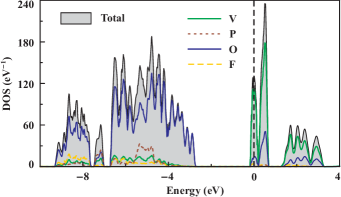
The LDA density of states (DOS) for -Na1.5VOPO4F0.5 identifies oxygen and fluorine valence bands below eV and vanadium bands at the Fermi level (Fig. 19). The vanadium states show a crystal-field splitting into the (below 0.7 eV) and (above 1.3 eV) sublevels, as expected for the octahedral coordination of a transition metal. Further on, the short bond to the axial oxygen atom (O1) splits the bands into the half-filled states lying at the Fermi level and unoccupied states lying between 0.2 eV and 0.7 eV (here, aligns with the crystallographic axis). The positions of the crystal-field levels justify our empirical conclusions on the symmetry of the magnetic orbital that induces leading couplings in the plane (Sec. IV.1). The crystal-field splitting in -Na1.5VOPO4F0.5 closely resembles the positions of the sublevels in Pb2V3O9 (Ref. Tsirlin and Rosner, 2011), Ca(VO)2(PO (Ref. Nath et al., 2008), and other V+4 oxides.
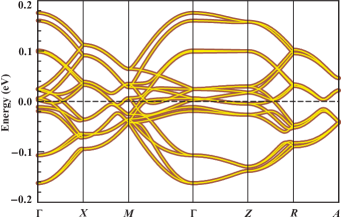
The gapless (metallic) nature of the energy spectrum is a typical problem of LDA due to the underestimate of correlation effects in the V shell. While the correlation effects can be introduced in a mean-field way via the LSDA+ method, the huge size of the unit cell (144 atoms) tempts us to avoid this procedure and apply an LDA-based model approach instead. The latter is remarkably efficient for the evaluation of weak exchange couplings in V+4 compounds.Mazurenko et al. (2006); Tsirlin et al. (2010); Tsirlin and Rosner (2011); Tsirlin et al. (2011) Using Wannier functions with proper orbital characters,Eschrig and Koepernik (2009) we fit 80 vanadium bands with a tight-binding model, and map the resulting hopping parameters () onto the multi-orbital Hubbard model with the effective on-site Coulomb repulsion and on-site Hund’s coupling . The notably low values (below 5 meV) compared to eV identify the strongly correlated limit so that the expression of the Kugel-Khomskii model for the exchange couplings can be applied:Kugel and Khomskii (1982); Mazurenko et al. (2006)
| (7) |
Here, denotes unoccupied orbitals, are hoppings between the orbitals, are hoppings from the (half-filled) to (empty) orbitals, and are the crystal-field splittings between the and orbitals. The first term is AFM superexchange, whereas the second term is FM and arises from the Hund’s coupling in the shell.Kugel and Khomskii (1982); Mazurenko et al. (2006); not Using eV and eV,Tsirlin and Rosner (2011); Tsirlin et al. (2011) we arrive at individual exchange couplings listed in Table 6.
The weak exchange couplings in Na1.5VOPO4F0.5 are a severe challenge for computational methods. In contrast to PbZnVO(PO and Pb2V3O9 (Refs. Tsirlin et al., 2010; Tsirlin and Rosner, 2011), the calculated ’s are exclusively AFM, despite the fits of the magnetic susceptibility (Sec. IV.1) reveal the presence of FM exchange. This problem is likely unavoidable and restricts the DFT results to qualitative conclusions that are nevertheless essential for understanding the system. The sizable AFM NNN couplings, compared to weaker NN couplings, support the FM – AFM scenario. The weakest NNN exchange is about 70 % of and so that a spatial anisotropy of the diagonal couplings is moderate, as in Pb2VO(PO and PbZnVO(PO (Refs. Tsirlin and Rosner, 2009; Tsirlin et al., 2010). By contrast, the difference between and () is about 5 K, which is larger than the experimental K. This suggests a sizable spatial anisotropy of the NN couplings.
| Distance | ||||
|---|---|---|---|---|
| (Å) | (K) | (K) | (K) | |
| 4.659 | 0.7 | 0.6 | ||
| 4.586 | 1.2 | 1.1 | ||
| 4.659 | 6.2 | 0 | 6.2 | |
| 6.384 | 15.1 | 0 | 15.1 | |
| 6.356 | 13.5 | 0 | 13.5 | |
| 6.410 | 9.8 | 0 | 9.8 | |
| 4.210 | 1.7 | 0 | 1.7 |
Owing to the complex structure of the spin lattice, the relation between the averaged couplings (, ) and individual exchanges is more intricate than in VO(PO.Tsirlin and Rosner (2009) Since there are two bonds yet single and bonds per lattice site, one writes . Applying this expression to the DFT estimates in Table 6, we arrive at K that is twice larger than the experimental K. A similar two-fold overestimate is found in VO(PO phosphates: compare K from DFT to K from the experiment in PbZnVO(PO (Ref. Tsirlin et al., 2010). This gives a strong support to the DFT results, and ascribes their apparent inaccuracy to systematic errors that do not alter qualitative trends.
The notable reduction in (6.5 K in Na1.5VOPO4F0.5 vs. K in PbZnVO(PO and similar phosphates) can be traced back to longer bonds comprising the superexchange pathways. The relevant parameters are V–O and O–O distances.Tsirlin et al. (2010) The latter are edges of the PO4 tetrahedra and stay nearly constant, whereas the former are flexible. In Na1.5VOPO4F0.5, the V–O distances exceed 2.0 Å (Table 3) and contrast with shorter ( Å) distances for leading AFM couplings in VO(PO (Table IV in Ref. Tsirlin and Rosner, 2009). Na1.5VOPO4F0.5 resembles Li2VOSiO4 in terms of the diagonal couplings ( K and 6.3 K, respectively), despite the fact that the PO4 anion is smaller than SiO4.
While the nature of the diagonal couplings in Na1.5VOPO4F0.5 is readily comprehended, the evaluation of the NN couplings remains a challenge because of the computational inaccuracies of DFT. To make things even more complicated, the effects of the spatial anisotropy cannot be resolved by the available experimental data on Na1.5VOPO4F0.5. The orthorhombic distortion of the FSL[Forexample:][]starykh2004; *sindzingre2004; *bishop2008 favors a certain direction for the spin columns, stabilizes the columnar AFM state and, therefore, increases the saturation field . When the experimental exceeds the prediction of the regular FSL model, their difference approximates the magnitude of the orthorhombic distortion for NN couplings.Tsirlin et al. (2009) The spin lattice of Na1.5VOPO4F0.5, however, lacks any orthorhombic distortion and rather shows a complex tetragonal superstructure with three inequivalent couplings (, and ). The couplings of each type run along both dimensions of the square lattice (Fig. 18) and do not stabilize the columnar AFM state, thereby no effect on should be expected. Presently, we are unable to give an experimental-based estimate of the spatial anisotropy in Na1.5VOPO4F0.5. As long as the DFT results are considered, appreciable anisotropy effects should be expected (Table 6).
The last important feature of Na1.5VOPO4F0.5 is the sizable interlayer coupling . It is related to dimers of octahedra sharing the fluorine atom (right panel of Fig. 1), and couples each lattice site to one of the neighboring layers only. Since the magnetic saturation requires all spins to be parallel, the presence of the AFM interlayer coupling increases the saturation field. Eq. (3) can be rewritten as
| (8) |
to yield K, where we used K, K, T, and . This experimental estimate of compares well to the calculated value of 1.7 K (Table 6) and provides additional justification for the reliability of our DFT results.
The interlayer coupling in Na1.5VOPO4F0.5 amounts to 20 % of and is larger than in any of the known FSL compounds (see Table 7). arises from the short V–V distance of 4.21 Å, which is in fact the shortest V–V separation in the structure. There are comparable V–V separations of Å in Li2VOSiO4 and Li2VOGeO4, but the lack of the bridging fluorine atom reduces the interlayer coupling to K and drives these compounds to a perfectly 2D regime.Rosner et al. (2002, 2003) The VO(PO phosphates show even weaker interlayer couplings KTsirlin et al. (2010) owing to the V–V separations of Å. The influence of the sizable interlayer coupling on the magnetism of Na1.5VOPO4F0.5 is further discussed in Sec. VI.2.
VI Discussion
VI.1 Crystal structure
The crystal structure of Na1.5VOPO4F0.5, as reported in Refs. Massa et al., 2002; Sauvage et al., 2006, is deceptive in its simplicity. It differs from our findings for Na1.5VOPO4F0.5 prepared by high-temperature solid-state method. The -type structure, previously found at RT, is observed above 500 K only. The actual RT structure is marginally different, owing to the partial ordering of the Na atoms in the -polymorph. Low-temperature studies reveal the formation of the complex superstructure in the -polymorph and the phase separation. The apparent differences in the RT structure are probably related to a variety of preparation procedures that could lead to slight deviations in the sample composition, especially the O/F ratio (see Sec. I). In our case, magnetization measurements combined with ESR and NMR local probes confirm the oxidation state of +4 for the vanadium atoms and ensure the ordered arrangement of O and F. Since our samples are synthesized from stoichiometric mixtures of the reactants, the Na1.5VOPO4F0.5 composition is safely established.
The course of the structural transformations in Na1.5VOPO4F0.5 is reminiscent of isotypic NaPO4F1.5 fluorophosphates with = Fe, Cr, V, Al, and Ga.Le Meins et al. (1999) These compounds accommodate trivalent cations by substituting F for O1. This way, the cation attains a nearly regular octahedral coordination with fluorines in the axial positions. High-temperature structures are always of the -type, but low-temperature features are variable. When = Fe and V+3, the RT structure is of the -type, with , space group, and partially ordered Na atoms. The complete ordering of Na takes place in the orthorhombic -phase () below RT. By contrast, the fluorophosphates with = Cr, Al, and Ga drop directly to a -type RT polymorph having , space group, and still disordered Na atoms. Below RT, these compounds presumably undergo another phase transition, but its nature has not been established. Na1.5VOPO4F0.5 complements this welter of polymorphs and transitions by the ordered tetragonal -phase and the phase separation below RT.
Although the origin of the structural transformations in NaPO4F1.5 is far from being clear, electronic effects should likely be ruled out. Indeed, magnetic (Cr) and non-magnetic (Al, Ga) trivalent cations give rise to the same sequence of the transitions.Le Meins et al. (1999) In Na1.5VOPO4F0.5, the effect is even more tangible. Weak exchange couplings manifest themselves below K which is far below the first-order structural transition and phase separation around 250 K. In Fig. 21, we plot the arrangement of Na atoms in different polymorphs of Na1.5VOPO4F0.5. The partial filling of the two multiple-site positions in the -polymorph is an indication of Na mobility. -Na1.5VOPO4F0.5 reveals clusters of ordered (Na1) and partially disordered (Na2) atoms. In -Na1.5VOPO4F0.5, we find a peculiar ordering pattern reminiscent of a -depleted square lattice. A similar pattern is observed in -Na1.5FePO4F1.5, the only example of the complete cation ordering in this structure type.Le Meins et al. (1999) The structural transformations/phase separation are possibly caused by electrostatic interactions between Na and F atoms together with an apparent difficulty of finding a symmetric configuration for the -filled “square lattice” of Na.
A notable feature of the phase separation in Na1.5VOPO4F0.5 is the lack of any visible compositional changes. When electronic degrees of freedom are inactive, phase separation is typically driven by a size mismatch and results in different compositions of the two phases.[Forexample:][]NdLiTiO3-2007; *woodward2008 In Na1.5VOPO4F0.5, the fully ordered structure of the -phase implies the ideal Na1.5VOPO4F0.5 composition and imposes the same composition for the -phase, as further confirmed by the unique oxidation state of +4 for vanadium. Neither ESR nor NMR reveal any differences between the two phases coexisting at low temperatures. Another surprising observation is the macroscopic scale of the separated phases: both - and -polymorphs show narrow XRD reflections corresponding to well-defined crystallites rather than nanoscale domains. These unusual features suggest that a further study of the phase separation in Na1.5VOPO4F0.5 could be insightful.
VI.2 Magnetic properties
| Compound | Ref. | ||||||
| BaCdVO(PO | 3.2 | 4.8 | 0.21 | Nath et al.,2008 | |||
| SrZnVO(PO | 8.9 | 12.2 | 0.22 | Kaul, | |||
| BaZnVO(PO | 9.3 | 10.6 | 0.36 | Kaul, | |||
| Pb2VO(PO | 9.4 | 10.7 | 0.33 | Kaul et al.,2004 | |||
| PbZnVO(PO | 10.0 | 11.3 | 0.35 | Tsirlin et al.,2010 | |||
| Na1.5VOPO4F0.5 | 6.6 | 7.6 | 0.07 | 0.34 | This work | ||
| Li2VOSiO4 | 0.6 | 6.3 | +10.5 | 6.3 | 0.03 | 0.44 | Kaul, |
| Li2VOGeO4 | 0.8 | 4.1 | +5.1 | 4.2 | 0.05 | 0.50 | Kaul, |
Our detailed study of the magnetic properties and electronic structure confirms the assignment of Na1.5VOPO4F0.5 to the quasi-2D FSL-type spin model. The ultimate goal of finding an ideal FSL with FM is, however, defeated by the complexity of structural transformations and low-temperature phase separation. The structural changes are not caused by the magnetic frustration (Sec. VI.1), while the magnetism, in turn, is marginally influenced by the spin lattice distortion. Similar to VO(PO, thermodynamic properties conform to the regular FSL model. A closer and microscopic look, based on DFT, detects sizable deviations from the regular model, although experimental data give little information on such effects. In contrast to our earlier conjecture in Ref. Tsirlin et al., 2009, the underestimate of the saturation field should be ascribed to the interlayer coupling (Sec. V).
Despite seeming to be overcomplicated at first glance, the spin lattice comprising six inequivalent intralayer couplings (right panel of Fig. 18) expands the family of FSL-type models realized in inorganic compounds. The VO(PO phosphates reveal a somewhat more simple, orthorhombic distortion of the FSL.Tsirlin and Rosner (2009); [Forexample:][]starykh2004; *sindzingre2004; *bishop2008 By contrast, the tetragonal superstructure in -Na1.5VOPO4F0.5 splits the square lattice into plaquettes (Fig. 18) and therefore relates to a different branch of theoretical results. The models of tetramerized square lattices, also known as square lattices with plaquette structure, exhibit a quantum phase transition between the long-range-ordered and gapped ground states but so far lack any prototype materials.[Forexample:][]singh1999; *kotov2001; *ueda2007; *albuquerque2008; *wenzel2008 A cation substitution/intercalation in Na1.5VOPO4F0.5 could be a way to obtain further compounds of this type, although the possible problem of the phase separation should not be overlooked.
Apart from the spatial anisotropy, Na1.5VOPO4F0.5 features an unusually strong interlayer coupling. In Table 7, we list some basic parameters of various FSL compounds with columnar AFM ground state: experimental values of and , thermodynamic energy scale , DFT estimates of , and experimental temperatures of the magnetic ordering (). To account for the single interlayer coupling per lattice site in Na1.5VOPO4F0.5, we take one half of the experimental . The comparison identifies the effects of the frustration and interlayer couplings on . Based on , the compounds can be divided into three groups: strongly frustrated (, ), moderately frustrated (, ), and weakly frustrated (, ) systems. An order of magnitude difference in between Na1.5VOPO4F0.5 and PbZnVO(PO has no appreciable effect on .
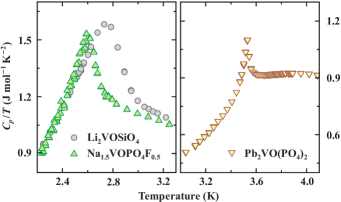
Despite the weak influence on , likely affects other features related to the magnetic ordering. In Fig. 22, we compare specific-heat transition anomalies for Li2VOSiO4, Na1.5VOPO4F0.5, and Pb2VO(PO. The area under the curve is a measure of the transition entropy .not Pb2VO(PO shows the smallest , below 0.01 J mol-1 K-1. A similar frustration ratio of leads to a much larger J mol-1 K-1 in Na1.5VOPO4F0.5, while Li2VOSiO4 reveals an even broader anomaly with J mol-1 K-1. Although numerical estimates of are tentative, the qualitative trend is robust and identifies the strong dependence of on . The reduction in shifts the entropy to the broad maximum above and reduces the transition entropy, which determines the magnitude of the transition anomaly. At weak , the anomaly ultimately transforms into a kink, especially for powder samples, see the data in Refs. Kaul, ; Nath et al., 2008; Tsirlin et al., 2010. A similar trend for the transition entropy depending on has been proposed in a theoretical studySengupta et al. (2003) of a simplified spin model with non-frustrated square lattices coupled by . We mention that the 3D derivative of the FSL model has been addressed in recent theoretical studies focused on ground-state properties.Schmalfuß et al. (2006); *nunes2010; *majumdar2011; *oitmaa2011 Our results call for a further investigation of finite-temperature behavior: in particular, the evaluation of Néel temperature and temperature dependence of the specific heat.
Finally, Na1.5VOPO4F0.5 can be a starting point to explore FSL-type systems with different values of the spin. Experimental work has been mostly restricted to the case of spin-,[Note; however; recentworkoninsulatinganalogsofironarsenides.Forexample:][]fes; *cose although theoretical results propose peculiar features of systems with larger spin.Krüger and Scheidl (2006); *moukouri2006; *bishop2008b; *jiang2009 The family of NaPO4F1.5 fluorophosphatesLe Meins et al. (1999) should retain the basic FSL-type geometry with FM couplings between nearest neighbors and AFM couplings between next-nearest neighbors in the plane. Trivalent cations represent spin-1 (V+3), spin- (Cr+3), and even spin- (Fe+3) so that the effect of the spin value on the FSL model could be explored experimentally.
In summary, we have presented a detailed study of the crystal structure, magnetic behavior, and electronic structure of Na1.5VOPO4F0.5, a spin- FSL-type compound. We observed essential structural changes, including the low-temperature phase separation, that prevent Na1.5VOPO4F0.5 from being a simple model system. A complete experimental evaluation of the spin model for this compound is a formidable challenge. Despite this fact, Na1.5VOPO4F0.5 is the only experimental example of the tetramerized (plaquette-structure) square lattice and bears a relation to a group of spin models which so far lacked any prototype materials. Our experimental data conform to the regular FSL model supplied with a sizable interlayer coupling of about 10 % of the effective intralayer exchange. This interlayer coupling marginally affects the magnetic ordering temperature, yet the transition anomaly in the specific heat is notably increased. In general, Na1.5VOPO4F0.5 and isostructural compounds establish several promising connections to FSL-type spin models. This should outweigh the apparent structural complexity of these materials and stimulate further experimental investigation.
Acknowledgements.
We are grateful to ESRF for providing the beam time at ID31 and specifically acknowledge Andrew Fitch for his efficient support during the data collection. We would also like to thank Yurii Prots, Horst Borrmann, and Roman Shpanchenko for laboratory XRD measurements and Stefan Hoffmann for the DSC study. A.T. was supported by Alexander von Humboldt Foundation. This work was partially supported by the Deutsche Forschungsgemeinschaft (DFG) within the Transregional Collaborative Research Center TRR 80 (Augsburg, Munich). Work at the Ames Laboratory was supported by the Department of Energy-Basic Energy Sciences under contract No. DE-AC02-07CH11358.References
- Misguich and Lhuillier (2004) G. Misguich and C. Lhuillier, in Frustrated spin systems, edited by H. T. Diep (World Scientific, Singapore, 2004) and references therein.
- Shannon et al. (2004) N. Shannon, B. Schmidt, K. Penc, and P. Thalmeier, Eur. Phys. J. B, 38, 599 (2004), cond-mat/0312160.
- Darradi et al. (2008) R. Darradi, O. Derzhko, R. Zinke, J. Schulenburg, S. E. Krüger, and J. Richter, Phys. Rev. B, 78, 214415 (2008), arXiv:0806.3825.
- Isaev et al. (2009) L. Isaev, G. Ortiz, and J. Dukelsky, Phys. Rev. B, 79, 024409 (2009), arXiv:0809.4035.
- Reuther and Wölfle (2010) J. Reuther and P. Wölfle, Phys. Rev. B, 81, 144410 (2010), arXiv:0912.0860.
- Richter and Schulenburg (2010) J. Richter and J. Schulenburg, Eur. Phys. J. B, 73, 117 (2010), arXiv:0909.3723.
- Shannon et al. (2006) N. Shannon, T. Momoi, and P. Sindzingre, Phys. Rev. Lett., 96, 027213 (2006), cond-mat/0512349.
- Richter et al. (2010) J. Richter, R. Darradi, J. Schulenburg, D. J. J. Farnell, and H. Rosner, Phys. Rev. B, 81, 174429 (2010), arXiv:1002.2299.
- Melzi et al. (2000) R. Melzi, P. Carretta, A. Lascialfari, M. Mambrini, M. Troyer, P. Millet, and F. Mila, Phys. Rev. Lett., 85, 1318 (2000), cond-mat/0005273.
- Carretta et al. (2002) P. Carretta, N. Papinutto, C. B. Azzoni, M. C. Mozzati, E. Pavarini, S. Gonthier, and P. Millet, Phys. Rev. B, 66, 094420 (2002a), cond-mat/0205092.
- Kaul et al. (2004) E. Kaul, H. Rosner, N. Shannon, R. Shpanchenko, and C. Geibel, J. Magn. Magn. Mater., 272–276, 922 (2004).
- Tsirlin et al. (2008) A. A. Tsirlin, A. A. Belik, R. V. Shpanchenko, E. V. Antipov, E. Takayama-Muromachi, and H. Rosner, Phys. Rev. B, 77, 092402 (2008), arXiv:0801.1434.
- Oka et al. (2008) K. Oka, I. Yamada, M. Azuma, S. Takeshita, K. H. Satoh, A. Koda, R. Kadono, M. Takano, and Y. Shimakawa, Inorg. Chem., 47, 7355 (2008).
- Rosner et al. (2002) H. Rosner, R. R. P. Singh, W. H. Zheng, J. Oitmaa, S.-L. Drechsler, and W. E. Pickett, Phys. Rev. Lett., 88, 186405 (2002), cond-mat/0110003.
- Tsirlin and Rosner (2009) A. A. Tsirlin and H. Rosner, Phys. Rev. B, 79, 214417 (2009), arXiv:0901.4498.
- (16) E. E. Kaul, Ph.D. thesis, Technical University Dresden, 2005. Electronic version available at: http://hsss.slub-dresden.de/documents/1131439690937-4924/1131439690937-4924.pdf.
- Melzi et al. (2001) R. Melzi, S. Aldrovandi, F. Tedoldi, P. Carretta, P. Millet, and F. Mila, Phys. Rev. B, 64, 024409 (2001), cond-mat/0101066.
- Carretta et al. (2002) P. Carretta, R. Melzi, N. Papinutto, and P. Millet, Phys. Rev. Lett., 88, 047601 (2002b), condmat/0110398.
- Carretta et al. (2009) P. Carretta, M. Filibian, R. Nath, C. Geibel, and P. J. C. King, Phys. Rev. B, 79, 224432 (2009), arXiv:0904.3618.
- Tsirlin et al. (2009) A. A. Tsirlin, B. Schmidt, Y. Skourski, R. Nath, C. Geibel, and H. Rosner, Phys. Rev. B, 80, 132407 (2009), arXiv:0907.0391.
- Bossoni et al. (2011) L. Bossoni, P. Carretta, R. Nath, M. Moscardini, M. Baenitz, and C. Geibel, Phys. Rev. B, 83, 014412 (2011), arXiv:1010.3495.
- Bombardi et al. (2004) A. Bombardi, J. Rodriguez-Carvajal, S. Di Matteo, F. de Bergevin, L. Paolasini, P. Carretta, P. Millet, and R. Caciuffo, Phys. Rev. Lett., 93, 027202 (2004).
- Skoulatos et al. (2009) M. Skoulatos, J. P. Goff, C. Geibel, E. E. Kaul, R. Nath, N. Shannon, B. Schmidt, A. P. Murani, P. P. Deen, M. Enderle, and A. R. Wildes, Europhys. Lett., 88, 57005 (2009), arXiv:0909.0702.
- Nath et al. (2009) R. Nath, Y. Furukawa, F. Borsa, E. E. Kaul, M. Baenitz, C. Geibel, and D. C. Johnston, Phys. Rev. B, 80, 214430 (2009), arXiv:0909.3536.
- Nath et al. (2008) R. Nath, A. A. Tsirlin, H. Rosner, and C. Geibel, Phys. Rev. B, 78, 064422 (2008a), arXiv:0803.3535.
- Tsirlin et al. (2010) A. A. Tsirlin, R. Nath, A. M. Abakumov, R. V. Shpanchenko, C. Geibel, and H. Rosner, Phys. Rev. B, 81, 174424 (2010a), arXiv:0910.2258.
- Massa et al. (2002) W. Massa, O. V. Yakubovich, and O. V. Dimitrova, Solid State Sci., 4, 495 (2002).
- Sauvage et al. (2006) F. Sauvage, E. Quarez, J.-M. Tarascon, and E. Baudrin, Solid State Sci., 8, 1215 (2006).
- Gover et al. (2006) R. K. B. Gover, A. Bryan, P. Burns, and J. Barker, Solid State Ionics, 177, 1495 (2006).
- Petřiček et al. (2006) V. Petřiček, M. Dušek, and L. Palatinus, “Jana2006. The crystallographic computing system,” (2006), Institute of Physics, Praha, Czech Republic.
- Stokes et al. (2006) H. T. Stokes, D. M. Hatch, B. J. Campbell, and D. E. Tanner, J. Appl. Crystallogr., 39, 607 (2006).
- Koepernik and Eschrig (1999) K. Koepernik and H. Eschrig, Phys. Rev. B, 59, 1743 (1999).
- Perdew and Wang (1992) J. P. Perdew and Y. Wang, Phys. Rev. B, 45, 13244 (1992).
- (34) See supplementary information for crystallographic information files, refined XRD patterns, and heat capacity data.
- Aldous et al. (2007) D. Aldous, R. J. Goff, J. P. Attfield, and P. Lightfoot, Inorg. Chem., 46, 1277 (2007).
- (36) Throughout the manuscript, we list occupancies as fractions of the total occupancy for a given position.
- (37) The cell volume for -polymorph slightly deviates from the linear behavior below 270 K. This might be a result of supercooling below the actual temperature of the transition.
- Tsirlin et al. (2010) A. A. Tsirlin, A. M. Abakumov, G. Van Tendeloo, and H. Rosner, Phys. Rev. B, 82, 054107 (2010b), arXiv:1005.4898.
- (39) Owing to the presence of two phases with strongly overlapping reflections, we constrained ADPs for Na, P, and O, respectively.
- Nath et al. (2008) R. Nath, A. A. Tsirlin, E. E. Kaul, M. Baenitz, N. Büttgen, C. Geibel, and H. Rosner, Phys. Rev. B, 78, 024418 (2008b), arXiv:0804.4667.
- Mazurenko et al. (2006) V. V. Mazurenko, F. Mila, and V. I. Anisimov, Phys. Rev. B, 73, 014418 (2006), cond-mat/0509315.
- Rosner et al. (2003) H. Rosner, R. R. P. Singh, W. H. Zheng, J. Oitmaa, and W. E. Pickett, Phys. Rev. B, 67, 014416 (2003).
- Schmidt et al. (2007) B. Schmidt, P. Thalmeier, and N. Shannon, Phys. Rev. B, 76, 125113 (2007), arXiv:0705.3094.
- Sengupta et al. (2003) P. Sengupta, A. W. Sandvik, and R. R. P. Singh, Phys. Rev. B, 68, 094423 (2003), cond-mat/0306046.
- Sengupta et al. (2009) P. Sengupta, C. D. Batista, R. D. McDonald, S. Cox, J. Singleton, L. Huang, T. P. Papageorgiou, O. Ignatchik, T. Herrmannsdörfer, J. L. Manson, J. A. Schlueter, K. A. Funk, and J. Wosnitza, Phys. Rev. B, 79, 060409(R) (2009).
- Abragam and Bleaney (1970) A. Abragam and B. Bleaney, Electron Paramagnetic Resonance of Transition Ions (Clarendon Press, Oxford, 1970).
- Heinrich et al. (2003) M. Heinrich, H.-A. Krug von Nidda, A. Krimmel, A. Loidl, R. M. Eremina, A. D. Ineev, B. I. Kochelaev, A. V. Prokofiev, and W. Assmus, Phys. Rev. B, 67, 224418 (2003).
- Nath et al. (2005) R. Nath, A. V. Mahajan, N. Büttgen, C. Kegler, A. Loidl, and J. Bobroff, Phys. Rev. B, 71, 174436 (2005), cond-mat/0408530.
- Nath et al. (2008) R. Nath, D. Kasinathan, H. Rosner, M. Baenitz, and C. Geibel, Phys. Rev. B, 77, 134451 (2008c), cond-mat/0408530.
- (50) Since , the difference between and contributes to the chemical shift and does not alter the hyperfine coupling , see Eq. (5).
- Moriya (1956) T. Moriya, Prog. Theor. Phys., 16, 23 (1956).
- Carretta et al. (2000) P. Carretta, T. Ciabattoni, A. Cuccoli, E. Mognaschi, A. Rigamonti, V. Tognetti, and P. Verrucchi, Phys. Rev. Lett., 84, 366 (2000), cond-mat/9903450.
- Tsirlin et al. (2011) A. A. Tsirlin, R. Nath, J. Sichelschmidt, Y. Skourski, C. Geibel, and H. Rosner, (2011), arXiv:1101.2546 .
- Tsirlin and Rosner (2011) A. A. Tsirlin and H. Rosner, Phys. Rev. B, 83, 064415 (2011), arXiv:1011.3981.
- Eschrig and Koepernik (2009) H. Eschrig and K. Koepernik, Phys. Rev. B, 80, 104503 (2009), arXiv:0905.4844.
- Kugel and Khomskii (1982) K. I. Kugel and D. I. Khomskii, Sov. Phys. Usp., 25, 231 (1982).
- (57) Similar to other V+4 oxides, the FM contributions arise from the hoppings to and orbitals only. The hoppings to the states are negligible.
- Starykh and Balents (2004) O. A. Starykh and L. Balents, Phys. Rev. Lett., 93, 127202 (2004), cond-mat/0402055.
- Sindzingre (2004) P. Sindzingre, Phys. Rev. B, 69, 094418 (2004), cond-mat/0307118.
- Bishop et al. (2008) R. F. Bishop, P. H. Y. Li, R. Darradi, and J. Richter, J. Phys.: Cond. Matter, 20, 255251 (2008a), arXiv:0705.2201.
- Le Meins et al. (1999) J. M. Le Meins, M. P. Crosnier-Lopez, A. Hemon-Ribaud, and G. Courbion, J. Solid State Chem., 148, 260 (1999).
- Guiton and Davies (2007) B. S. Guiton and P. K. Davies, Nature Mater., 6, 586 (2007).
- García-Martín et al. (2008) S. García-Martín, E. Urones-Garrote, M. C. Knapp, G. King, and P. M. Woodward, J. Amer. Chem. Soc., 130, 15028 (2008).
- Singh et al. (1999) R. R. P. Singh, Z. Weihong, C. J. Hamer, and J. Oitmaa, Phys. Rev. B, 60, 7278 (1999), cond-mat/9904064.
- Kotov et al. (2001) V. N. Kotov, M. E. Zhitomirsky, and O. P. Sushkov, Phys. Rev. B, 63, 064412 (2001), cond-mat/0001282.
- Ueda and Totsuka (2007) H. T. Ueda and K. Totsuka, Phys. Rev. B, 76, 214428 (2007), arXiv:0710.0463.
- Albuquerque et al. (2008) A. F. Albuquerque, M. Troyer, and J. Oitmaa, Phys. Rev. B, 78, 132402 (2008), arXiv:0807.4389.
- Wenzel et al. (2008) S. Wenzel, L. Bogacz, and W. Janke, Phys. Rev. Lett., 101, 127202 (2008), arXiv:0805.2500.
- (69) Experimental estimates of the transition entropy depend on the choice of the background, which is in general ambiguous. To get a rough estimate, we approximated the anomalies in Fig. 22 by triangles.
- Schmalfuß et al. (2006) D. Schmalfuß, R. Darradi, J. Richter, J. Schulenburg, and D. Ihle, Phys. Rev. Lett., 97, 157201 (2006), cond-mat/0604172.
- Nunes et al. (2010) W. A. Nunes, J. R. de Sousa, J. R. Viana, and J. Richter, J. Phys.: Condens. Matter, 22, 146004 (2010).
- Majumdar (2011) K. Majumdar, J. Phys.: Condens. Matter, 23, 046001 (2011), arXiv:1011.0381.
- Rojas et al. (2011) O. Rojas, C. J. Hamer, and J. Oitmaa, (2011), arXiv:1103.1679 .
- (74) Specific heat data for the powder sample of Pb2VO(PO (Ref. Kaul, ) show a weak kink instead of the anomaly, hence an estimate of the transition entropy is basically impossible.
- Zhu et al. (2010) J.-X. Zhu, R. Yu, H. Wang, L. L. Zhao, M. D. Jones, J. Dai, E. Abrahams, E. Morosan, M. Fang, and Q. Si, Phys. Rev. Lett., 104, 216405 (2010), arXiv:0912.4741.
- Fuwa et al. (2010) Y. Fuwa, T. Endo, M. Wakeshima, Y. Hinatsu, and K. Ohoyama, J. Amer. Chem. Soc., 132, 18020 (2010).
- Krüger and Scheidl (2006) F. Krüger and S. Scheidl, Europhys. Lett., 74, 896 (2006), cond-mat/0601231.
- Moukouri (2006) S. Moukouri, Phys. Lett. A, 352, 256 (2006), cond-mat/0510288.
- Bishop et al. (2008) R. F. Bishop, P. H. Y. Li, R. Darradi, and J. Richter, Europhys. Lett., 83, 47004 (2008b), arXiv:0802.2566.
- Jiang et al. (2009) H. C. Jiang, F. Krüger, J. E. Moore, D. N. Sheng, J. Zaanen, and Z. Y. Weng, Phys. Rev. B, 79, 174409 (2009), arXiv:0901.3141.
Supplementary material