Robustness of Complex Networks against Attacks Guided by Damage
Abstract
Extensive researches have been dedicated to investigating the performance of real networks and synthetic networks against random failures or intentional attack guided by degree (degree attack). Degree is one of straightforward measures to characterize the vitality of a vertex in maintaining the integrity of the network but not the only one. Damage, the decrease of the largest component size that was caused by the removal of a vertex, intuitively is a more destructive guide for intentional attack on networks since the network functionality is usually measured by the largest component size. However, it is surprising to find that little is known about behaviors of real networks or synthetic networks against intentional attack guided by damage (damage attack), in which adversaries always choose the vertex with the largest damage to attack.
In this article, we dedicate our efforts to understanding damage attack and behaviors of real networks as well as synthetic networks against this attack. To this end, existing attacking models, statistical properties of damage in complex networks are first revisited. Then, we present the empirical analysis results about behaviors of complex networks against damage attack with the comparisons to degree attack. It is surprising to find a cross-point for diverse networks before which damage attack is more destructive than degree attack. Further investigation shows that the existence of cross-point can be attributed to the fact that: degree attack tends produce networks with more heterogenous damage distribution than damage attack. Results in this article strongly suggest that damage attack is one of most destructive attacks and deserves our research efforts. Our understandings about damage attack may also shed light on efficient solutions to protect real networks against damage attack.
pacs:
89.75.Fb, 89.75.Hc, 89.65.-sI Introduction
In the last decade, great efforts have been dedicated to the research on the resilience of real-world networks or synthetic networks against random failures or intentional attacks Cohen et al. (2000, 2001); Paul et al. (2004); Tanizawa et al. (2005, 2006); Holme et al. (2002); R. Albert and Barab si (2000); Karrer et al. (2008a); Moreira et al. (2009); Paolo Crucitti and Rapisarda (2004); Herrmann et al. (2010); Buldyrev et al. (2010); Xiao et al. (2008); Wu et al. (2007). Random failure can be considered as a special case of intentional attack when no information of vertex importance in the sense of maintaining the integrity of the network is available to an adversary. If certain structural information of the network is available, a rational adversary generally tends to select the most important vertex to attack so that the destructive effect can be maximized. Usually, the attack will continue step by step until the adversary believes that the desired destructive objective is achieved.
Thus, from an adversary’s perspective, ranking the importance of vertex in the network is one of the fundamental steps towards destructing the network. A real network can be precisely modeled as a graph , where represents the entities in the network and represents relations among these entities. A variety of measures are available to rank the vertex importance in a graph. Among them, degree and betweenness, have been widely investigated in previous researches about network robustness Paolo Crucitti and Rapisarda (2004); Holme et al. (2002). Degree quantifies the number of connections to a vertex. Vertices with large degrees dominate the connections of the whole network, thus are naturally regarded as the most important vertex in maintaining the integrity of the network. Betweenness counts the fraction of shortest paths going through a given vertex. Hence, vertex with high betweenness is important in maintaining the communication functionality of the network Karrer et al. (2008b); Newman and Girvan (2004); Newman (2004).
In general, vertex importance can be measured from different perspectives. However, except degree and betweenness, many of others have been rarely investigated in the research about network robustness. One of them is damage, which characterizes the damage caused by the removal of a vertex and usually is quantified as the decrease of the largest component size when the vertex and its incident edges are removed. Intuitively, a vertex causing large damage leads to more destructive effect on the network performance. Damage plays a vital role in characterizing the essentiality of components in biological networks. Vertices (proteins or enzymes) that cause large damage are essential or important in protein interaction networks or metabolic networks Lemke et al. (2004); Schmith et al. (2005).
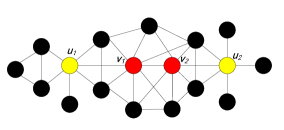
By definition, attacking the target node with the maximal damage causes the most significant damage on the given network than any other attack if destructive effect is measured by damage. We use a hypothetical graph shown in Figure 1 to illustrate the destructive effect caused by attacking vertex of highest damage. In this graph, vertex has damage value 4. The removal of will isolate four vertex from the major component of the network. However, if we remove the vertex with the largest degree, i.e., vertex , no vertex except itself will be isolated from the major component. This example clearly shows that attack guided by damage or simply damage attack (that is always attacking the vertex with highest damage) yields non-trivial destructive effect.
Despite of its destructive effect caused by damage attack, the fundamental characteristics of damage attack and the response of real networks as well as synthetic networks to damage attack has been rarely studied so far. In this article, we systematically investigate damage attack and the performance of real networks and synthetic networks including Barabaśi-Albert (BA) Barabasi and Albert (1999) networks and Erdös-Rény (ER) Erdős and Rényi (1959) networks against damage attack. Across the study, attack guided by degree is also investigated as a comparison.
The structure of the remainder of this article is as follows: we first review existing attacking model aiming at unifying existing attack models in Section II. Then, in Section III, we systematically investigate statistical properties about damage, damage distribution, correlation between damage and degree. In Section IV, we present the empirical analysis results about the behaviors of real networks and synthetic networks against damage attack with the comparison to degree attack, finding that there exists a cross-point before which damage attack is more destructive than degree attack. Such findings are further explained in Section V. Finally, in Section VI, we briefly summarize major findings and results that we get in this article.
II Attacking Models
A variety of intentional attacking models have been implicitly studied in previous researches. Despite of their distinctive features, they share the same framework to describe themselves. In general, we need to specify the ranking mechanisms of vertex importance and performance measure of networks to clarify an attacking model. In this section, we will first present a unified attacking model by synthesizing existing models, and then give a brief overview of vertex importance ranking and network functionality measures.
II.1 Unified attacking model
An attacking strategy describes the way that an adversary issues attacks on the network. In this paper, we are particularly interested in intentional attack, since intentional attack is more destructive than random attack or random failures R. Albert and Barab si (2000); Cohen et al. (2001); Paul et al. (2004); Tanizawa et al. (2005). In an intentional attack, an adversary preferentially attacks the vertex that he believes is important for maintaining integrity of the network to maximize the destructive effect. In contrast, in a random attack or random failure, adversaries choose the attack target by purely random guess or each vertex or edge fails with equal probability.
Among intentional attacks, we only consider vertex attack, that is, attacking a network by removing a vertex as well as its incident edges from the network. Some conclusions can be directly extended to edge attack, i.e., just removing an edge. It’s reasonable to assume that the objective of an adversary to attack a network is to maximize the destructive effect by attacking fixed number of vertices. For this purpose, an adversary first need to assess the ’benefits’ by attacking an vertex. This problem is equivalent to evaluate the importance of a vertex for maintaining the integrity of the network. Hence, ranking mechanisms of vertex importance becomes a core of devising an attacking strategy. In general, different adversaries will rank the vertex importance from different aspects, producing disparate destructive effects. For example, the vertex importance can be measured by degree, betweenness, damage or many others.
Suppose the adversaries are empowered with the ability to identify the most important vertex, he generally will follow a greedy framework to maximize the destructive effect, that is always attacking the most important vertex of the remaining network at each step until he believes that the desired destructive effect is achieved. This is the framework of attack model that will be investigated in this paper.
Note that in above attacking model, we make two strong assumptions. The first is that adversaries can always select the most important vertex. The second is that adversaries have the ability to issue continuous attacks. Such strongest assumptions are quite meaningful since protection solution based on the understanding of the network robustness behavior against the worst attack comes with safety guarantee. In many real cases, adversaries can hardly select the most important vertex since only local information about the network is available to adversaries Holme (2004). On the hand, adversaries usually have limited resources to issue continuous attack. Hence, in real cases the networks preform better than we expected under the strongest assumption.
Another key element of an attacking model is the quantification of network performance or functionality. The characterization of the robustness of networks is determined by performance measures. For example, the robustness of network can be investigated by observing the change of the largest component size () of the network when the network is subject to continuous attacks R. Albert and Barab si (2000); Holme et al. (2007). Fast decrease of provides strong evidence for the vulnerability of the network. The network performance can also be measured from other aspects, e.g., the communication functionality, which are usually measured by the average shortest path length or network diameter. In general, when measured from different aspects, a network usually exhibits diverse robustness behaviors.
Hence, generally, an attacking model can be described by a triple F, where is the functionality measure, captures the most important vertex as the attacking target and is an indicator function that indicates whether the attacking objective is achieved. Let be the remaining network after steps of attack, then the attacking procedure specified by generally can be described as follows: At each attacking step, as well as its incident edges are removed from . Repeat the attack until satisfies the assertion specified by .
In most previous researches, when is the largest component size of a network, is assumed to be , or . In cases where is clear in the context, we usually represent an attacking model by . Note that, in the proposed attacking model, is always calculated from instead of , which means we always recalculate the vertex importance and select one of the most important from the network after attack instead of the original network. The rationality lies in the fact that most measures of vertex are sensitive to vertex removal. However, when attack is guided by degree, removing vertex with the highest degree has limited influence on the degree rank of remaining vertex. Hence, we can use the degree rank of the original network to approximate that of the network after attack.
Under the attack specified by , the robustness of a network , denoted by , can be explicitly defined as:
| (1) |
, which is the ratio of network performance decrease to the number of removed vertex. From the viewpoint of adversaries, it characterizes the efficiency of an attack strategy.
II.2 Measures of network functionality
In the study of network robustness, a typical measure of network functionality is the size of its largest connected component (LCC) R. Albert and Barab si (2000), i.e., . In general, removing a vertex from a connected network will detach some connected subgraphs or isolated vertex from the largest component of the network. Hence, will decrease after deleting a vertex. Then, the vulnerability or robustness of a network can be evaluated by the change of . More larger the change of is, more vulnerable the network is. When we investigate damage attack, we will use as the major measure for network functionality.
Another class of network functionality measures is based on the shortest path information of the network. Shortest paths have been shown to be crucial for the communication of a variety of real networks. Thus, preserving the key statistics of shortest pathes, will be an important indicator of resilience of the network against vertex attack. One statistic over shortest paths in a network is the average shortest path length, which is usually defined as:
| (2) |
, where is the length of the shortest path from vertex to . In a disconnected network, will be infinite for two disconnected vertices and . To overcome this problem, one can instead use the average inverse geodesic length, which is
| (3) |
When attacking a network by removing vertices, the network will eventually break into disconnected subgraphs. Hence, as given in Equation 3 is also widely used to measure network functionality. When performing continuous attack on a network, will decrease with the increase of the number of removed vertex. Fast decrease of strongly suggests that the network is vulnerable.
II.3 Ranking of vertex importance
A variety of vertex importance measures have been proposed, among them, degree and betweenness are two most widely used measures. Intuitively, vertices with high degree, i.e. hub vertices, contribute significantly to the interconnectedness of the whole network, thus is important with respect to maintaining the integrity of the network. Vertex betweenness measures the number of shortest paths passing through a vertex. Vertices with high betweenness are believed to be crucial for information/material transferring in many real networks such as internet, power grid, where information or signals travels from sources to destinations by shortest paths to save the transfer cost. The vertex betweenness of a vertex can be formally defined as follows:
| (4) |
, where is the number of shortest paths between and and is the number of shortest paths in that pass through .
One important issue about vertex ranking is its sensitivity to the vertex removal operation. Clearly, ranking by degree is less sensitive than ranking by betweenness to vertex removals. Such a fact implies that recalculation on destructed networks is necessary for betweeness-based ranking. In contrast, degree ranking in the original network is quite close to that obtained by recalculating on destructed networks. In general, adversaries need to pay extra recalculation cost to perform attacks guided by vertex ranking mechanisms that are sensitive to vertex removals.
Computation cost is another critical concern when adversaries attack a network consisting of millions of vertex. Degree can be retrieved by constant time when the graph is built in memory. The fast algorithm to compute betweenness for all nodes requires time for unweighted networks Brandes (2001), where are the vertex number and edge number, respectively. However, degrees of all vertex can be counted in time. Hence, considering computation cost, degree is preferred to betweenness by adversaries. However, for small networks or medium-sized networks of tens of thousands of vertices, both degree and betweenness can be obtained by adversaries, which poses a great challenge for us to protect real network systems.
III Damage of networks
If the network functionality is measured by , then to maximize the destructive effect, a straightforward greedy approach is to remove vertices one by one in the descending order of their damage value. In this section, we will systematically revisit vertex damage for real networks and synthetic networks.
III.1 Damage of graphs
Let be an undirected graph (not necessarily a connected graph). The damage of a vertex , is defined as , where and are the largest connected component size before removing and after removing , respectively. For a vertex in a connected graph, its damage lies in the range 222Note that when the graph is not connected, the minimal value of may be 0 when does not lies in the largest cluster of the network. is 1 when the induced subgraph of is a connected component. when is the central vertex of a star-like network (that is the graph with vertex of degree 1 being connected to a central vertex of degree ). If the degree of , , is given, a tighter upper bound of can be given by:
| (5) |
The upper bound is reachable when connects to clusters that have the same size and disconnect to each other.
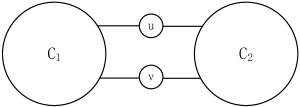
Damage of vertices is sensitive to vertex deletion operation. For example, damages of in the hypothetical graph shown in Figure 2 are both 0. However, once one of is removed from the graph, the damage of the other vertex will drastically increase approximately to . Hence, it is reasonable to assume that adversaries tend to recalculate damage to maximize destructive effect.
Let’s have a closer look at vertex of different damage values. In a connected graph, a vertex has a damage value larger than 1 if and only if it is a cut of the graph, which is a vertex whose removal will increase the number of connected components. The vulnerability of a network to vertex removal can be attributed to the existence of these cuts. Vertex of damage 1 are those vertex such that the induced subgraph of is connected. The removal of anyone of these vertex will only isolate itself from the largest component. Among one-damage vertex, some of them are vertex of degree 1. Others in one-damage vertex may have diverse degrees. Since removing an one-damage vertex causes no extra damage to the network, these vertex all also called vertex of trivial damage in following texts.
Concepts of damage is closely related to connectivity of graphs. Given a connected graph , its vertex-connectivity, denoted is the minimal number of vertices whose removal will disconnect or reduce it to a 1-vertex graph. A graph is if it is connected and the . Thus, any graph with will not contain vertex with damage larger than 1. In other words, we can only find vertex of damage larger than 1 from networks.
III.2 Damage in synthetic networks
In this subsection, we will investigate vertex damage in typical synthetic networks. One is BA networks, accounting for a typical class of networks with scale-free degree distribution. The second is ER networks, a typical network model producing exponential degree distribution. Finally, trees and tree-like networks will also be investigated.
The connectivity of BA networks depends on the connectivity of it’s seed network and the number of vertex () that at each step a newly added vertex connect to. Note that when , each step of BA network generation is a path addition to the existing network, i.e., adding a path with internal vertex disjoint with the existing vertex to the network. Due to Whitney Synthesis Theorem Whitney (1932), the resulting network obtained by repeatedly performing path addition on a network is still . Furthermore, a network is still if it is obtained by adding edges to a network. Hence, for BA models, if the seed network is and , the resulting network is . The direct consequence of this fact is that the BA networks generated as above will not contain vertex of non-trivial damage value.
An ER random network is generated on vertices by linking each pair of vertex with identical probability . The ER networks generated under parameters and are usually denoted by . Random graph theory has shown us that for , almost every graph is k-connected Gross and Yellen (2005). A graph property is said to hold for ’almost every graph’ if the probability that a random graph has property has the limit 1 as . Thus, it’s hard to find vertices with non-trivial damage from a large ER random graph. However, when is small and the network is not very large, the probability that the network is not is significant.
Let be any two vertices in a graph in , then other vertex can be partitioned into -subsets (a subset of vertex), with perhaps a fewer vertices left over. Let be a -subset. Then, the probability that every vertex of is adjacent to and (i.e., is fully-adjacent to ) is . Hence, the probability that none of these -subsets is fully-adjacent to is
| (6) |
Note that, essentially is the probability that for any pair of vertex , there exist internally-disjoint paths of length 2 to connect . A graph is -connected if and only if for each pair of vertex there exist at least internally disjoint paths (a path with as ends) in Gross and Yellen (2005). Hence, is a low bound of the probability that a graph is .
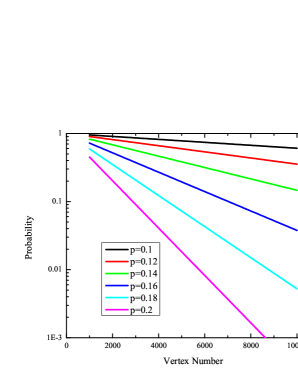
Thus, is an upper bound of the probability that a graph is not -connected. If , . The simulation of with as the function of network size and is shown in Figure 3. The simulation results show that in ER network with small size and small , it’s still quite possible to find vertex with nontrivial damage values. For example, when and , is , which is significant and can not be ignored.
As connected acyclic graphs, trees are and vertex with degrees larger than 1 have nontrivial damage values. The damage distribution of a tree is determined by it’s structure. One extreme case of tree is path (as shown in Figure 4(a)), where only two ends have degree 1 and all other vertex have degree 2. A path structure has a quite heterogenous damage distribution, where for each damage value in there exists two vertices (when is odd, only one vertex has damage ). The tree that has the most homogenous damage distribution is a star, as shown in Figure 4(b), where the vertex of largest degree has a extremely large damage value, that is , and all other vertex have damage 1.


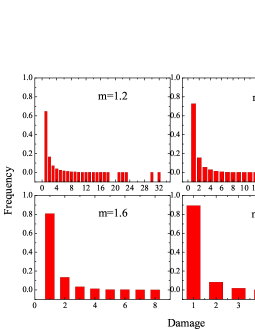
In general, cycles may exist in real-world networks. Hence, it’s hard to find real-world networks taking exactly the form of tree. However, the structure of a real-world network can be considered as the union of one of its spanning tree and corresponding additional edges. In this sense, many networks can be considered as tree-like structure. In general, if the structure of a network is closer to tree, it’s of higher probability to find more vertex with high damage value. To show this, we give the damage distribution of four synthetic BA networks with varying from 1.0 to 1.8 in Figure 5. Note that in the generic BA network model, is an integer. To produce treelike BA networks, we adjust the model to handle cases where is a decimal in following ways: each time when a new vertex arrives, we link it to existing vertex with probability and link it to existing vertex with probability . When , the network is a BA scale-free tree. When becomes larger, the network structure is farther away from the tree structure. It is obvious from Figure 5 that when the network structure is close to tree, long tail can be observed, indicating that many vertex of large damage exist in the network.
III.3 Damage of real networks
In following texts, we will perform empirical analysis on two real networks. One is airline transportation network of United States of year 1997 (denoted by USAir) with vertex representing the airports of United States and edges representing the airlines. There are overall 332 airports and 2126 airlines. The other one is protein-protein interaction network of yeast (denoted by Yeast) with vertex representing proteins of yeast and edges representing the interaction of proteins. Yeast has 2361 proteins and 7182 interactions. The behaviors of these two networks under attack are critical for the functionalities of these networks. The two network data and their detailed descriptions are now available at http://vlado.fmf.uni-lj.si/pub/networks/data/.
As shown in Table 1, the airport with the largest degree in USAir is Chicago O’hare Intl, which has 131 airlines connecting to other airports covering airports of US. However, its damage value is only 3, which means that Chicago O’hare Intl is essential for only three airports to connect to other airports. The airport with the largest damage in USAir is Anchorage Intl, whose damage is 27 implying that 26 airports rely on Anchorage Intl as the transferring airport and Anchorage Intl is their unique choice to connect to other airports. In other words, if Anchorage Intl malfunctions, these 26 airports will be isolated from the outside world if only air transportation is considered. However, it is surprising to find that Anchorage Intl’s degree is 29 and corresponding degree rank is only 41. Above analysis clearly shows that the essentiality of an airport can be characterized by its damage instead of degree.
The top ten airports with the largest degree are shown in Table 2. Comparing it to Table 1, we find that only five airports simultaneously occur in the two ranking lists. It is interesting to find that some airports that are highly connected, such as Chicago O’hare Intl, The William B Hartsfield Atlan, have relatively small damage values. In contrast, some airports with large damages, such as Anchorage Intl, Bethel, Honolulu Intl, Guam Intll, Phoenix Sky Harbor Intl, have quite small degrees. For example, Guam Intll only connects to 4 airports but has damage 5, which implies that 4 airports completely rely on Guam Intll to connect to the outside world. Consequently, despite of its small degree, Guam Intll becomes the local center of air transportation.
Among all the airports, Dallas/Fort Worth Intl not only has a large degree but also has a significant damage. Hence, Dallas/Fort Worth Intl is not only a popular transferring airports, but also a local center responsible for the connection of its local airports to the outside world. Above facts together inspire us that damage has its own right in characterizing the importance of a vertex from the perspective to maintain the connections of a vertex’s neighborhood to the outside world of the network.
| Rank | Degree | Damage | Vertex Name |
|---|---|---|---|
| 1 | 139 | 3 | Chicago O’hare Intl |
| 2 | 118 | 15 | Dallas/Fort Worth Intl |
| 3 | 101 | 3 | The William B Hartsfield Atlan |
| 4 | 94 | 7 | Pittsburgh Intll |
| 5 | 94 | 6 | Lambert-St Louis Intl |
| 6 | 87 | 3 | Charlotte/Douglas Intl |
| 7 | 85 | 2 | Stapleton Intl |
| 8 | 78 | 4 | Minneapolis-St Paul Intl/Wold- |
| 9 | 70 | 1 | Detroit Metropolitan Wayne Cou |
| 10 | 68 | 7 | San Francisco Intl |
| Rank | Degree | Damage | Vertex Name |
|---|---|---|---|
| 1 | 29 | 27 | Anchorage Intl |
| 2 | 118 | 15 | Dallas/Fort Worth Intl |
| 3 | 14 | 12 | Bethel |
| 4 | 94 | 7 | Pittsburgh Intll |
| 5 | 68 | 7 | San Francisco Intl |
| 6 | 24 | 7 | Honolulu Intl |
| 7 | 94 | 6 | Lambert-St Louis Intl |
| 8 | 4 | 5 | Guam Intll |
| 9 | 78 | 4 | Minneapolis-St Paul Intl/Wold- |
| 10 | 60 | 4 | Phoenix Sky Harbor Intl |
III.4 Correlation between damage and degree
Degree is the one of the most widely used measures to characterize the importance of vertex. Whether degree and damage has certain correlation, for example high degree leading to high damage, is an intriguing problem. To address issue, we will first study the correlation between damage and degree for the two real networks analyzed in previous sections. Then, we propose a network generation model to produce networks with arbitrary degree-damage correlation.
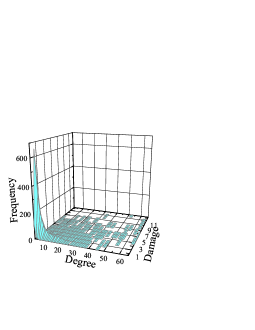
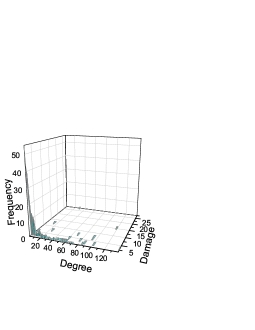
The distributions of damage and degree for Yeast and USAir are shown in Figure 6. It is visually apparent that the majority of vertex tend to have small degrees and small damages. However, in general, vertex of small degrees do not necessarily have small damages. Many vertex of small degrees but having larger damage exist in Yeast, implying that the removal of vertex with small degree may also have non-ignored influences on the integrity of Yeast.
More generally, there exists no essential correlations between damage and degree for an arbitrary network, which is verified by a network generation model that can be tuned to produce networks with desired correlations between degree and damage. The independence of damage on degree strongly suggest that damage is a novel perspective that can not replaced by degree to characterize the property of vertex.
The network generation model is as follows: Suppose that we need to generate a network with vertex. We first partition vertex set into two subsets , with and vertices, respectively, such that . Then, we generate a graph (denoted by ) with vertex set such that any vertex in has damage 1. This objective can be achieved if is and . BA network generator that uses a complete subgraph as the seed network and at each step a newly added vertex is attached to existing vertices can help us generate a .
In the second step, for each vertex in , we will attach it to a vertex of degree by probability
| (7) |
, where is degree of in and is a function of . In the resulting graph, any vertex in has degree and damage , while each vertex of has degree 1 and damage 1. Consequently, we can generate a network stratifying desired correlation between damage and degree by tuning . As an example, we can generate graphs such that its correlation between degree and damage is (1)Positive, (2)Negative, (3)Independent by specifying as:
-
1.
;
-
2.
;
-
3.
, where is a large prime
, respectively. The correlation plots of networks generated by above parameters are shown in FIG 7. The figure shows that the network model can generate networks with different correlations between degree and damage.

IV Damage attack
Now, we are ready to give the detailed procedure of damage attack: An informed agent always attempts to deliberately attack a vertex with the maximal damage value in the current network. After the malfunctioning of the target vertex, simulated by the removal of the vertex, the agent recalculates the damage value of each vertex in the network. The attack continues until the destructive objective is achieved. To comprehensively understand the vulnerability of network under intentional attacks, it is reasonable to assume that the attack will stop until the network completely falls apart, i.e., the largest connected component of the network contains only one isolated vertex. Compared to degree attack, there are two distinctive features in damage attack. First, vertex importance is measured by damage rather than degree. Second, recalculation is indispensable due to the sensitivity of damage value to vertex removal.
IV.1 Damage attack on real networks
We first show the destructive effect of damage attack on a small hypothetical network with the comparison to degree attack. For the graph shown in Figure 1, when the vertex with the largest damage, i.e., , is removed, will fast decrease from 18 to 13. Compared to damage attack, if the vertex with the largest degree, i.e., , is removed, other vertex remain connected. When the damage attack continues, will be removed, which will produce a network with only 9 vertex (half of the original size). However, under degree attack, the target after the removal of is , whose removal has no effect on the connectedness of the remaining 16 vertex.
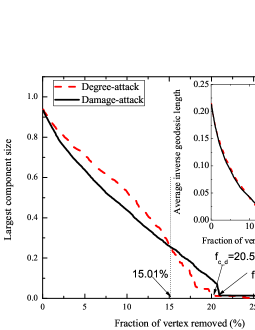
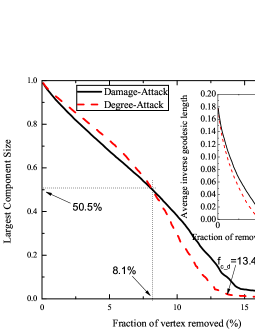
Above example shows that damage attack is more destructive than degree attack, which is valid at least at the early stage of the attack. Then, we may wonder whether the superiority of damage attack is consistent across the whole attacking process until the network completely falls apart. To answer this question, we simulate the intentional attack guided by damage and degree, respectively, on two real networks used in previous sections. The result is shown in Figure 8. It is visually apparent from the plots that for both the two real networks the destruction (measured by the decrease of and average inverse geodesic length ) caused by damage attack is more significant than that caused by degree attack until a cross-point is reached. Such facts sufficiently show that damage attack is more destructive than degree attack before the cross-point.
Specifically, for Yeast, before the fraction of vertex removed reaches to the cross-point 15.01%, under damage attack is always smaller than that under degree attack. However, after 15.01% degree attack shows more efficiency than damage attack until the network completely collapses. It is approximately at (under degree attack ) and (under damage attack) that the network completely falls apart. If complete destruction is the attacking objective, degree attack shows minor superiority to damage attack, since is a little larger than .
Note that at the cross-point , is less than of the original size, which implies that at the cross-point Yeast generally has already lost most of its functionalities. Before the cross-point, when fraction of removed vertex reaches to approximately , maximal extra destruction caused by damage attack compared to degree attack is reached, which is about of original network size. The extra damage is significant enough, since in many real networks, the network almost lost its function when removing vertex. In Yeast, superiority of damage attack dominates the whole attacking process since at the cross-point, 3/4 attacking process has finished. All these facts together suggest that destruction caused by damage attack is more significant and can not be ignored in real applications. The fragility of Yeast under damage attack also provides additional evidence for the notion that damage characterizes the essentiality of proteins in PPI networks Schmith et al. (2005).
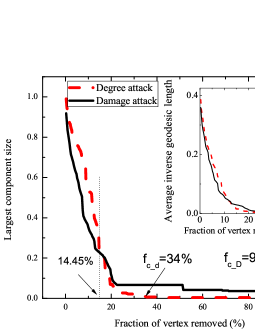
Similar phenomenon can be observed from USAir network. The results are shown in Figure 8(b). Before the cross-point , damage attack is more destructive than degree attack. This result is consistent when the network performance is measured by average geodesic length, as shown in the inset of Fig. 8(b). When cross-point is reached, is only about of the original size, suggesting that network has been fragmented into pieces. It is surprising to find that the maximal extra destruction of damage attack is , which is obtained when fraction of removed vertex reaches to . These facts strongly suggest that USAir network exhibits more fragility under damage attack than under degree attack. Note that in USAir , approximately to be , is quite large compared to . However, these indicators are meaningless since after the cross-point the attack is performed on a network with disconnected pieces (note that after cross-point is less than of the original network size).
IV.2 Damage attack on synthetic networks
Next, we will show that previous observations on real networks are consistent on synthetic networks including ER networks and BA scale-free networks. Most of real networks can be reproduced by these two synthetic network models under suitable parameters. In this subsection, we generated an ensemble of BA and ER networks (10 realizations, respectively) with the same parameters, so that each performance quantity can be evaluated as the average of 10 realizations.
The result on BA network is shown in Fig. 9(a). Existence of a cross-point (8.1%) of damage-attack curve and degree-attack curve is obvious from the figure. Damage attack still exhibits more destructive effect on BA networks than degree attack before the cross-point. It is about at that the maximal extra destruction caused by damage () can be reached before the cross-point. After the cross-point, under degree attack drops faster than that under damage attack, yielding a small () and relatively large (). However, when using as the measure of network performance, it seems that degree attack is more destructive than degree attack along the entire attacking process (as shown in the inset of Fig. 9(a)).
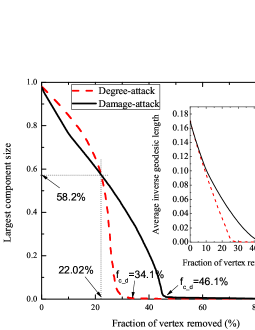
Similar results can be observed from ER networks, with following distinctive observations. First, for ER networks, the cross-point () and the critical points when the network completely falls apart ( and ) under two attacks are significantly larger than corresponding counterparts of BA network. Such facts suggest that ER networks are more robust against intentional attacks including degree attack and damage attack. In general, the integrity of ER network is maintained by a majority of vertex with average degree. In contrast, the integrity of BA network heavily relies on the minority of vertex with largest degrees. Hence, when adversaries deliberately attack the vertex with the largest degree or damage in the network, BA network is more fragile than ER networks.
Comparing the results on real networks and synthetic networks, we find that damage attack seems to be more effective on real networks than on synthetic networks. At the cross-point the destructive effects on real networks are more significant than that on synthetic networks (both ER network and BA network). For real networks, at the cross-point lies in the range ; whereas for synthetic networks, varies from to . In reality, when only 20% 30% vertex remain in the largest connected component, the function of the whole system is reasonably to be regarded as collapsed. Hence, damage attack is really effective to destruct real networks.
IV.3 Summary
Comparatively empirical studies of damage attacks and degree attacks on both real networks and synthetic networks strongly suggest that:
-
1.
Real networks and typical synthetic networks are quite vulnerable to damage attack;
-
2.
The existence of a cross-point is a universe phenomenon shared across a variety of diverse networks, when comparing degree attack and damage attack with network functionality being measured by ;
-
3.
Damage attack is more destructive than degree attack before the cross-point, at which a network generally has already lost most of its functionalities.
All these findings together show that damage attack poses a great challenge for us to protect complex networks, hence deserving our research efforts.
V Analysis
Findings in the previous sections are not self-evident. In this section, we will explore the reasonable explanations for above results.
Note that, after the cross-point of degree attack and damage attack, the decrease of under degree attack is faster than that under damage attack. For example, for BA networks, under degree attack, 50.5% decrease of is caused by the removal of 13.4%-8.1%=5.3% vertex, while under damage attack the same destruction is caused by the removal of 17.6%-8.1%=9.5% vertex. Such facts imply that the integrity of the remaining network under degree attack at the cross-point is maintained by only a minority of vertex, whose removal will cause fast collapse of the network. Then, it’s reasonable to expect that the network at the cross-point under degree attack is more sensitive to the removal of some key vertex than that under damage attack.
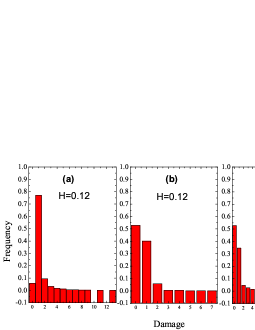
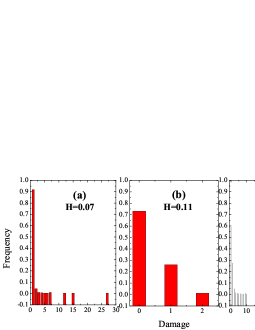
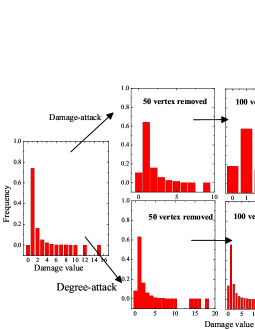
The sensitivity to vertex removals can be observed from the damage distributions of the remaining networks. Let be the networks at the cross point under degree attack and damage attack, respectively. We summarize the damage distributions of for Yeast and USAir in Figure 10. As comparisons, the original damage distributions are also given. Let , and be the damage distribution of the original network, and , respectively. From Figure 10, we can see that for both two real networks is more right-skewed than while is less right-skewed than , suggesting that is more homogenous than and is more heterogenous than . Consequently, is more sensitive to degree attack than to damage attack.
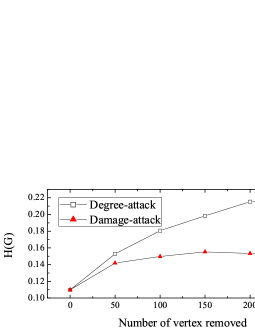
To give quantitative support, we use entropy to measure the heterogeneity of a damage distribution. The entropy is defined as:
| (8) |
, where is the probability that a vertex has damage . The larger is the more heterogeneous the distribution is. The entropy values are also given in Figure 10, which confirm that damage distribution of is more heterogeneous than .
Now let’s have a closer look at the damage distributions at the cross-point. For USAir, two airports ’Fort Lauderdale/Hollywood Intl’ and ’General Mitchell Intll’ have damage value as 47, 49, respectively, in . Note that the damage caused by these vertex are significant, since the airports isolated from the largest cluster of is approximately of all airports. Hence, the integrity of heavily relies on the existence of these two airports. However, it is surprising to find that both of these two airports have only damage as 1 and degree as 34 in the original network. This fact suggests that those vertex of less importance (whatever quantified by degree or damage) in the original network may become the most important vertex in the remaining networks after a number of steps of attacks guided by degrees. Hence, one of the most important characteristics of degree attack is the emergence of potential important vertex. However, for damage attack, the case is just the reverse: as the attack continues, more vertex tend to have similar damage values, and consequently damage attack gradually degrades into random attack.
To provide more quantitative evidences, we further investigate the evolution of damage distribution under degree attack and damage attack. We capture six snapshots of the intermediate results under degree attack and damage attack from a BA network (similar results can be obtained from real networks tested in above sections and ER networks). The result is shown in Figure 11(b), which clearly shows that across the whole attacking process the damage distribution under degree attack is consistently more heterogenous than that under damage attack. It seems that under damage attack, damage distribution converges to a constant level. To have a direct feeling about the heterogeneity, the damage distributions of three snapshots in Figure 11(b) are also given in Figure 11(a), which are consistent with the above results.
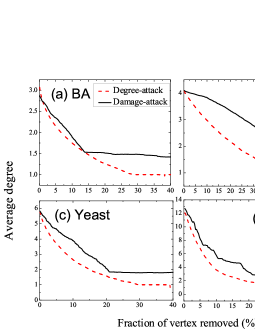
Now, it’s ready to explain why degree attack produces networks with more heterogenous damage distribution than damage attack. Note that, under degree attack, more edges will be removed from the network compared to damage attack when the same number of vertex are removed. The consequence of this is the sparsity of the resulting network. Compared to degree attack, damage attack seems to be more destructive at the early attacking stage since more vertices are isolated from the largest cluster, however the number of edges isolated from the largest cluster generally is less than degree attack. Consequently, when it comes to a critical point where the accumulative effect of degree attack becomes significant, the integrity of the network will collapse avalanchely.
To verify above conjectures, we summarize the average degrees (the ratio of edge number to vertex number) for intermediate networks 333Note that the intermediate network may contain disconnected components. Hence, the average degree is summarized from the entire intermediate network instead of its largest connected component. under degree attack and damage attack. The results of two synthetic networks and two real networks are shown in Figure 12. For all tested networks, under degree attack, the average degree of an intermediate network is consistently smaller than that under damage attack, indicating that degree attack is more destructive in removing edges from a network.
VI Conclusions
In this paper, we first review existing attacking models with the objective to unify existing models. Then, we systematically investigate damage and its distributions in two typical real networks (USAir and PPI of Yeast) and typical synthetic networks including BA networks, ER networks and tree-like networks. We show that BA network generated from a 2-connected seed network with is also a 2-connected network. We also show that vertex of higher damage tend to exist in a tree-like network. Statistics about damages in two networks show that damage has its own right in characterizing the importance of a vertex in maintaining the connection of its neighborhood to the outside world of the network, which further suggests that as a measure of vertex, damage can not be trivially replaced by degree or other measures.
We empirically analyze the behaviors of complex networks against damage attack with the comparisons to degree attack. Our major finding include: There exists a cross-point of degree attack and damage attack before which damage attack is more destructive than degree attack for a variety of diverse networks; Real networks and typical synthetic networks are quite vulnerable to damage attack since at the cross-point the network already lost most of its functionalities. Further investigation shows that degree attack tends to produce networks with more heterogenous damage distribution than damage attack, which accounts for the existence of the cross-point.
All above findings together suggest that damage attack is one of most potentially destructive attacks, deserving further research efforts. The vulnerability of real networks and synthetic networks also poses a great challenge for us to protect these networks. Results in this paper may shed light on efficient solutions to protect complex networks against damage attack.
Acknowledgements This work was supported by the National Natural Science Foundation of China under grants No.61003001, No.60703093; Specialized Research Fund for the Doctoral Program of Higher Education No.20100071120032; Innovation Program of Shanghai Municipal Education Commission under Grant No.10YS163; the Specialized Foundation of Shanghai Education Commission for Outstanding Young Teachers in University under Grant No.sdl-09015.
VII References and notes
References
- Cohen et al. (2000) R. Cohen, K. Erez, D. ben Avraham, and S. Havlin, Physical Review Letters 85, 4626 (2000).
- Cohen et al. (2001) R. Cohen, K. Erez, D. ben Avraham, and S. Havlin, Physical Review Letters 86, 3682 (2001).
- Paul et al. (2004) G. Paul, T. Tanizawa, S. Havlin, and H. Stanley, The European Physical Journal B 38, 187 (2004).
- Tanizawa et al. (2005) T. Tanizawa, G. Paul, R. Cohen, S. Havlin, and H. E. Stanley, Physical Review E 71, 047101 (2005).
- Tanizawa et al. (2006) T. Tanizawa, G. Paul, S. Havlin, and H. E. Stanley, Physical Review E 74, 016125 (pages 8) (2006).
- Holme et al. (2002) P. Holme, B. J. Kim, C. N. Yoon, and S. K. Han, Physical Review E 65, 056109 (2002).
- R. Albert and Barab si (2000) H. J. R. Albert and A.-L. Barab si, Nature (London) 406, 198701 (2000).
- Karrer et al. (2008a) B. Karrer, E. Levina, and M. E. J. Newman, Physical Review E 77, 046119 (pages 9) (2008a).
- Moreira et al. (2009) A. A. Moreira, J. José S. Andrade, H. J. Herrmann, and J. O. Indekeu, Physical Review Letters 102, 018701 (2009).
- Paolo Crucitti and Rapisarda (2004) M. M. Paolo Crucitti, Vito Latorab and A. Rapisarda, Physica A 430, 018701 (2004).
- Herrmann et al. (2010) H. J. Herrmann, C. M. Schneider, A. A. Moreira, J. S. A. Jr, and S. Havlin, Journal of Statistical Mechanics: Theory and Experiment (In Press) (2010).
- Buldyrev et al. (2010) S. V. Buldyrev, R. Parshani, G. Paul, H. E. Stanley, and S. Havlin, Nature 464, 1025 (2010), ISSN 0028-0836.
- Xiao et al. (2008) S. Xiao, G. Xiao, and T. H. Cheng, Communications Magazine, IEEE 46, 146 (2008).
- Wu et al. (2007) J. Wu, H. Z. Deng, Y. J. Tan, and D. Z. Zhu, Journal of Physics A: Mathematical and Theoretical 40, 2665 (2007).
- Karrer et al. (2008b) B. Karrer, E. Levina, and M. E. J. Newman, Physical Review E 77, 046119 (2008b).
- Newman and Girvan (2004) M. E. J. Newman and M. Girvan, Physical Review E 69, 026113 (2004).
- Newman (2004) M. E. J. Newman, Physical Review E 69, 066133 (2004).
- Lemke et al. (2004) N. Lemke, F. Herédia, C. K. Barcellos, A. N. Dos Reis, and J. C. M. Mombach, Bioinformatics 20, 115 (2004), ISSN 1367-4803.
- Schmith et al. (2005) J. Schmith, N. Lemke, J. C. Mombach, P. Benelli, C. K. Barcellos, and G. B. Bedin, Physica A: Statistical Mechanics and its Applications 349, 675 (2005), ISSN 0378-4371.
- Barabasi and Albert (1999) A. L. Barabasi and R. Albert, Science (New York, N.Y.) 286, 509 (1999), ISSN 1095-9203.
- Erdős and Rényi (1959) P. Erdős and A. Rényi, Publ. Math. Debrecen 6, 290 (1959).
- Holme (2004) P. Holme, EPL (Europhysics Letters) 68, 908 (2004), URL http://stacks.iop.org/0295-5075/68/i=6/a=908.
- Holme et al. (2007) P. Holme, J. Karlin, and S. Forrest, in Proceedings of the Royal Society A 463 (2007), pp. 1231–1246.
- Brandes (2001) U. Brandes, Journal of Mathematical Sociology 25, 163 (2001).
- Whitney (1932) H. Whitney, Transactions of the American Mathematical Society 34, 339 (1932).
- Gross and Yellen (2005) J. L. Gross and J. Yellen, Graph Theory and Its Applications, Second Edition (Discrete Mathematics and Its Applications) (Chapman & Hall/CRC, 2005), ISBN 158488505X.