A new method for reconstructing the density distribution of matter
in the disks of spiral galaxies from the rotation velocity curve in it
Abstract
ABSTRACT
In this paper we propose a new method for reconstructing the surface density of matter in flat disks of spiral galaxies. The surface density is expressed through observational rotation velocity curves of visible matter in the disks of spiral galaxies. The new method is not based on quadrature of special functions. The found solution is used for processing and analysis of observational data from several spiral galaxies. The new method can be used to more accurately estimate the amount of dark matter in spiral galaxies.
I Introduction
Let us consider a model of a spiral galaxy with all matter distributed in a thin disk (thickness disk is neglected). Accounting for the components of a spherical halo of the galaxy see in section VI.
Let us consider the axisymmetric model in cylindrical coordinates .
In the disk we assume a stationary rotation of dust-like matter, i.e. equality (modulo) of the gravitational and centrifugal forces:
| (1) |
Here is the rotation velocity curve of the matter and is the Newtonian gravitational potential of the dust matter, which may be expressed as:
| (2) |
where is the distribution of the surface density of matter in the disk.
We pose the problem: Express the distribution of the matter surface density, , in the disk from the rotation velocity curve of the matter .
The potential is a function of . Gauss’s theorem for this potential leads to the expression:
| (3) |
Here is the gravitational constant.
Thus, we can obtain an integral equation expressing the velocity by the integral of the surface density . This equation can be inverted (see Alar Toomre (1963); Kostov (2006)) to express the surface density through the rotation velocity curve in the disc:
| (4) |
Here and are Bessel functions.
Using this method to determine the surface density has significant shortcomings:
1. To find the desired function it is necessary to integrate a fourfold integral, whereas the Bessel functions themselves are each expressed in terms of integrals.
2. In the integrand of (4) are oscillating and slowly decaying (as ) Bessel function, which also makes it difficult to integrate.
3. The integrals has infinite upper limits and therefore they requires a large numerical resources (change of variables leads to new difficulties due to the oscillating integrands).
All of these deficiencies substantially affect the quality of the results (obtained by numerical methods).
In papers Jalocha J., Bratek L., Kutschera M. (2008); Bratek L., Jalocha J., Kutschera M. (2008); Bratek L., Jalocha J., Kutschera M. and Skindzier P. (2010), a more convenient method based on integrals of elliptic functions. It was shown that the main errors arise due to ignorance of the distribution rotation velocity curve at large values of . The same problem (stability of the numerical calculation of ) was studied in Polyachenko E. V. (2004, 2005).
In this paper we propose a new method for solving the problem of determining the surface density from the disc velocity curve . Our method does not require knowledge of the numerical values of special functions (Bessel functions and/or elliptic functions).
II The new method
Using the relation for the Bessel functions and applying integration by parts to the integral for we rewrite expression (4):
| (5) |
Here we took into account that
Also we took into account that at the function is limited and vanishes (no velocity on the axis). At the opposite is the case, i.e. the function is limited and the function decays as .
We denote the gradient of the square of the velocity as :
| (6) |
Substituting the integral definition of Bessel functions of zero order
| (7) |
into eq. (5), gives:
| (8) |
It was here taken into account that is an even dunction, so that the integration over in (5) can be made by changing the limits of integration to go from to and multiplying the result with a factor .
Let us now consider the integral representation of the Dirac delta-function:
and substitute it in (8):
| (9) |
Here we take into account the integration rules of the complex delta-function:
where are the simple roots of the equation . Also we should have that , which means that the integration region with respect to and reduces to the two sectors:
| (14) |
By renaming the variables and in these sectors111In the first case, we redefine , ; in the second case: , . we may reduce the integral (9) to the form:
| (15) |
This expression, (15), is the desired result which is without the deficiencies mentioned in section I.
Note that in expression (15) we used the so-called holographic principle, i.e. each point of the density distribution contains the information about all points of distribution . This is due to integration over the angles and . Integration over the angle provides a scanning range , and integration over the angle provides a scanning range . In addition, in the denominator of the integrand provides increased weight of the integrand at large . The converse is also true; each point of the distribution contains information about all points of the density distribution - see section III.
This interesting feature is characteristic for the mass distribution in a flat disk222In the case of spherical symmetry, the model will no longer possess such a property; each point in the distribution of velocity will carry information only about the total mass inside a sphere with a radius , and value of the mass density will be associated only with the pressure of matter (not with velocity)..
III Checking the method
For basic testing of our new method, we use the following approach; We integrate the expression (1) with respect to :
| (18) |
On the other hand, this same expression can be obtained from (2):
| (19) |
Or as:
| (20) |
The integrals (19) and (20) do not have non-integrable singularities and can therefore easily be found numerically.
Expressions for the functions and ought to be identical, as they must be equal to the expression . Thus, we may judge the practical precision of our new method by evaluating and comparing the expressions for and (using our new method to calculate ).
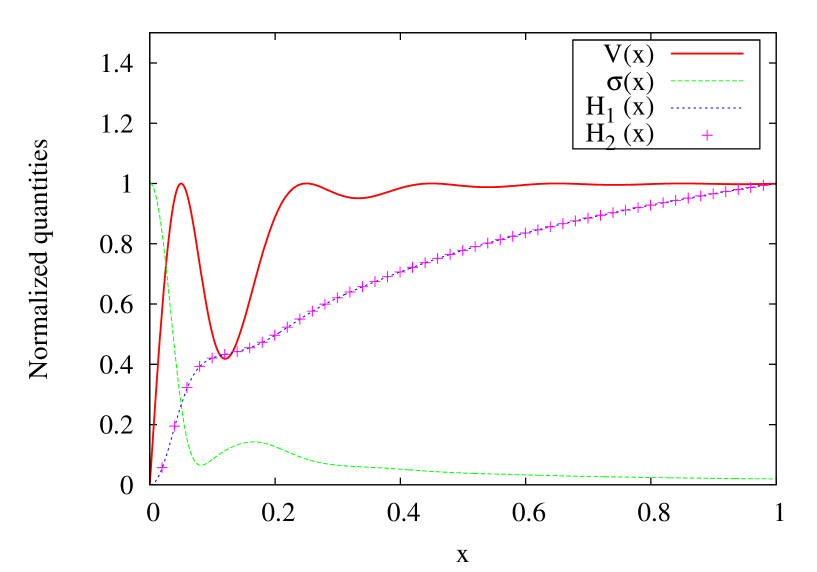
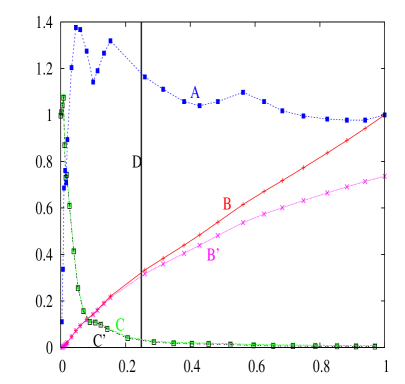
To evaluate and compare these expressions, and thus to put our new method to use, we have written a simple numerical code, the details of which are described in Appendix A. In Fig. 1 is shown an example of such a comparison, where we have used the sample velocity function :
| (21) |
as the basis for data. In the figure this velocity function and are calculated by using our new method. Also, of course, is plotted the two functions and that we wish to compare.
As can be seen from the figure (and as has been confirmed by detailed analysis of the figure), the two functions and agree very closely. This is also the case for other velocity functions we have tested. Thus we conclude that our new method is both valid and accurate, even when doing the integrations numerically.
IV Special cases and asymptotic distribution of the density of matter
In some special cases, expression (15) can be reduced to an ordinary quadrature and we may find the asymptotic behaviour of .
1. Consider the simplest case for the distribution function and the rate :
| (26) |
The integral over in expression (15) can be easily evaluated and we may obtain the quadrature:
| (29) |
or in another form:
| (32) |
From expression (29) we find that the asymptotic behaiour at goes as .
From expression (32) we find that the asymptotic behaviour at goes as .
It is noted that the asymptotic behaviour of has a weak singularity at the origin. This is connected with the non-rigid rotation of matter around the central axis (for the case of rigid rotation, we should have at ) - see eq. (26).
, , and .
The horizontal axis is the distance in units of . On the vertical axis plots:
;
; for ;
; for ;
vertical line marking the end of the stellar disk to the 25-th blue isophotes.
2. We now consider another simple case, that of bounded rigid-body rotation:
| (37) |
In this case the analogue of the integral (29) has the form:
| (40) |
This integral is expressed through the elliptic integral of the 2nd kind, here the asymptotic behaviour at is nonsingular and we have that . At infinity, the asymptotic behaviour remains the same: That is, at we have .
V OBSERVATIONAL DATA
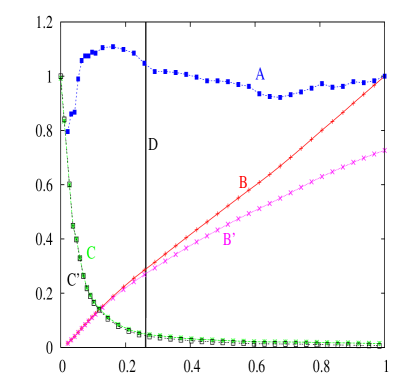
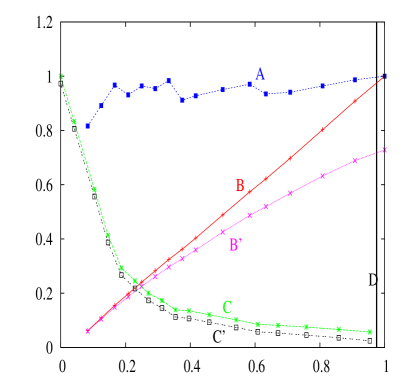
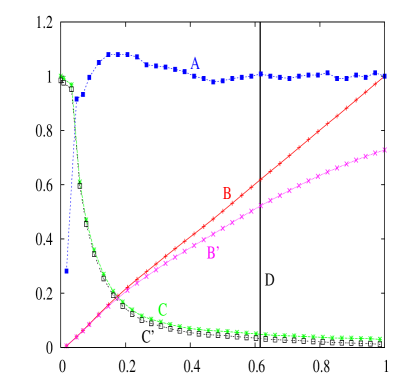
By using the method described above we have restored the matter surface density profiles for the discs of 4 spiral galaxies basing on their observed rotation curves. The four galaxies are : a) NGC 2841, b) NGC 7217, c) NGC 7331, and d) NGC 5533 (the general characteristics of the galaxies are listed in Table 1 and the restored surface density distributions are presented in Fig. 3(d)).
We use for computing the two limiting cases (see Fig. 3(d)) for the behavior of the curve at large (where the velocity distribution is unknown):
1.
2.
The second case corresponds to a Keplerian tail in the velocity distribution of matter, quantities corresponding to this case, marked on Fig. 3(d) by a prime.
The galaxies under consideration are all giant spiral galaxies of the Sab-Sb type and all of them are classified as unbarred This is important because the axisymmetry of the galaxies signifies regular circular rotation of the gas, providing a possibility to measure their rotation curves from a single spectral observation per galaxy if the spectrograph long slit is aligned with the disk isophote major axis. About accounting for the components of the spherical halo see section VI. The rotation curves have been obtained by measuring the line-of-sight velocities of the gas. Because the gas is a cold dynamical subsystem and it is confined to the thin disks, its rotation traces the gravitational potential distribution very well. For the inner parts of the rotation curves we have used spectral observations of the ionized (warm) gas which have a good spatial resolution (typically about 1 arcec that corresponds to a few dozen of parsecs for 3 of the 4 galaxies). For the outer parts, we used radio observations of the neutral hydrogen at 21 cm which has a spatial resolution that is worse by an order of magnitude compared to the optical. However, the neutral hydrogen disks are usually more extended than the stellar ones which allows us to trace the rotation curves (and thus the gravitational potential distribution associated with them) much farther from the galactic centres than where the stars are seen. The literature sources which we have used to construct the combined rotation curves for our 4 galaxies are listed in Table 2.
| NGC | 2841 | 5533 | 7217 | 7331 |
|---|---|---|---|---|
| Type (NED1) | SA(r)b | SA(rs)ab | (R)SA(r)ab | SA(s)b |
| , arcsec (LEDA2) | 244 | 93 | 117 | 314 |
| , kpc | 16.6 | 19.3 | 9.3 | 23 |
| Distance, Mpc (NED) | 14 | 43 | 16.5 | 15 |
| (LEDA) | –20.84 | –21.6 | –20.48 | –21.56 |
| , , (LEDA, HI) | 295 | 206 | 143 | 237 |
| , | 2.8 | 30 | 0.7 | 8.2 |
| 1NASA/IPAC Extragalactic Database | ||||
| 2Lyon-Meudon Extragalactic Database | ||||
| 3from Bosma A. (1981) for NGC 2841 and NGC 7331 and from Noordermeer E., van der Hulst J. M., Sancisi R., Swaters R. A., van Albada T. S. (2005) for NGC 5533 and NGC 7217 | ||||
It is interesting to compare the restored density distributions of the gravitating matter with the distributions of the stellar component in the galaxies considered; in all of them the stars are the dominating baryonic content. For this purpose we have used surface photometry data from the literature for our galaxies. NGC 7331 and NGC 2841 have extended radial profiles of the surface brightness in the NIR (2 mkm) photometric band published in the survey by Munoz-Mateos J. C., Gil de Paz A., Zamorano J., Boissier S., Dale D. A. et al. (2009), the other two galaxies have been studied by us earlier in the -band (NGC 5533, see Sil’chenko O.K., Burenkov A.N., Vlasyuk V.V. (1998)) and in the -band (NGC 7217, see Sil’chenko O.K., Afanasiev V.L. (2000)). To derive a density distribution from the brightness distribution or to calculate the brightness distribution corresponding to some density distribution, we need to know the mass-to-light ratio in the specified photometric band appropriate for the stellar population of the particular age and metallicity. At the same time, the latter characteristics are only known for the disks of a few nearby spiral galaxies. For NGC 7217 and NGC 5533 we have studied the radial distributions of the mean age and metallicity of the stellar populations in their disks by analysing long-slit spectral data from the reducer SCORPIO of the Russian 6-meter telescope Afanasiev V.L., Moiseev A.V. (2005). So for these galaxies we are able to use the appropriate mass-to-light ratio values obtained in the evolutionary synthesis models by Percival S.M., Salaris M., Cassisi S., Pietrinferni A. (2009) (and re-calculated by us for the reduced Salpeter IMF so slightly increased with respect to the models by Percival S.M., Salaris M., Cassisi S., Pietrinferni A. (2009) which used the Kroupa IMF). For the other two galaxies, NGC 2841 and NGC 7331, the disk stellar population parameters are unknown; for them we have used the empirical calibrations of the mass-to-light ratio values versus broad-band colours from Bell E.F., McIntosh D.H., Katz N., Weinberg M.D. (2003) – one versus in NGC 2841 and the other versus in NGC 7331 (the broad-band colour profiles for them are also taken from the photometric survey Munoz-Mateos J. C., Gil de Paz A., Zamorano J., Boissier S., Dale D. A. et al. (2009)).
| NGC | References | NGC | References |
|---|---|---|---|
| 2841 | rot(H+[NII]): Afanasiev V.L., Sil’chenko O.K. (1999) | 7217 | rot(H+[NII]): Zasov A.V., Sil’chenko O.K. (1997) |
| rot(HI): Begeman K.G. (1987); Begeman K.G., Broeils A.H., Sanders R.H. (1991) | rot(HI): Noordermeer E., van der Hulst J. M., Sancisi R., Swaters R. A., van Albada T. S. (2005) | ||
| density(HI): Bosma A. (1981) | density(HI): Noordermeer E., van der Hulst J. M., Sancisi R., Swaters R. A., van Albada T. S. (2005) | ||
| phot: Munoz-Mateos J. C., Gil de Paz A., Zamorano J., Boissier S., Dale D. A. et al. (2009) | phot: Noordermeer E., van der Hulst J. M. (2007) | ||
| 5533 | rot(H+[NII]): Sil’chenko O.K., Burenkov A.N., Vlasyuk V.V. (1998) | 7331 | rot(H+[NII]): Afanasiev V.L., Sil’chenko O.K., Zasov A.V. (1989) |
| rot(HI): Noordermeer E., van der Hulst J. M., Sancisi R., Swaters R. A., van Albada T. S. (2005) | rot(HI): Begeman K.G. (1987); Begeman K.G., Broeils A.H., Sanders R.H. (1991) | ||
| density(HI): Broeils A.H., van Woerden H. (1994) | density(HI): Bosma A. (1981) | ||
| phot: Sil’chenko O.K., Burenkov A.N., Vlasyuk V.V. (1998); Noordermeer E., van der Hulst J. M. (2007) | phot: Munoz-Mateos J. C., Gil de Paz A., Zamorano J., Boissier S., Dale D. A. et al. (2009) |
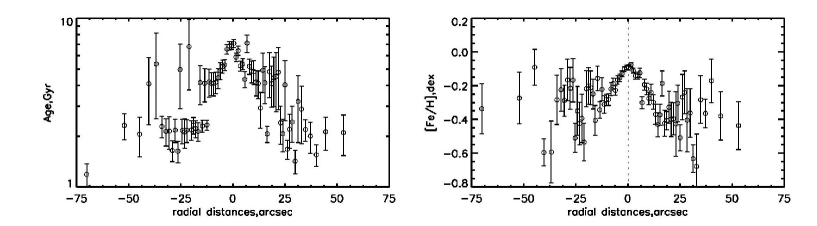
Earlier we have found two large-scale stellar disks with different characteristics of the stellar populations in NGC 7217 Sil’chenko O.K., Chilingarian I.V., Sotnikova N.Ya., Afanasiev V.L. (2011a, b): inside a thin stellar disk with the mean stellar age of 5 Gyr and the mean metallicity of [Z/H] dominates. At larger distances from the center a thicker and more extended star forming stellar disk with a younger, Gyr, and very metal-poor, [Z/H], stellar population is seen. The border between two disks is rather narrow so a jump in the mass-to-light ratio is noticeable at ; the matter density profile (Fig. 3(d)) demonstrates a break at the same radius. NGC 5533 is also a multicomponent stellar system, however this time the limits of the subsystems do not coincide in the brightness and density profiles: all the subsystems are more extended as presented by the gravitating matter density distribution. The surface photometry allows to distinguish a bulge-dominated region within , an inner stellar disk at , and an outer stellar disk of low surface brightness at Sil’chenko O.K., Burenkov A.N., Vlasyuk V.V. (1998). By applying the software ULYSS Koleva M., Prugniel Ph., Bouchard A., Wu Y. (2009) to the long-slit spectral data obtained with the SCORPIO of the 6m telescope, we have succeeded to derive the stellar populations characteristics up to , so only for the inner stellar disk. The results are shown in Fig. 3. One can see that at , or beyond the bulge-dominated area, both the age and the metallicity demonstrate flat radial dependencies. So for the inner stellar disk in NGC 5533 we can use the mean values of the stellar population characteristics at , namely, Gyr and [Z/H]. We have taken the model mass-to-light ratio just for these stellar population parameters from Percival S.M., Salaris M., Cassisi S., Pietrinferni A. (2009), and then have added 0.15 in the logarithm to re-calculate it with the reduced Salpeter initial mass function (IMF) instead of the Kroupa IMF used by Percival S.M., Salaris M., Cassisi S., Pietrinferni A. (2009) (the recommendation are taken from Bell E.F., McIntosh D.H., Katz N., Weinberg M.D. (2003)).
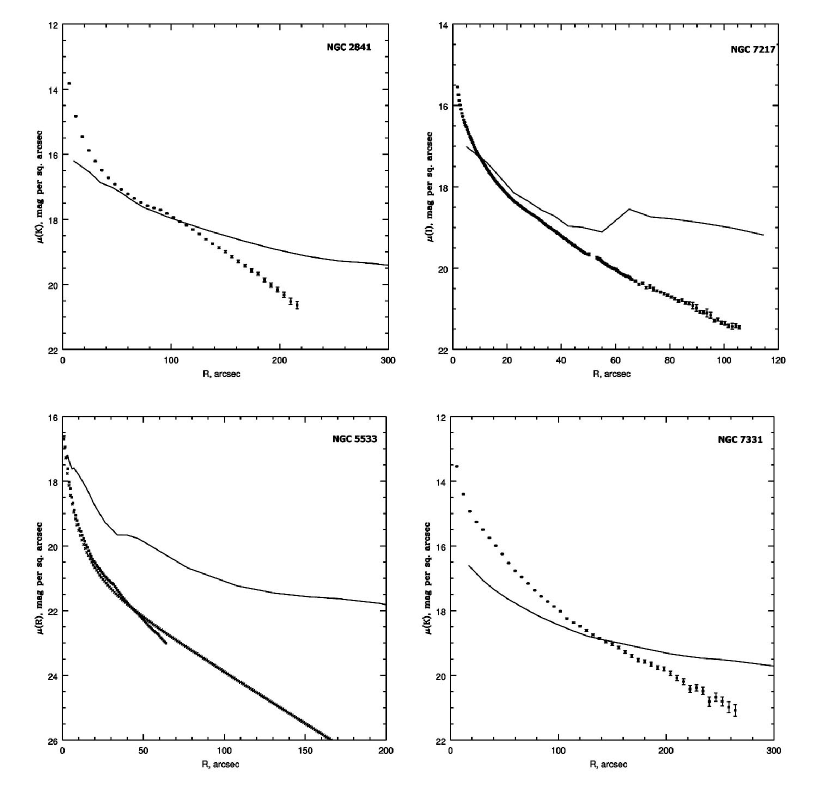
So in Fig. 4 we confront the observed surface brightness profiles with those calculated from the matter density profiles reconstructed from the rotation curves. If the main contributor into the gravitational potential of a galaxy is a stellar disk, two profiles must coincide. What have we discovered from the Fig. 4? We see that the different galaxies demonstrate different contributions of their stellar disks into the total gravity. In NGC 2841 and NGC 7217 the inner parts of both profiles are in agreement; in these galaxies, indeed, within kpc in NGC 2841 and within kpc in NGC 7217, the stellar disks are the main contributors into the total gravitational potentials. In the outer parts of the galaxies a ‘hidden mass’ reveals itself – the profiles reconstructed from the rotation curves go strongly above the observed surface brightness profiles. But in other two galaxies, NGC 5533 and NGC 7331, the observed and calculated profiles diverge everywhere in the galaxies. In NGC 5533 the ‘hidden mass’ dominates in the gravitational potential over the whole galaxy extension – it is just the same conclusion that we have already made in our previous work basing on the analysis of the rotation curve shape Sil’chenko O.K., Burenkov A.N., Vlasyuk V.V. (1998). NGC 7331 represents a more intriguing situation: the observed central brightness exceeds our expectations arisen from the low visible rotation velocity. We think that non-circular gas motions are significant in the center of this galaxy so the rotation curve derived from the single long-slit cross-section along the isophote major axis does not reflect a circular speed which characterizes the gravitational potential. Our suspicion about the tri-axiality of the gravitational potential shape in NGC 7331 has also been expressed by us earlier Sil’chenko O.K. (1999).
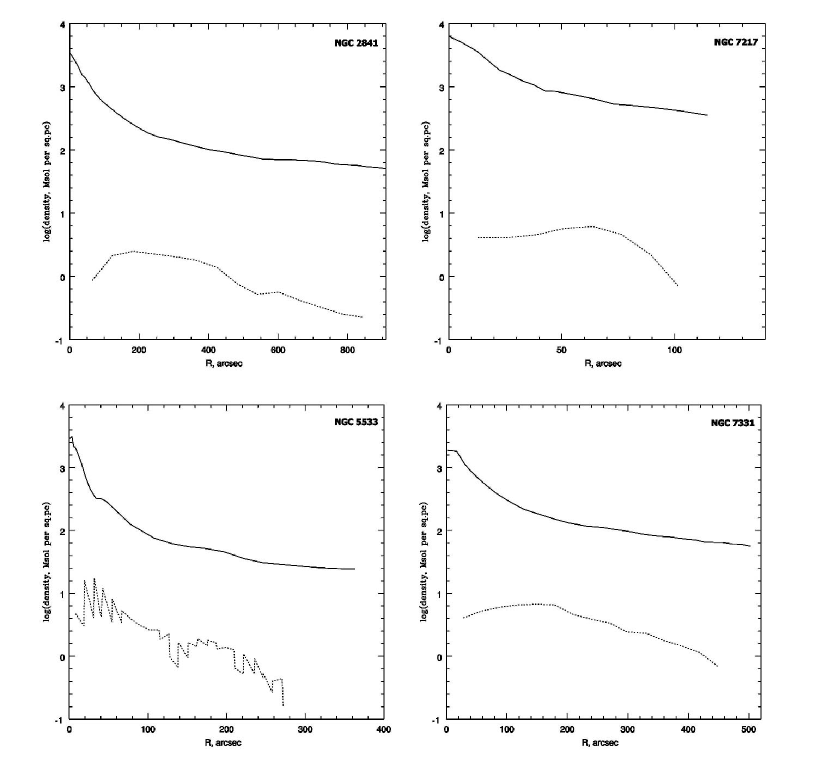
What properties of NGC 2841 and NGC 7217 may be related to the dominance of their large-scale stellar disks in their total gravity? We can do a couple of suggestions. First of all, both galaxies are classified as isolated and are included into the list of isolated galaxies by Karachentseva V.E. (1973). Secondly, there is a noticeable difference in neutral hydrogen content between NGC 2841 and NGC 7217, on one hand, and NGC 5533 and NGC 7331, on the other hand: the latter pair of galaxies is more gas-rich (see the Table 1). In Fig. 5 we compare radial profiles of the gravitating matter density reconstructed by us from the rotation curves, to the neutral hydrogen surface density radial distributions (at the logarithmic scales) for all four galaxies. While in NGC 2841 and NGC 7217 the neutral hydrogen contributes less than one percent of the total surface density, in NGC 5533 and NGC 7331 its contribution is as high as a few percent over the whole extension of the galactic disks. Moreover, the total character of the gas density and matter density profiles is the same: they look like a quasi-exponential decreasing function which is very typical just for stellar and gaseous disks of galaxies. The remark that the ‘hidden mass’ distribution in spiral galaxies is quite similar to the ‘visible’ gas distribution has been already made earlier by e.g. Hoekstra H., van Albada T.S., Sancisi R. (2001). The fact found by us in this work that the gravitating matter surface density distribution agrees better with that of the stellar component in the gas-poor galaxies is therefore in line with the hypothesis by Pfenniger D., Combes F., Martinet L. (1994) that the ‘hidden mass’ in spiral galaxies is in fact very cold molecular gas which cannot be observed in accessible electromagnetic radiation spectral domains.
VI Accounting for the components of a spherical halo of the galaxy
In all previous sections we ignored the fact that much of the matter of the galaxy, in principle, can be concentrated in a spherically symmetric halo, which has a mass function . Initially, we do not know the distribution of the spherical mass , this feature is a free parameter model.
Due to the additivity of the potential (in the Newtonian approximation), it can be divided into two parts (the disk and a spherical component):
| (41) |
Then equation (1) in the equatorial plane () can rewritten in as333Here we took into account that for the spherical part of potential we have: .:
| (42) |
Hence, all subsequent arguments (starting with the formula (1)) amounts to replacing the observed features as:
| (43) |
Here we are free to vary the expression in the range from zero to a value approximately equal to , where denotes the mass which is concentrated in the disk to a certain radius . You can, for example, from a certain radius (e.g. the radius of the observed stellar disk to the end of the 25-th blue isophotes), put , where is the total mass of matter in the galactic disk. This will correspond to the termination of the matter density in the disk at this radius (25-th blue isophotes).
VII Conclusions
In this paper we considered a new method for reconstructing of the surface density of matter in a flat disk of spiral galaxies. At the beginning we suppose that all matter is concentrated in the disk of the galaxy and apply the method for reconstructing the surface density of matter in 4 spiral galaxies: NGC2841, NGC7217, NGC7331 and NGC5533. We compared our results with the distributions of the stellar matter. This comparison allows us to obtain some conclusions about dark matter in these galaxies. In section VI we discuss possible accounting for the components of the spherical halos.
ACKNOWLEDGEMENTS
We thank Bratek L., Jalocha J., Kutschera M., Skindzier P. and Polyachenko E.V. for valuable comments and discussions of this work.
This work was supported in part by the Federal Programm ”Scientific and Pedagogical Personal of Innovative Russia 2009-2013”, and by the program of the Presidium of Academy of Sciences ”Origin, structure and evolution of objects in the Universe 2011”. Jakob Hansen was supported in part by the Research Grant from SUN Micro Systems at KISTI.
Appendix A Numerical Integration of our new method
As described in the main text, we wish to use our new method for finding distributions of surface density and mass throughout a galactic disk, i.e. eqs. 16 and 17. Due to the observational nature of our input data (the velocity function), our only means for solving these equations are by numerical methods. This appendix describes and tests our numerical code developed for this purpose.
The fundamental integral of our method, eq. 16, do not have non-integrable singularities, however, the integrand may be ill-defined at the integration endpoints. Because of that, we use the open-ended second Euler-Maclaurin integration formula as our basic integration algorithm. Secondly, we use increasing numerical resolutions and Romberg’s method to achieve the highest possible accuracy (see discussion on these techniques and further references e.g. in Press et al. (1992)). We use these methods with enough iterations until the result has satisfactorily converged.
In addition to these basic integration techniques, a few other ”tricks” are needed. Our basic data for integration will usually be a discrete set of velocity data in the disk as a function of the radius, . Obviously, eq. 16 is a function of the velocity function, but because the velocity function is expressed through the intermediate variable (see eqs. 15-16), we will often need values of the velocity function not explicitely tabulated by our observational data. To solve this issue we need to use interpolation for velocity data in between observational data points and also we need to make some assumptions about the behaviour of the velocity function at points beyond the tabulated range of observational data.
To obtain velocity data for points in between the observational data points, we have used simple linear interpolation (attempts with using higher order interpolations were made, but yielded no increased accuracy). Furthermore, we have made the assumptions that 1) the velocity at the central axis is zero and 2) that the velocity beyond the outermost observed point is a constant function with a value equal to that of the outermost observed point.
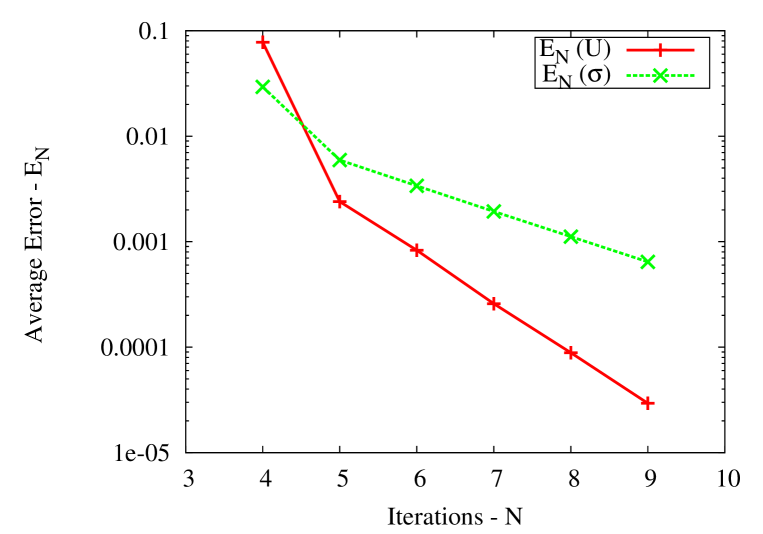
Finally, we have tested our numerical implementation of the new method by doing a number of convergence tests. We define an average error measure as :
| (44) |
where denotes the function we are investigating, denotes the number of data points (in ) and denotes the number of iterations we use in Romberg’s method444I.e. ”” indicates higher resolution than ””.. The data in figure 6 uses this error measure for the two basic basic functions and (c.f. eq. 16) for varying number of iterations. These two functions are the most basic functions of our new method and if the method is correctly numerically implemented, the average error must converge to zero as we increase the numerical resolution (number of Romberg iterations).
As the input data for this figure we have used the test velocity function eq. 21, but it is noted that similar results are obtained if actual observational velocity data is used. From the figure it is clearly seen that both and are converging towards zero with incresing number of iterations. This is exactly what we expect and we thus conclude that the numerical implementation of our new method is correct.
Finally it is noted that for all numerical results presented in this paper, convergence tests have been made to confirm that the presented data has converged to its limiting value.
References
- Alar Toomre (1963) Alar Toomre, Ap.J. 138, 385 (1963).
- Kostov (2006) V. Kostov (2006), eprint ArXiv: astro-ph/0604395.
- Jalocha J., Bratek L., Kutschera M. (2008) Jalocha J., Bratek L., Kutschera M., ApJ 679, 373 (2008).
- Bratek L., Jalocha J., Kutschera M. (2008) Bratek L., Jalocha J., Kutschera M., MNRAS 391, 1373 1383 (2008).
- Bratek L., Jalocha J., Kutschera M. and Skindzier P. (2010) Bratek L., Jalocha J., Kutschera M. and Skindzier P., MNRAS 407, 1689 1700 (2010).
- Polyachenko E. V. (2004) Polyachenko E. V., MNRAS 348, 345 (2004).
- Polyachenko E. V. (2005) Polyachenko E. V., MNRAS 357, 559 (2005).
- Bosma A. (1981) Bosma A., Astron. J. 86, 1791 (1981).
- Noordermeer E., van der Hulst J. M., Sancisi R., Swaters R. A., van Albada T. S. (2005) Noordermeer E., van der Hulst J. M., Sancisi R., Swaters R. A., van Albada T. S., A & A 442, 137 (2005).
- Munoz-Mateos J. C., Gil de Paz A., Zamorano J., Boissier S., Dale D. A. et al. (2009) Munoz-Mateos J. C., Gil de Paz A., Zamorano J., Boissier S., Dale D. A. et al., ApJ 703, 1569 (2009).
- Sil’chenko O.K., Burenkov A.N., Vlasyuk V.V. (1998) Sil’chenko O.K., Burenkov A.N., Vlasyuk V.V., New Astron. 3, 15 (1998).
- Sil’chenko O.K., Afanasiev V.L. (2000) Sil’chenko O.K., Afanasiev V.L., A & A 364, 479 (2000).
- Afanasiev V.L., Moiseev A.V. (2005) Afanasiev V.L., Moiseev A.V., Astron. Letters 31, 194 (2005).
- Percival S.M., Salaris M., Cassisi S., Pietrinferni A. (2009) Percival S.M., Salaris M., Cassisi S., Pietrinferni A., ApJ 690, 427 (2009).
- Bell E.F., McIntosh D.H., Katz N., Weinberg M.D. (2003) Bell E.F., McIntosh D.H., Katz N., Weinberg M.D., ApJSuppl 149, 289 (2003).
- Afanasiev V.L., Sil’chenko O.K. (1999) Afanasiev V.L., Sil’chenko O.K., Astron. J. 117, 1725 (1999).
- Zasov A.V., Sil’chenko O.K. (1997) Zasov A.V., Sil’chenko O.K., Astron. Rep. 41, 734 (1997).
- Begeman K.G. (1987) Begeman K.G., PhD Thesis, Kapteyn Institute (1987).
- Begeman K.G., Broeils A.H., Sanders R.H. (1991) Begeman K.G., Broeils A.H., Sanders R.H., MNRAS 249, 523 (1991).
- Noordermeer E., van der Hulst J. M. (2007) Noordermeer E., van der Hulst J. M., MNRAS 376, 1480 (2007).
- Afanasiev V.L., Sil’chenko O.K., Zasov A.V. (1989) Afanasiev V.L., Sil’chenko O.K., Zasov A.V., A & A 213, L9 (1989).
- Broeils A.H., van Woerden H. (1994) Broeils A.H., van Woerden H., A & A Suppl. 107, 129 (1994).
- Sil’chenko O.K., Chilingarian I.V., Sotnikova N.Ya., Afanasiev V.L. (2011a) Sil’chenko O.K., Chilingarian I.V., Sotnikova N.Ya., Afanasiev V.L., MNRAS in press (2011a).
- Sil’chenko O.K., Chilingarian I.V., Sotnikova N.Ya., Afanasiev V.L. (2011b) Sil’chenko O.K., Chilingarian I.V., Sotnikova N.Ya., Afanasiev V.L. (2011b), eprint ArXiv: 1103.1692.
- Koleva M., Prugniel Ph., Bouchard A., Wu Y. (2009) Koleva M., Prugniel Ph., Bouchard A., Wu Y., A & A 501, 1269 (2009).
- Sil’chenko O.K. (1999) Sil’chenko O.K., Astron. J. 118, 186 (1999).
- Karachentseva V.E. (1973) Karachentseva V.E., Catalogue of isolated galaxies. Soobscsh. Spets. Astrofiz. Obs. 8, 3 (1973).
- Hoekstra H., van Albada T.S., Sancisi R. (2001) Hoekstra H., van Albada T.S., Sancisi R., MNRAS 323, 453 (2001).
- Pfenniger D., Combes F., Martinet L. (1994) Pfenniger D., Combes F., Martinet L., A & A 285, 79 (1994).
- Press et al. (1992) W. Press, S. A. Teukolsky, W. T. Vetterling, and B. P. Flannery, NUMERICAL RECIPES in Fortran 77 (Cambridge University Press, 1992), 2nd ed.