Transformation from spirals into S0s with bulge growth in groups of galaxies
Abstract
Recent observations have revealed that the time evolution of the S0 number fraction at intermediate and high redshifts () is more dramatic in groups of galaxies than in clusters. In order to understand the origin of S0s in groups, we investigate numerically the morphological transformation of spirals into S0s through group-related physical processes. Our chemodynamical simulations show that spirals in group environments can be strongly influenced by repetitive slow encounters with group member galaxies so that those with thin disks and prominent spiral arm structures can be transformed into S0s with thick disks and without prominent spiral arm structure. Such tidal interactions can also trigger repetitive starbursts within the bulges of spirals and consequently increase significantly the masses of their bulges. Owing to rapid consumption of gas initially in spirals during the bulge growth, the S0s can become gas-poor. The S0s transformed from spirals in this way have young and metal-rich stellar populations in the inner regions of their bulges. The simulated S0s have lower maximum rotational velocities and flatter radial line-of-sight velocity dispersion profiles in comparison to their progenitor spirals. The formation processes of S0s due to tidal interactions depend not only on the masses and orbits of the progenitor spirals, but also on group mass. A significant fraction (%) of stars and gas can be stripped during this spiral to S0 morphological transformation so that intragroup stars and gas can be formed. Based on these results, we discuss structures, kinematics, chemical properties, and the Tully-Fisher relation of S0s in groups.
keywords:
galaxies: evolution– galaxies: elliptical and lenticular, cD– galaxies: high-redshift– galaxies: starburst– galaxies: bulges1 Introduction
Many authors have long discussed when and how S0s were formed in different environments based on their observed fundamental properties such as apparent shapes (e.g., van den Bergh 1976; Holden et al. 2009), gas content (e.g., Bothun 1982; Welch & Sage 2003), stellar structure and kinematics (e.g., Kormendy & Illingworth 1982; Burstein 1979; Fisher 1997; Emsellem et al. 2007; Laurikainen et al. 2010), counter-rotating components (e.g., Bertola et al. 1992), stellar population ages (e.g., Kuntschner & Davies 1998), color-magnitude relation (e.g., Ellis et al. 1997; Stanford et al. 1998; van Dokkum et al. 1998), and the morphology-density relation (e.g., Dressler 1980). Most of these studies considered that S0s originate from spirals and thereby discussed what physical roles galaxy environments (e.g., groups and clusters) play in transforming spirals into S0s. Recent observations have suggested that not only environment but also galaxy mass might be important in S0 formation (e.g., Tasca et al. 2009; Vulcani et al. 2010). The origin of S0s has also been linked observationally to the evolution of other galaxy populations such as dusty starburst galaxies (e.g., Geach et al. 2009) and poststarburst ones with “E+A” spectra (e.g., Pracy et al. 2009).
A growing number of observational studies have revealed a smaller fraction of S0 galaxies in distant clusters of galaxies (relative to that observed in present day clusters), suggesting dramatic morphological evolution of spirals into S0s within these environments (Dressler et al. 1997; Couch et al. 1998; van Dokkum et al. 1998; Fasano et al. 2000; Smith et al. 2005; Postman et al. 2005; Desai et al. 2007; Poggianti et al. 2008; Vulcani et al. 2010), though such S0 evolution may not be real but due to morphological classification errors (e.g., Andreon 1998). Recent photometric studies of the structure of S0s have revealed intriguing scaling-relations between their bulges and disks and differences in bar strength between spirals and S0s (e.g., Buta et al. 2010; Laurikainen et al. 2010). These observations have provided new clues as to whether and how S0s are formed from spirals in different environments.
A number of theoretical models for the transformation of spirals into S0s have been proposed, which includes ram pressure stripping (e.g., Gunn & Gott 1972; Farouki & Shapiro 1980; Abadi et al. 1999), tidal encounters (e.g., Icke 1985), tidal compression by the gravitational field of clusters (e.g., Byrd & Valtonen 1990), truncation of gas replenishment (e.g., Larson et al. 1980; Bekki et al. 2002), and minor and unequal-mass merging (e.g., Bekki 1998). Given that S0s exist in different environments such as the field, groups, and clusters, with the S0 fraction depending on local galaxy density (e.g., Dressler 1980), all these physical mechanisms could be important and their relative importance of would depend on environmental parameters such as the total group and cluster mass. Thus it remains unclear which theoretical model is the most important in S0 formation for a given environment.
Recent observational studies on the evolution of the S0 fraction in groups and clusters have found that S0 evolution is significantly more dramatic in groups than in clusters (e.g., Wilman et al. 2009; Just et al. 2010). These observations suggest that cluster-related physical processes such as ram pressure stripping (e.g., Gunn & Gott 1972) are not responsible for the formation of the majority of S0s. Also, it is well known that galaxy bulges in S0s are systematically more luminous than those in spirals (e.g., Dressler 1980; Simien & de Vaucouleurs 1986; Christlein & Zabludoff 2004), which implies that bulges in spirals need to grow significantly in order to be transformed into S0s: disk-fading alone, due to the truncation of star formation, cannot be the main mechanism of S0 formation. Thus galaxy interactions and merging, which are highly likely to occur in groups, are a promising mechanism for S0 formation and thus need to be investigated theoretically using numerical simulations.
The purpose of this paper is thus to investigate how S0s are formed in the group environment using chemodynamical numerical simulations that enable us to investigate both dynamical properties (e.g., stellar kinematics) and star formation and chemical evolution histories for spirals within groups in a fully self-consistent manner. We consider that both (i) slow tidal encounters of galaxies with relative velocities () less than km s-1, and (ii) group tides are responsible for the transformation of spirals into S0s in the group environment. We particularly investigate how spirals with smaller bulges are transformed into S0s with bigger ones as a result of the tidal fields within groups and group member galaxy interactions. We discuss how this transformation process depends on the masses and orbits of galaxies, the interaction histories of group members, and the physical properties of groups such as their masses and sizes, based on a large and systematic parameter study of S0 formation.
The plan of the paper is as follows: In the next section we describe our numerical model for S0 formation in groups. In §3, we present the numerical results mainly on the physical properties of the simulated S0s. In §4, we discuss these results in the context of key observational results on the physical properties of S0s. We summarize our conclusions in §5.
| Model | 111The initial disk mass of a spiral in units of . | 222The initial size of a stellar disk for a spiral in units of kpc. | 333The initial bulge mass fraction () of a spiral. | 444The initial gas mass fraction () of a spiral. | 555The initial total mass of a group of galaxies in units of . | Orbital types 666“Normal model” means that a spiral can orbit the center of its host group whereas “Infall model” means that a spiral can infall onto a group from the outside of the group. | 777The initial distance of a spiral from the center of its host group. This is the -position of the spiral (and always positive) and represents the scale-length of the adopted NFW dark matter halo of the group. | 888For a normal model, the initial -component velocity of a spiral is given as , where is the circular velocity at the position of the spiral in a group. For an infall model, the -component velocity of a spiral is given as (because is always positive in the present study). | 999The impact parameter of the orbit of a spiral in a infall model. This corresponds to the initial -component of the location of the spiral. |
| Fiducial | 17.5 | 0.17 | 0.1 | Normal | 0.5 | ||||
| Representative | (1.2-60) | 6.6-17.5 | 0-0.7 | 0-0.5 | (0.05-1.0) | Normal/Infall | (1-7) | 0.2-1 | (0.5-2) |
2 The model
2.1 Group of galaxies
In order to simulate the time evolution of spirals in groups, we use the latest version of GRAPE (GRavity PipE, GRAPE-7), which is the special-purpose computer for gravitational dynamics (Sugimoto et al. 1990). We use our original GRAPE-SPH code (Bekki 2009) which combines the method of smoothed particle hydrodynamics (SPH) with GRAPE for calculations of three-dimensional self-gravitating fluids in astrophysics. In the present models, both a spiral galaxy and the dark matter halo of its host group of galaxies are represented by N-body particles so that not only dynamical friction of the spiral against the dark matter halo of the group but also dynamical influences of the halo on the spiral can be self-consistently investigated. Group member galaxies other than the spiral are modeled as point-mass particles, because we consider that such modeling is enough to grasp the essential ingredients of tidal influences of group member galaxies on the evolution of the spiral in the present study.
The structure of a group is modeled using an “NFW” profile predicted by the cold dark matter cosmology (Navarro et al. 1996) as follows:
| (1) |
where , , and are the spherical radius, the characteristic density of a dark halo, and the scale length of the halo, respectively. The mass and size of a group are represented by and , respectively. The parameter (, where is the virial radius of the NFW profile) for a group with is chosen according to the predicted - relation in the CDM simulations (e.g., Neto et al. 2007) :here the dark matter mass of the group corresponds to . A reasonable value of is thus 5.6 for and 4.7 for . We mainly show the results of the models with and kpc, though we investigate different models with ranging from to .
Galaxies in a group are represented by collisionless particles and their spatial distribution follows the NFW profile with , which is consistent with recent -band observational studies on galaxies distributions in groups and clusters (e.g., Lin et al. 2004). The canonical Schechter function (with slope of ) is adopted for generating a galaxy luminosity/mass function for luminosities ranging from to in a group. We assume that the mass-to-light-ratio (here mass includes dark matter) for each individual galaxy is 20 and thereby calculate the total mass according to the allocated luminosity. The total mass (thus number) of galaxies in a group with is determined by the mass-to-light-ratio, that itself is dependent on (Marinoni & Hudson 2002);
| (2) |
where is the total luminosity of galaxies in the group. Therefore, firstly for a group with mass is derived from the above equation (2) and then the total number of galaxies for the group is determined from the derived and the adopted luminosity function of galaxies. As an example, a group with has 87 galaxies. Group member galaxies in a group have an isotropic velocity dispersion just as the dark matter of the cluster does.
2.2 Spiral galaxy
The total mass and the size of the disk of a spiral galaxy with total galaxy mass (inclusive of dark matter) are and , respectively. Henceforth, all masses and lengths are measured in units of and , respectively, unless specified. Velocity and time are measured in units of = and = , respectively, where is the gravitational constant and assumed to be 1.0 in the present study. If we adopt = 6.0 and = 17.5 kpc as a fiducial value, then = 1.21 km/s and = 1.41 yr, respectively. The disk is composed of a dark matter halo, a stellar disk, a stellar bulge, and a gaseous disk. Gaseous halos that were included in our previous works (e.g., Bekki 2009) are not included in the present paper, because we do not discuss ram pressure stripping of halo gas within groups.
The mass ratio of the dark matter halo to the stellar disk in a spiral model is fixed at 9 for most models and the density distribution of the halo is represented by the NFW profile. We consider that a reasonable value of the -parameter is 7.8 (consistent with the results by Neto et al. 2007) for Milky Way-type disk galaxies with . The value of is chosen such that the rotation curve of a disk is reasonably consistent with observations: the maximum circular velocity of a Milky Way-like disk galaxy in the fiducial model is 245 km s-1.
The bulge of a spiral has a mass of , a size of and a scale-length of and is represented by the Hernquist density profile. The bulge is assumed to have isotropic velocity dispersion and the radial velocity dispersion is given according to the Jeans equation for a spherical system. The bulge-mass fraction () is a free parameter. We mainly investigate “Milky Way” models (referred to as “MW” from now on) in which and (i.e., ). In order to determine for a given and , we use the Faber-Jackson relation (, where is the total luminosity of a galaxy and is the central velocity dispersion; Faber & Jackson 1976) and the virial theorem. The “B/T ratio” is defined as , which means that it is different from . The initial and final are referred to as and , respectively.
The radial () and vertical () density profiles of the stellar disk are assumed to be proportional to with scale length = 0.2 and to with scale length = 0.04 in our units, respectively. In addition to the rotational velocity caused by the gravitational field of disk, bulge, and dark halo components, the initial radial and azimuthal velocity dispersions are assigned to the disc component according to the epicyclic theory with Toomre’s parameter = 1.5. The vertical velocity dispersion at a given radius is set to be 0.5 times as large as the radial velocity dispersion at that point, as is consistent with the observed trend of the Milky Way (e.g., Wielen 1977).
We investigate models with different and adopt Freeman’s law (Freeman 1970) to determine of a disk galaxy according to its disk mass:
| (3) |
where is a normalization constant. We consider that kpc is a reasonable value, because it is consistent with the disk structure of the Galaxy. We thus adopt kpc as a standard value for luminous disk galaxies. However, as shown in Kauffmann et al. (2003), low-luminosity disk galaxies have low surface stellar densities and thus determined by the above equation would not be so appropriate (i.e., significantly smaller than the observed). We thus adopt kpc and 9.3 kpc to model low-luminosity and low-surface-brightness galaxies. The galaxies with kpc are referred to as “high-surface-brightness galaxies (HSBs)” and those with kpc are as “low-surface-brightness galaxies (LSBs)” just for convenience. For example LSBs with have kpc for kpc. Structural and kinematical properties of dark matter halos and stellar disks are assumed to be self-similar between models with different .
2.3 Gas, star formation, and chemical evolution
Following our previous models for galactic global star formation from gas in galaxies influenced both by galaxy interactions and tidal fields of their host larger halos (Bekki & Chiba 2005) and chemical evolution and supernova feedback effects (Bekki & Shioya 1999), we model physical processes of star formation and chemical evolution as follows: The gas mass fraction () is assumed to be a free parameter ranging from 0.1 to 0.5. An isothermal equation of state is used for the gas with temperatures of K for models with and the initial temperature () of disk gas is assumed to depend on . The gas disk of a spiral is represented by SPH particles and has an exponential radial density profile that is exactly the same as the stellar disk has.
In order to construct as realistic a gas disk model as possible, we consider the radial dependence of the gas mass fraction in the initial disk. We expect that the inner gas mass fraction in the disk is smaller than the outer value owing to more rapid consumption of gas in the inner regions with higher gas density. We therefore adopt the following rule:
| (4) |
where , , , , and are the distance from the center of the disk, the gas consumption time scale, the initial gas density, the gas consumption rate, and the parameter controlling the radial dependence. Since we adopt the Schmidt law (Schmidt 1959) with exponent of 1.5 for star formation (described below), a reasonable value of is .
According to the value of at each radius derived from the above equation (4), we determine a reasonable number of stellar and gaseous particles at each radius and thereby allocate these particles to each radial bin. By assuming that the disk is composed only of gas initially, we determine through equation (4) and derive a reasonable radial distribution of gas and stars. If we adopt models with constant , then a strong initial starburst can occur in the central region of a gas-rich spiral. We therefore consider that this starburst in an isolated spiral is not reasonable and realistic. Furthermore the adopted models with radial dependence in (with no initial starbursts) enable us to clearly understand how galaxy interactions trigger starbursts within the bulges of spirals.
Star formation is modeled by converting the collisional gas particles into collisionless new stellar particles according to the algorithm of star formation described below. We adopt the Schmidt law with exponent = 1.5 (1.0 2.0, Kennicutt 1998) as the controlling parameter of the rate of star formation. The amount of gas consumed by star formation for each gas particle in each time step is given as:
| (5) |
where is the gas density around each gas particle. These stars formed from gas are called “new stars” (or “young stars”) whereas stars initially within a disk are called “old stars” throughout this paper.
Chemical enrichment through star formation and supernova feedback during the evolution of the disk is assumed to proceed both locally and instantaneously in the present study. We assign the metallicity of the original gas particle to the new stellar particle and increase the metallicity of each neighboring gas particle with the total number of neighbor gas particles equal to , according to the following equation that governs chemical enrichment:
| (6) |
where represents the increase in metallicity for each gas particle. , , , and in the above equation represent the metallicity of the new stellar particle (or that of original gas particle), the fraction of gas returned to the interstellar medium, the mass of the new star, and the chemical yield, respectively.
Since our main focus is morphological transformation of luminous spirals (like the Galaxy) into S0s, we mainly investigate chemical evolution of the MW models. For models with , the values of , , and initial metallicity are set to be 0.3 and 0.01, and 0.01 (i.e., [Fe/H]=), respectively. For comparison, we also investigate models with the initial metallicities of 0.02 (the solar abundance). We adopt the same model for supernova feedback effects (on ISM of galaxies) as used in our previous chemodynamical simulations (Bekki & Shioya 1999). In the present study, all of the energy from a supernova ( erg per a supernova) is converted into kinematic energy of gas around the supernova.
2.4 Orbits of spirals within groups
We investigate the dynamical and chemical evolution and star formation history of a spiral galaxy in a group for a given model: only one galaxy is modeled fully self-consistently by N-body particles and other galaxies orbiting the group are represented by point-mass particles with the spherical Plummer softening lengths. The orbit of our model spiral is assumed to be influenced both by the gravitational potential resulting from the dark halo component of the group and by the group member galaxies. The adopted group potential is spherically symmetric (not triaxial), and thus the initial orbital plane of the spiral is set to be the - plane (=disk plane of the spiral) in all our models. Owing to dynamical friction of the spiral against the dark matter halo of the group, the spiral can sink into the central region of the group if the total mass of the spiral is large enough.
The center of the group is always set to be (,,) = (0,0,0) whereas the initial position of the spiral is set to be (,,) = (, 0, 0). The initial velocity of the spiral (,,) is set to be (0, , 0), where and are the parameters controlling the orbital eccentricity (i.e, the larger is, the more circular the orbit becomes) and the circular velocity of the group at = , respectively. For these models, and , and thus spirals can initially orbit the centers of their host groups. These models with are referred to as “normal models”.
We also investigate “infall models” in which spirals are initially located outside the virial radius of their host groups. For these models, is larger than (and is not 0) and (i.e., is not 0 and instead ). In infall models, spirals move initially parallel to the -axis toward the negative direction and the initial value of corresponds to the impact parameter () of the orbit. For all infall models, is set to be and the impact parameter and are the two key parameter that determine the orbits within groups.
2.5 Choice of parameters
2.5.1 Fiducial model
We run models with different , , , , , , and in order to investigate the formation processes of S0s and their dependences on model parameters. The range of each model parameter is shown in the Table 1. We mainly show the results of the “fiducial model” in which = 6.0 = 17.5 kpc (i.e., kpc), (i.e., MW model), , , , and (i.e., “normal model”). This is mainly because this model shows the typical behavior of S0 formation for spirals in groups. We run a model for Gyr in order to investigate whether the spiral can be transformed into an S0 in the model.
2.5.2 Multiple gravitational softening lengths
Since we need to run models for allocated computational time for the GRAPE system composed of multiple GRAPE 7, we need to use a limited number of particles in each simulation. We run a model which requires CPU hours of the adopted GRAPE 7 system for at least Gyr evolution of a spiral in a group. If we use the same particle mass both for stellar particles in a spiral and for dark matter particles of its host group, then we need at least particles for the dark matter. Numerically, it is very costly for the present work to run models with such a large particle number, given the limited CPU time. We thus use a large mass of for the dark matter particles of a group to dramatically reduce the total particle number of the group.
Owing to this large mass, dynamical interaction between group dark matter particles and a disk galaxy can cause unrealistic dynamical heating of the stellar disk (and possible transformation from spirals into S0s), which should be avoided in the present study. We therefore adopt a large gravitational softening length () for the dark matter particles of a group to significantly suppress unrealistic tidal heating of a spiral by the dark matter particles: we use different softening lengths for the different components in the simulation (e.g., dark matter halo and disk of a spiral and dark matter halo of its host group). We confirm that galaxies with large pericenter distances of their orbits with respect to their host group’s center (thus with no/little tidal galaxy interaction) can not be transformed into S0s with thick disks: artificial tidal heating by group dark matter particles is well suppressed.
The gravitational softening lengths for the dark matter particles of a spiral, the stellar particles, and the dark matter particles of its host group are denoted as , , and , respectively. We determine for each component based on the mean particle-particle separation within the half-number radius of the spatial distribution of particle for each component. Furthermore, when two different components interact gravitationally, the mean softening length for the two components is applied for the gravitational calculation. For example, is used for gravitational interaction between stellar particles in a disk and the dark matter particles of the host group. The gravitational softening lengths for particles of the bulge, the gaseous disk, and new stars in a spiral are the same as , and for group member galaxies (represented by point-mass particles) is assumed to be the same as .
The total number of particles used in the fiducial model is 216,700 and 100,000 for a spiral and its host group, respectively, and , and are set to be 1.79 kpc 0.25 kpc, and 10.78 kpc, respectively. As described above, these softening lengths depend on (i.e., smaller for less massive disks). The total number of dark matter particles in a group is linearly proportional to : it is 500,000 for the models with . We consider that as long as we investigate galaxies with ranging from to , dynamical friction of the galaxies against the dark matter halos of their host groups can be properly investigated for such particle numbers used for groups. Also the total number of bulge particles is also linearly proportional to () so that models with larger have larger bulge particle numbers.
2.5.3 Main points of analysis
We consider that if a disk galaxy has no spiral arms (by naked-eye inspection) at the final time step of each simulation, then the simulated galaxy can be classified as an S0 galaxy. This is consistent with the canonical classification method that has been used in observational studies (e.g., Sandage 1961). We also use the smoothed two-dimensional (2D) stellar distributions of simulated galaxies to demonstrate more clearly that the simulated S0s have no spiral arms if they are projected onto the sky. The method to derived the smoothed 2D distributions is given in the Appendix A. We investigate star formation histories, the mass fractions of stripped gas and stars, maximum rotational speeds of stars (), velocity dispersions of gas and stars (), and evolution of the chemical abundances of the disks and nuclear regions. We also investigate the spatial distributions of the stripped gas and stars, which may well be identified as intragroup gas and stars.
Our particular interest is in how spirals with different Hubble-types (i.e., different ) evolve as a result of galaxy interactions in groups. The Hubble-types Sd, Sc, Sbc, Sb, and Sa (from late- to early-types in order) have , 0.10, 0.19, 0.32, and 0.70, respectively, in the present model (or , 0.09, 0.16, 0.2, and 0.41, respectively). For each model, we investigate the increase of the bulge mass () in a spiral due to galaxy interactions by estimating the total mass of new stars formed from gas within . The growth rate of a spiral bulge is measured by , where is the initial mass of the bulge. We do not adopt the same bulge-disk decomposition technique as used for estimating from the radial light profiles of S0s in observations (e.g., Laurikainen et al. 2009). This is mainly because we can not calculate the spectral energy distribution at each local region (for estimating the radial light profiles) owing to the fact that the present numerical code has not been yet combined with the stellar population synthesis codes. In our future papers, we will combine our new chemodynamical code with a stellar population synthesis one and thus be able to derive in the exactly the same manner as observations: we will discuss this important issue extensively in a forthcoming paper. In the following, in a simulation represents the time that has elapsed since the simulation started.


3 Results
3.1 Fiducial model
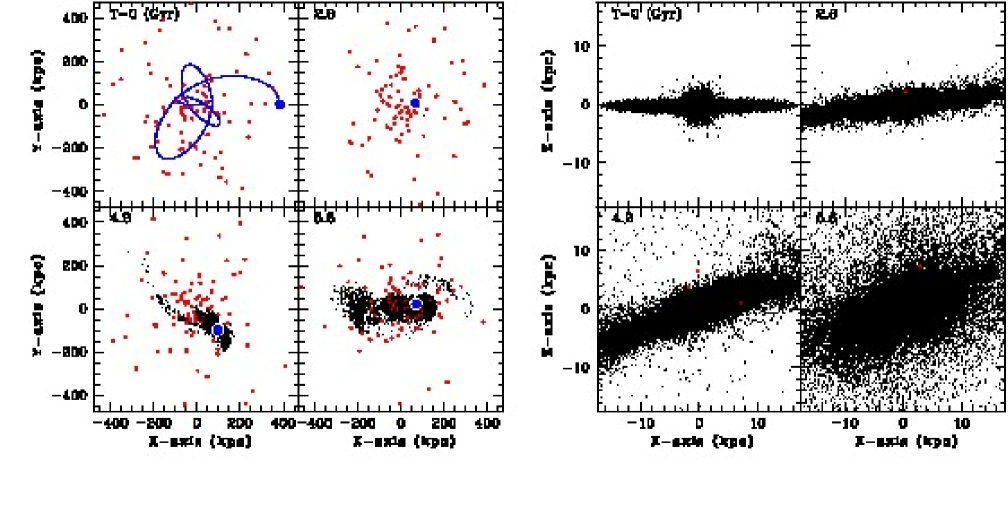
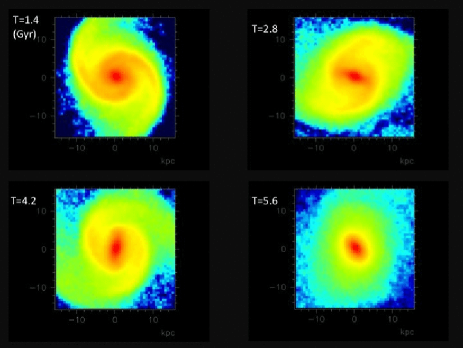
Figure 1 summarizes (i) the time evolution of the orbit and stellar distribution of a spiral in a group, and (ii) that of the distribution of group member galaxies, for the fiducial model. As the spiral approaches the pericenter of its orbit for the first time, the tidal field of the group starts to dynamically heat up the stellar disk to some extent. The tidal field of the group, however, can only influence the outer part of the stellar disk of the spiral. In the early evolution of the spiral within the group ( Gyr), it only encounters low-mass dwarf galaxies so that galaxy interactions do not dramatically influence the evolution. However, as the spiral slowly sinks into the central region due to dynamical friction, it more frequently interacts with group member galaxies due to the higher number density of the galaxies their. This sinking of the spiral can not be seen in low-mass disk galaxies owing to much less effective dynamical friction for the spirals in the group. After Gyr, the spiral experiences a number of tidal encounters with galaxies which have comparable masses (to the spiral) so that the stellar disk is strongly heated up to form a thick disk with a vertical velocity dispersion of km s-1 at kpc.
Spiral arms within the disk can gradually disappear due to the strong tidal heating during the interactions with group member galaxies. About 24% (11%) of the old stars initially in the disk can be finally located at and ( and ). This stellar component can therefore be regarded as a stellar halo around the S0 at Gyr. The edge-on view of the disk galaxy becomes strikingly similar to those of S0s at Gyr. About 11% of stars can be stripped to be located at during the morphological transformation of the spiral into an S0. These stripped stars may well be identified as intragroup stars drifting freely in the group. Thus the spiral is transformed into an S0 with a thick disk and a stellar halo as a result of the multiple tidal interactions within the group within 5.6 Gyr.
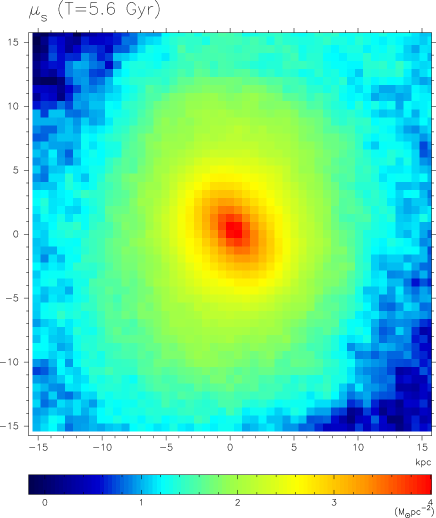
Figure 2 clearly shows that the simulated galaxy has a barred structure yet no clear spiral-arm structures of old stars in the simulated 2D image at Gyr: this galaxy can be classified as an S0 (or a barred S0). The new stars have a very compact distribution (see Figure A1 in the Appendix A), because star formation in the central region of the bulge is greatly enhanced in a repetitive manner during multiple tidal interactions with group member galaxies. About 60% of the initial gas can be rapidly consumed by star formation so that the final remnant can have a gas mass fraction of only (i.e., the formation of a gas-poor S0). The isolated model with no group tide and no galaxy interactions shows that only 20% of the initial gas can be converted into new stars after 5.6 Gyr of evolution. These results demonstrate that gas-poor S0s can be formed from multiple tidal interactions in groups. The final distribution of gas has a weak asymmetric feature (spiral-like morphology), which is due to the last tidal interaction with a massive group member galaxy.
Figure 3 shows that the spiral experiences a number of moderately strong “starbursts” (with the maximum star formation rate of yr-1) triggered mainly by tidal interactions with group member galaxies. The star formation rates in the intervals between the starbursts are also higher than the quiescent level before the spiral is influenced by the group tide ( 1 Gyr), which means that interactions with the group member galaxies can also enhance the average level of star formation. This enhancement is due largely to the significantly increased gas density in the inner region of the disk. We have run a model in which group member galaxies are not included and other model parameter values are exactly the same as the fiducial model, and confirmed that such moderately strong repetitive starbursts as shown in the fiducial model do not happen in this model (also only 35% of gas is consumed by Gyr). This means that multiple tidal encounters are responsible for the significantly enhanced level of star formation in the spiral.
Figure 4 shows that (i) the bulge of the spiral can increase more rapidly in its total mass compared to the isolated model, and (ii) the more rapid increase can be seen clearly at 2 Gyr when the spiral starts undergoing tidal interactions with group member galaxies. The final bulge mass is a factor of % larger than its original value in the fiducial model. This rapid increase in the bulge mass results from the fact that a large amount of the ISM can be transferred to the bulge region in a repetitive manner during multiple tidal interactions with group member galaxies. The bulge growth in the isolated model is due to the inner transfer of gas by dynamical action of a stellar bar in the disk (i.e., due to “secular evolution”).
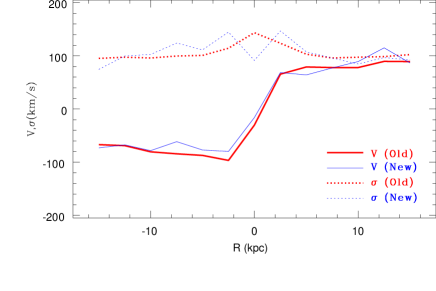
Figures 5 and 6 summarize the final stellar kinematics of the simulated S0 and the time evolution of the kinematics during the morphological transformation. The kinematical properties are derived along the major axis of the stellar distribution of the S0 projected onto the - plane and the -component velocities of stars are used for radial profiles of line-of-sight rotational velocities () and velocity dispersion (). The rotational profile of the old stars () at Gyr shows the maximum rotation () of 112 km s-1, which is significantly smaller than the original ( km s-1). This is due largely to dynamical heating of the S0 progenitor spiral by galaxy interactions with group member galaxies. The velocity dispersion profile () of the old stars is rather flat at kpc and has a peak () of 144 km s-1 (thus ).
Although the rotational profile of the new stars appears to be more disturbed, there is no/little difference in the radial profile of between old and new stars: ( km s-1) of the new stars is slightly higher than that of the old stars. The new stars have a central dip in their profile (i.e., km s-1), which is seen in most models in the present study. This smaller results from the fact that the new stars of the bulge are formed from gas after it loses a substantial amount of its kinetic energy due to gaseous dissipation (mostly by shock) during galaxy interaction. Given that the central new stars are young and metal-rich (as described later), these results mean that the younger, metal-rich populations in the S0 bulge has different kinematics from the older, metal-poor populations in the bulge.
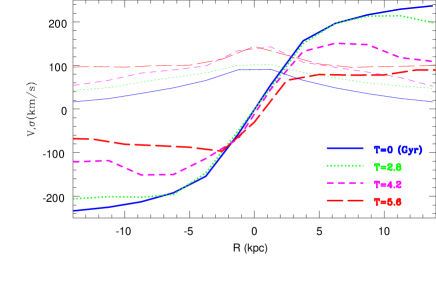
The time evolution of the and profiles demonstrates that the spiral with a high rotation amplitude () and a steep radial gradient of can be transformed into an S0 with a lower rotation amplitude () and a flat radial profile of . It is confirmed that these kinematical properties of the simulated S0 can be seen in different projections (e.g., kinematics derived from of stars in the - projection). Thus these results mean that if S0s are the remnant of violent tidal interactions in groups, then kinematical properties of S0s can be significantly different from spirals in the sense that S0s are dynamically “hotter” than spirals.
Figure 7 shows that gas fueling to the central region ( kpc) becomes more efficient after Gyr so that new stars in the central regions can be formed efficiently. The more efficient central star formation after Gyr is due to more frequent tidal interactions with group member galaxies that are as massive as the spiral. Due to the infall of metal-poor gas from the outer part of the disk, the mean metallicity of the new stars can become slightly smaller at some time steps (e.g., Gyr). However, such a slight decrease of the mean metallicity is a temporary phenomenon, and the metallicity can soon start to increase owing to chemical enrichment. Thus new stars in the bulge of the S0 have an age-metallicity relation whereby younger stars are likely to have higher metallicities.

3.2 Parameter dependences
Although transformation processes from spirals into S0s are similar between the fiducial model and other models in which S0s are formed, the details of the transformation processes depend on model parameters. Also not all of the present models with different model parameters show such morphological transformation into S0s. We illustrate here the derived dependences on the model parameters.
3.2.1 Orbit
Spirals in models with smaller (thus smaller pericenter distance and larger orbital eccentricity ) are more likely to be transformed into S0s for a given set of other parameters, because they can be more severely influenced by group tide and more frequently interact with group member galaxies in the central regions of groups. Also spirals in models with smaller can experience stronger starbursts and thus grow their bulge components to a larger extent owing to a larger amount of gas transferred to the central regions and converted into new stars there. For example, the model in which and other model parameters are the same as those in the fiducial model, does not undergo the morphological transformation from a spiral into an S0 seen in the fiducial model. Furthermore, models with smaller are more likely to be transformed into S0s for a given set of other parameters.
3.2.2 Hubble-type
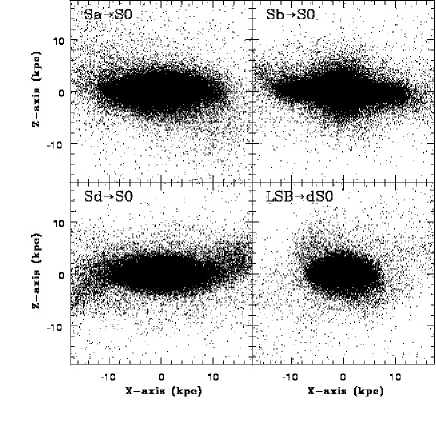
In the models with and and and 0.5, spirals with different (thus different Hubble-types) can be transformed into S0s as a result of the disappearance of their initial spiral arms. However, bigger bulges in the models with larger can severely suppress the gas transfer to the central regions of disks so that secondary starbursts are not so strong in the models. This is mainly because (i) stellar bars play a role in radial transfer of gas within disk, and (ii) the formation of strong bars during tidal interaction can be suppressed by the presence of big bulges. Figure 8 shows the edge-on views of S0s formed from spirals with different initial (i.e., Hubble-types). One of the common features of these simulated S0s are that they have thick disks and metal-rich stellar halos.
3.2.3 Gas mass fraction
Although the spiral to S0 morphological transformation processes do not depend strongly on , star formation histories are quite different between models with different for a given set of other model parameters. Due to higher star formation rates in the central regions of spirals, the bulges can grow more rapidly and to a larger extent in models with larger . For example, the model in which and other model parameters are the same as those in the fiducial model shows (in comparison with for the fiducial model). These results imply that the bulge growth rates of spirals during morphological transformation into S0s in groups depend on the gas mass fraction of the spirals when they enter into group environments.
3.2.4 LSB or HSB
In the present study, low-mass galaxies are assumed to have low mean surface stellar densities (LSBs) so that their evolution in groups can be different from the evolution of high-mass galaxies (thus HSB) described above. Irrespective of , spirals in models with smaller () are strongly influenced by both the group tide and by the galaxy interactions with group member galaxies. As a result of this, the outer parts of stellar disks in these less massive spirals are more severely disrupted and a larger fraction (%) of the old stars are tidally stripped to become intragroup stars. The remnants of this violent tidal interaction appear to be dwarf S0s (dS0). Figure 8 shows one example of this dS0 formation for the model in which and other model parameters are the same as those in the fiducial model. Such dS0s can have compact stellar structures in the central regions so that they can be classified as nucleated dS0s. Thus the present simulations show that less massive spirals are more likely to be transformed into S0s in groups.
3.2.5 Group mass
Spirals in more massive group models with are less strongly influenced by group tide and interacting galaxies in comparison with those in models with for the same () and (). As a result of this, spirals can continue their gradual star formation and keep their spiral-arm structures in the models: transformation from spirals into S0s due to tidal interactions is less likely in more massive groups for the above orbits. This is true for other massive group models with . The main reason for this is that the relative velocities of two interacting galaxies are higher in more massive group models so that galaxy interaction cannot so strongly influence the evolution of spirals. It should be stressed, however, that if spirals are initially located in the central regions () in these more massive group models, then spirals can also be rapidly transformed into S0s due to the strong group tidal field and frequent galaxy interactions there.
3.2.6 Infall model
In infall models, it depends on the impact parameter, , and whether spirals are strongly influenced by group tide and galaxy interactions so that their evolution can be significantly changed in comparison to isolated evolution. For models with , spirals cannot be influenced strongly by tidal effects in the group as long as (even for ). Infalling spirals with and can finally have very eccentric orbits within the host group so that they can be strongly influenced by the group tide and the group member galaxies when they are in the central region of the group (i.e., at their pericenter passages). Due to the longer orbital periods of infalling spirals, the timescale for them to be transformed into S0s due to galaxy interactions is longer.
3.2.7 Bulge growth rate
Figure 9 shows the dependences of on for the 20 simulated S0s in a group with for models with yet different , , and orbits. Clearly the can significantly increase in spirals with different Hubble-types (i.e., ) during their morphological transformation into S0s due to multiple galaxy interactions within the group. However, the final for spirals with cannot be close to that typically observed (; Christlein & Zabludoff 2004), which implies that typical S0s are not likely to be formed from later-type spirals (i.e., later than Sbc). Although early-type spirals can be transformed into S0s with bigger bulges, the original bulge sizes do not change during the transformation into S0s.
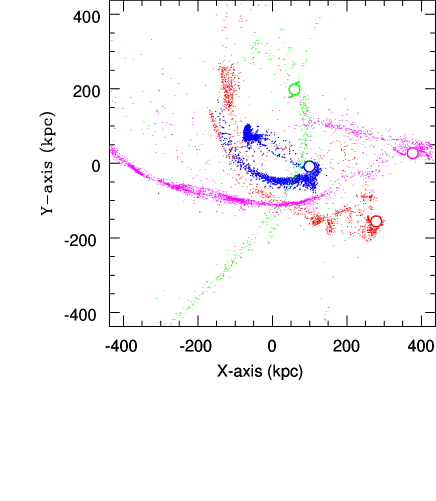
3.2.8 Formation of intragroup gas
Figure 10 summarizes the unique distributions of stripped gas from low-mass galaxies with ranging from to in a group with . These stripped gas distributions are well outside their initial disks () and are seen to be drifting freely in the intragroup space so that they would be identified as intragroup HI gas. The structure and kinematics of the intragroup gas depend strongly on the orbits of their host spirals. Apparently isolated giant HI clumps with no/little optical counter parts can be seen in some models (e.g., in the LSB model with , , , , , and ). The presence of these HI streams and isolated clouds in groups can be possible evidence for morphological transformation from spirals into S0s (as discussed later).
4 Discussion
4.1 Formation of S0s with bulge growth
One of the particularly intriguing results in recent observations on S0 evolution in groups and clusters of galaxies is that the number evolution of S0s is significantly more dramatic in groups (or poor clusters) of galaxies with 750 km s-1 at (Just et al. 2010). Other key observational properties of S0s, which should be explained by any models of S0 formation, is that the bulge fraction (defined as the ratio of the bulge to total luminosity of a galaxy) is significantly larger in S0s than in spirals (e.g., Dressler 1980; Christlein & Zabludoff 2004). These two properties are not explained so simply by the gradual transformation scenarios of S0 formation via ram pressure stripping (e.g., Abadi et al. 1999) and removal of galactic halo gas (e.g., Larson et al. 1980; Bekki et al. 2002; Bekki 2009), because such scenarios do not predict the significant increase of the mass concentrations of spiral galaxies. Previous numerical simulations of the interactions and merging between two galaxies showed that tidal interaction and merging can transfer gas from the outer parts of disks into the inner regions to grow the bulges (e.g., Noguchi 1988; Bekki 1998) and thus may well be the physical mechanism for S0 formation.
The present numerical simulations for evolution of spirals interacting with numerous group members have shown that multiple slow tidal encounters can be responsible for transformation from spirals into S0s with bulge growth. The growth rates of galactic bulges depend on the masses, initial , and orbits of the original spirals for a given group, and thus not all of spirals can become S0s with big bulge (). Although spirals with Sd morphology-type can significantly grow their bulges owing to the formation of strong bars and subsequent gas infall onto the central regions (resulting from dynamical action of bar on ISM) during tidal interaction, the final can be still smaller than the typical one for S0s. Thus S0s with large () can hardly be formed from later-type spirals with Sd, Sc, and Sbc Hubble-types via tidal interactions in groups. Other physical mechanisms that increase significantly bulge masses (e.g., minor and unequal-mass merging) are necessary for the formation of S0s with bigger bulges.
The present study has shown that less massive spirals are more likely to be transformed into S0s, because they are more likely to interact with galaxies that are larger than themselves in groups and are more susceptible to group tidal fields. This suggests that the observed rapid evolution of S0s in groups (e.g., Wilman et al. 2009; Just et al. 2010) is due to less luminous galaxies in groups. Also the present study has shown that spirals in the inner regions of groups can be more rapidly and dramatically transformed into S0s, which suggests that number evolution of S0s can be more clearly seen in the central regions of groups. Thus it would be important to investigate observationally how the number fraction of S0s depends on redshift in groups for a given mass-range and whether the dependences are different between the inner and outer regions of groups.
4.2 Origin of the Tully-Fisher relation in S0s
A number of authors have recently discussed the origin of S0s using the Tully-Fisher relation (TFR; Tully-Fisher 1977) of S0s in different environments (e.g., Hinz et al. 2003; Bedregal et al. 2006; Williams et al. 2010). Hinz et al. (2003) found (i) a larger fraction of stellar mass in S0s than in late-type spirals and (ii) a larger scatter ( mag) of the TFR in S0s than in spirals. They therefore suggested that S0s are likely to be formed from minor mergers rather than from simple truncation of star formation and subsequent disk-fading of late-type spirals. Bedregal et al. (2006) found that S0s lie systematically below the TFR for nearby spirals and have a larger scatter in the TFR than spirals and thus suggested that simple disk-fading alone cannot explain the observations so well. Williams et al. (2010) found that S0s are on average fainter in the band at a given rotational velocity and suggested that the observed offset can not be simply explained by disk-fading of spiral galaxies.
The present simulations have shown that if S0s are formed from spirals via tidal interaction in groups, then S0s can have smaller maximum rotational velocity () than their progenitor spirals owing to tidal heating of the disks. Although gas can be converted into new stars more efficiently during S0 formation via tidal interactions, some fraction (%) of old stars initially in the disks of spirals can be stripped to become intragroup stars. Therefore, it is unlikely that S0s have systematically larger disk masses in comparison with spirals. Our simulations show that the maximum circular velocities () of S0s are very similar to or only slightly lower than those of their original spirals, though of S0s are significantly lower than spirals: km s-1 for the original spiral and 235 km s-1 for the final S0 at Gyr (due to mass loss) in the fiducial model. Our simulations therefore imply that S0s formed from tidal interactions can show similar to or only slightly lower than spirals for a given luminosity a few Gyr after their formation (when the secondary starburst populations formed during S0 formation via tidal interaction have faded out). Observational results by Williams et al. (2010) do not show systematically lower in S0s for a given luminosity, though their S0s are not within groups and their values are derived from gas (not stars as done in the present simulations).
As pointed out by many authors, there could be a number of viable physical mechanisms for S0 formation (see §1 in this paper). If S0s are formed from disk-fading after truncation of star formation due to removal of galactic halo gas (e.g., Larson et al. 1980; Bekki et al. 2002), then S0s are likely to lie systematically below the TFR of spirals (e.g., Bedregal et al. 2006). If S0s are formed from spirals by tidal interaction with some fractions of original dark matter and disk stars being stripped, then S0s can show slightly lower for a given luminosity or mass owing to the mass loss during tidal interaction. Therefore, the observed large scatter in the TFR of S0s (e.g., Hinz et al. 2003; Williams et al. 2010) appears to be consistent with S0 formation via different physical mechanisms. It is currently impossible to discuss whether the TFR of S0s in groups, where galaxy interactions can be one of the major mechanisms for S0 formation, is different to that in the field and clusters due to the lack of observational data sets. Thus future observations on the TFR in different environments will enable us to discuss what mechanism(s) dominates S0 formation in the field, and in groups and clusters, based on the locations of S0s in the TFR.
4.3 Formation of intragroup cold gas
Recent observations have confirmed that nearby clusters have intracluster planetary nebulae (e.g., Arnaboldi et al. 2003; Arnaboldi 2010 for a recent review) and globular clusters (e.g. Bassino et al. 2003; Lee et al. 2010), which implies that these intracluster stellar objects originate from tidal stripping of stars and globular clusters from cluster member galaxies. Numerical simulations based on CDM models showed that such intracluster stars can be formed during the hierarchical assembly of clusters of galaxies and the simulated radial distributions of the stars are consistent with the observed ones (e.g., Murante et al. 2007). Furthermore, cosmological N-body simulations with a formation model of globular clusters demonstrated that intracluster globular clusters can be formed from tidal stripping of globular clusters initially in low-mass galaxy-scale halos (Yahagi & Bekki 2005; Bekki & Yahagi 2006). Although these observational and theoretical studies have discussed extensively the origin of intracluster stellar objects in clusters, they did not discuss the possible existence of intragroup gas.
The present study has demonstrated that if S0s are formed from gas-rich spirals via tidal interactions in groups, then there should be intragroup HI gas that can have unique distributions like very long tails, broken-rings, and apparently isolated massive clouds. Therefore it would be reasonable to claim that the presence of such intragroup HI gas is possible evidence for morphological transformation from spirals into S0s via tidal interactions. Also if S0s are forming in groups at , as suggested by recent observations (e.g., Just et al. 2010), then a larger amount of intragroup HI gas should be observed in groups at such redshifts. The present simulations also predict that tidal stripping of gas is more efficient in the outer parts of disks (where gaseous metallicities are lower owing to the negative metallicity gradients) for less massive galaxies so that the intragroup gas can be composed mostly of metal-poor gas. This metal-poor gas would finally mix with the hot gaseous halos of groups and consequently change the metallicity of the halo gas.
5 Conclusions
We have numerically investigated in detail how spirals dynamically interact with group member galaxies and group tidal fields and consequently evolve into S0s using chemodynamical simulations of galaxies. We have analyzed structural, kinematical, and chemical properties of the simulated S0s in groups for a variety of model parameters (e.g., , , and ) that can the control physical properties of galaxies (e.g., Hubble-types) and groups. We summarize our principle results as follows.
(1) Spirals can be transformed into gas-poor S0s with no remarkable spiral arms within Gyr evolution of the spirals within groups with . Multiple slow tidal encounters with group member galaxies can dynamically heat up the disks of spirals so that their initially thin disks can be transformed into thick ones during morphological transformation from spirals into S0s. Such tidal interaction can also trigger moderately strong (up to yr-1 for ) starbursts in the inner regions of their bulges so that bulges can grow significantly during S0s formation. The strong tidal fields of groups can also play a role in morphological transformation from spirals into S0s for less massive spirals.
(2) The details of the processes responsible for the morphological transformation of spirals into S0s depend strongly on galaxy masses, the orbits of spirals within groups, and the total masses of groups (). Spirals initially located in the inner regions of groups can be more rapidly converted into S0s due to the larger galaxy densities and stronger tidal fields of groups there. Less massive spirals are more likely to be transformed into S0s, because they can interact with galaxies that are significantly more massive than themselves and are susceptible to tidal fields of groups.
(3) Due to significantly enhanced star formation and efficient chemical enrichment in the inner regions of spirals during morphological transformation into S0s, the bulges of the final S0s have young and metal-rich stellar populations. The young, metal-rich stellar populations are located in the inner regions of S0 bulges and have dynamically colder (i.e., smaller ) than old stellar populations initially in the bulges. The mass fractions of younger and metal-rich populations in S0 bulges depends strongly on the initial gas mass fractions (). Less massive spirals () with small bulges can be transformed into nucleated S0s due to strong nuclear starbursts occurring during the morphological transformation process.
(4) Stellar disks of S0s formed from tidal interactions in groups have significantly flatter radial profiles of line-of-sight velocity dispersions () in comparison with original spirals, because the outer parts of the original disks (where are initially small) can be dynamically heated up more strongly. The maximum rotational velocities (, which is significantly lower than the maximum circular velocity, ) of disks can become significantly smaller during morphological transformation owing to dynamical heating by slow tidal encounters and group tidal fields. Thus, if S0s are formed from tidal interaction in groups, then they can have smaller for a given luminosity.
(5) Intragroup cold HI gas can be formed from gas stripped from spirals being transformed into S0s due to tidal interactions in groups. Such intragroup gas can have unique spatial distributions (e.g., rings and very long tails) that reflect the orbits of gas-rich spirals from which the gas originates from. Some intragroup gas clouds are far away from the galaxies they originated from so that they can be identified as apparently isolated massive HI clouds with no optical counterparts in groups. Since most intragroup gas is from the outer parts of disks in less massive spirals, the metallicity of the gas should be significantly lower. The presence of intragroup HI gas with unique spatial distributions is suggested to be possible evidence for morphological transformation from spirals into S0s due to tidal interaction in groups.
Finally, tidal interactions with group member galaxies can be just one of a number of possible physical mechanisms for the transformation of spirals into S0s. S0s with thin disks can be formed from the gradual truncation of star formation caused by halo gas stripping whereas S0s with big bulges () and with thick disks can be formed from minor and unequal-mass galaxy merging. In our forthcoming papers, we discuss the physical properties of S0s formed by these physical processes that were not explored in the present paper.
6 Acknowledgment
We are grateful to the anonymous referee for valuable comments which contribute to improve the present paper. KB and WJC acknowledge the financial support of the Australian Research Council throughout the course of this work. Numerical computations reported here were carried out both on the GRAPE system at the University of Western Australia and on those kindly made available by the Center for computational astrophysics (CfCA) of the National Astronomical Observatory of Japan.
References
- (1) Abadi, M. G., Moore, B., Bower, R. G., 1999, MNRAS, 308, 947
- (2) Andreon, S. 1998, ApJ, 501, 533
- (3) Arnaboldi, M., 2010, in “Galaxies and their masks” eds. Block, D.L., Freeman, K.C. and Puerari, I., Springer (New York), in press (arXiv:1010.1710)
- (4) Arnaboldi, M., et al., 2003, AJ, 125, 514
- (5) Bassino, L. P., Cellone, S. A., Forte, J. C., Dirsch, B., 2003, A&A, 399, 489
- (6) Bedregal, A. G., Aragón-Salamanca, A., Merrifield, M. R., 2006, MNRAS, 373, 1125
- (7) Bekki, K. 1998, ApJL, 502, 133
- (8) Bekki, K. 2009, MNRAS, 399, 2221
- (9) Bekki, K., Shioya, Y., 1999, ApJ, 513, 108
- (10) Bekki, K., Couch, W. J., Shioya, Y., 2002, ApJ, 577, 651
- (11) Bekki, K., Chiba, M., 2005, MNRAS, 356, 680
- (12) Bekki, K., Peng, E. W., 2006, MNRAS, 370, 1737
- (13) Bekki, K., Yahagi, H. 2006, MNRAS, 372, 1019
- (14) Bertola, F., Buson, L. M., Zeilinger W. W., 1992, ApJ, 401, L79
- (15) Binney, J., & Tremaine, S. 1987 in Galactic Dynamics, Princeton; Princeton Univ. Press.
- (16) Bothun, G. 1982, ApJS, 50, 39
- (17) Burstein, D., 1979, ApJ, 234, 829
- (18) Buta, R., Laurikainen, E., Salo, H., Knapen, J. H., 2010, ApJ, 721, 259
- (19) Byrd, G. Valtonen, M., 1990, ApJ, 350, 89
- (20) Christlein, D., Zabludoff, A. I., 2004, ApJ, 616, 192
- (21) Couch, W. J., Barger, A. J., Smail, I., Ellis, R. S., Sharples, R. M., 1998, ApJ, 430, 121
- (22) Desai, V., et al., 2007, ApJ, 660, 1151
- (23) Dressler, A., 1980, ApJ, 236, 351
- (24) Dressler, A., Oemler, A., Couch, W. J., Smail, I., Ellis, R. S., Barger, A., Butcher, H., Poggianti. B. M., Sharples, R. M., 1997, ApJ, 490, 577
- (25) Ellis, R. S., Smail, I., Dressler, A., Couch, W. J., Oemler, A., Butcher, H., Sharples R.M., 1997, ApJ, 483, 582
- (26) Emsellem, E., et al., 2007, MNRAS, 379, 401
- (27) Faber, S. M., Jackson, R. E., 1976, 204, 668
- (28) Farouki, R. Shapiro, S. L., 1980, ApJ, 241, 928
- (29) Fasano, G., Poggianti, B. M., Couch, W. J., Bettoni, D., Kjgaard, P., Moles, M., 2000, ApJ, 542, 673
- (30) Fisher, D., 1997, AJ, 113, 950
- (31) Fisher, D., Franx, M., Illingworth, G., 1996, ApJ, 459, 110
- (32) Freeman, K. C. 1970, ApJ, 160, 811
- (33) Geach, J. E., Smail, I., Moran, S. M., Treu, T., Ellis, R. S., 2009, ApJ, 691, 783
- (34) Gunn, J. E., Gott, J. R. III., 1972, ApJ, 176, 1
- (35) Hinz, J. L., Rieke, G. H., Caldwell, N., 2003, AJ, 126, 2622
- (36) Holden, B. P., et al., 2009, ApJ, 693, 617
- (37) Icke, V., 1985, A&A, 144, 115
- (38) Just, D. W., Zaritsky, D., Sand, D. J., Desai, V., Rudnick, G., 2010, ApJ, 711, 192
- (39) Kauffmann, G. et al. 2003, MNRAS, 341, 54
- (40) Kennicutt, R. C. 1989, ApJ, 344, 685
- (41) Kormendy, J., Illingworth, G., 1982, ApJ, 256, 460
- (42) Kuntschner, H., Davies, R. L., 1998, MNRAS, 295, L29
- (43) Larson, R. B., Tinsley, B. M., Caldwell, C. N., 1980, ApJ, 237, 692
- (44) Laurikainen, E., Salo, H., Buta, R., Knapen, J. H., 2009, ApJL, 692, 34
- (45) Lee, M. G., Park, H. S., Hwang, H. S., 2010, Sci, 328, 334
- (46) Lin, Y.-T., Mohr, J. J., Stanford, S. A., 2004, ApJ, 610, 745
- (47) Marinoni, C., Hudson, M. J., 2002, ApJ, 569, 101
- (48) Murante, G., Giovalli, M., Gerhard, O., Arnaboldi, M., Borgani, S., Dolag, K., 2007, MNRAS, 377, 2
- (49) Navarro, J. F., Frenk, C. S., White, S. D. M., 1996, ApJ, 462, 563 (NFW)
- (50) Neto, A. F., 2007, MNRAS, 381, 1450
- (51) Noguchi, M., 1988, A&A, 203, 259
- (52) Poggianti, B. M., 2009, ApJL, 697, 137
- (53) Postman, M., et al., 2005, ApJ, 623, 721
- (54) Pracy, M. B., Kuntschner, H., Couch, W. J., Blake, C., Bekki, K., Briggs, F., 2009, MNRAS, 396, 1349
- (55) Sandage, A., 1961, The Hubble atlas of galaxies, Washington: Carnegie Institution
- (56) Schmidt, M., 1959, ApJ, 344, 685
- (57) Simien, F., de Vaucouleurs, G., 1986, ApJ, 302, 564
- (58) Smith, G. P., Treu, T., Ellis, R. S., Moran, S. M., Dressler, A., 2005, ApJ, 620, 78
- (59) Stanford, S. A., Eisenhardt, P. R., Dickinson, M., 1998, ApJ, 492, 461
- (60) Sugimoto, D., Chikada, Y., Makino, J., Ito, T., Ebisuzaki, T., Umemura, M., 1990, Nat, 345, 33
- (61) Tasca, L. A., et al., 2009, A&A, 503, 379
- (62) Tully, R. B., Fisher, J. R., 1977, A&A, 54, 661
- (63) van den Bergh, S., 1976, ApJ, 206, 883
- (64) van Dokkum, P. G., Franx, M., Kelson, D. D., Illingworth, G. D., Fisher, D. Fabricant, D., 1998, ApJ, 500, 714
- (65) Vulcani, B., et al., 2010, MNRAS, in press (arXiv1010.4442)
- (66) Welch, G. A., Sage, L. J., 2003, ApJ, 584, 260
- (67) Wielen, R. 1977, A&A, 60, 263
- (68) Williams, M. J., Bureau, M., Cappellari, M., 2010, MNRAS in press (arXiv:1007:4072)
- (69) Wilman, D. J., Oemler, A., Mulchaey, J. S., McGee, S. L., Balogh, M. L., Bower, R. G., 2009, ApJ, 692, 298
- (70) Yahagi, H., Bekki, K., 2005, MNRAS, 364L, 86
Appendix A Derivation of 2D density fields
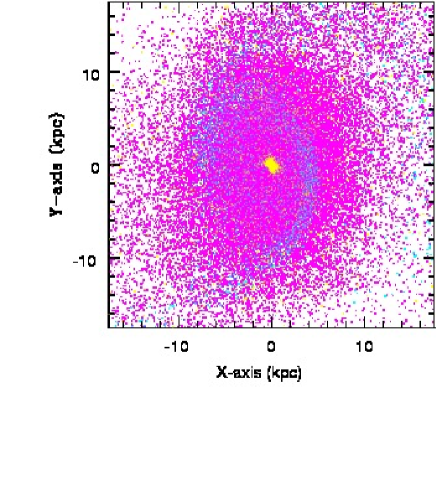
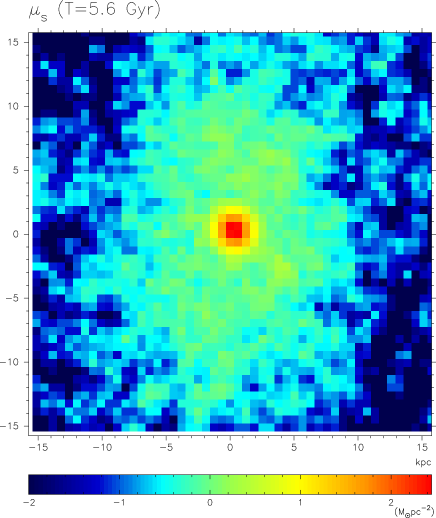
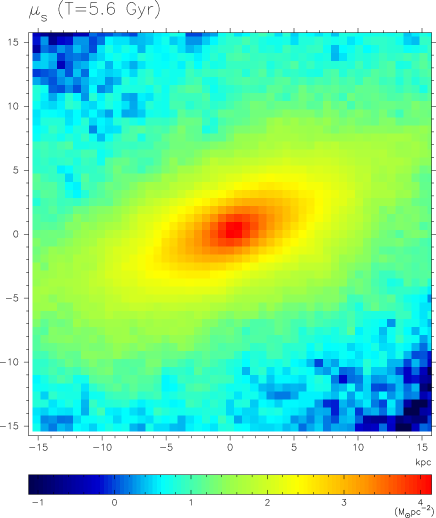
In order to compare the smoothed 2D density fields of simulated S0s with the observed images of galaxies (on the sky) in a more self-consistent manner, we adopt the smoothing method that is identical to that used for analysis of the simulated stellar distributions in the remnants of galaxy mergers (Bekki & Peng 2006). We therefore briefly summarized the adopted method in the present paper. At the position of each stellar particle, we apply a local linear smoother using a Gaussian kernel function with the smoothing length of 0.05 in our units (corresponding to 0.875 kpc). We divide the relevant region with the size of kpc (as shown in Fig. 2) into 50 50 cells for a model in each projection and estimate the local smoothed stellar density (). We estimate the 2D logarithmic density map () for galaxy in a model in order to mimic the observed image of the galaxy on the sky. Total number of cells in each projection is fixed at 2500 for all models in the present study, because this number is enough to show clearly the presence or absence of the spiral arms in the simulated disk galaxies.
Figure A1 shows the spatial distributions of old stars, gas, and new stars at Gyr in the fiducial model, which are used for creating smoothed 2D stellar distributions shown in Figure 2. Although an arm-like gaseous structure can be discernibly seen in Figure A1, stellar distributions are overall featureless so that the simulated galaxy with no spiral arms can be classified as an S0. Figure A2, which shows the smoothed 2D density profile for new stars, demonstrates that (i) the young component (formed from secondary starbursts) of the S0 has a different spatial distribution in comparison with the old one and (ii) it also has no clear spiral arm-like structures in the - projection. The central young component might well be observed as a “compact blue bulge” in observations. Figure A3 shows the smoothed stellar distribution of old stars viewed from edge-on (i.e., -) and confirms that the simulated galaxy appears to be “lenticular” like observed S0s. It is clear from this figure that the S0 has an extended stellar halo that is formed from tidal stripping of stars during tidal interaction in the group. In order to clearly show how spirals are transformed into S0s due to tidal interaction, we have produced 2D images on the time evolution of smoothed 2D stellar distributions of galaxies: Figure A4 shows an example for this in the fiducial model.
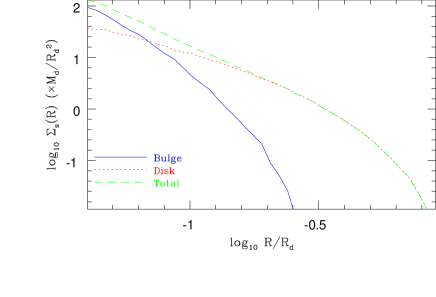
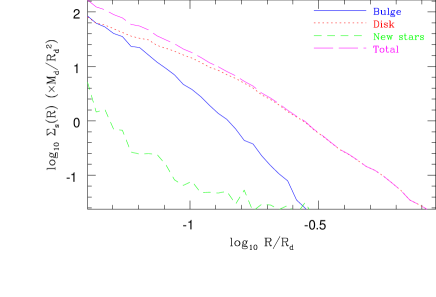
Appendix B Bulge-disk decomposition
Figure B1 shows the radial mass-density profiles separately for bulge and old stellar disk at in the original spiral galaxy for the fiducial model. This is simply a radial density profile and not a luminosity-density profile: the radial luminosity-density profile depends strongly on the age and metallicity distributions of stars in the bulge and disk components. Figure B2 shows the final radial mass-density profiles separately for the bulge, old stars, and new ones of the simulated S0 at Gyr in the fiducial model. The overall profile for the total mass-density is significantly changed between Gyr and Gyr owing to tidal stripping of stars and secondary central starbursts during morphological transformation, though the central density does not change so much. The stellar bar formed in the stellar disk during tidal interaction can interact dynamically with the original bulge so that the radial density distributions of the bulge and disk components can change during the 5.6 Gyr dynamical interaction in the group. In our future papers, we try to produce radial light profiles of the simulated S0s by combining the present chemodynamical code with the stellar population synthesis one so that we can discuss the origin of S0s in the context of the observed structural differences of stars between spirals and S0s in a fully self-consistent manner