Formation history, structure and dynamics of discs and spheroids in simulated Milky Way mass galaxies
Abstract
We study the stellar discs and spheroids in eight simulations of galaxy formation within Milky Way-mass haloes in a Cold Dark Matter cosmology. A first paper in this series concentrated on disc properties. Here, we extend this analysis to study how the formation history, structure and dynamics of discs and spheroids relate to the assembly history and structure of their haloes. We find that discs are generally young, with stars spanning a wide range in stellar age: the youngest stars define thin discs and have near-circular orbits, while the oldest stars form thicker discs which rotate times slower than the thin components, and have times larger velocity dispersions. Unlike the discs, spheroids form early and on short time-scales, and are dominated by velocity dispersion. We find great variety in their structure. The inner regions are bar- or bulge-like, while the extended outer haloes are rich in complex non-equilibrium structures such as stellar streams, shells and clumps. Our discs have very high in-situ fractions, i.e. most of their stars formed in the disc itself. Nevertheless, there is a non-negligible contribution () from satellites that are accreted on nearly coplanar orbits. The inner regions of spheroids also have relatively high in-situ fractions, but of their outer stellar population is accreted. We analyse the circular velocities, rotation velocities and velocity dispersions of our discs and spheroids, both for gas and stars, showing that the dynamical structure is complex as a result of the non-trivial interplay between cooling and SN heating.
keywords:
galaxies: formation - galaxies: evolution - galaxies: structure - cosmology: theory - methods: numerical1 Introduction
Our Milky Way is the galaxy most accessible to us, and therefore the one for which we have the most abundant and detailed data. Recently, significant information has been gathered on the dynamical and chemical properties of its stellar components: the thin and thick discs, the bulge and the stellar halo, and on-going and future surveys will provide exquisite new data, both for the Milky Way and for nearby galaxies. These observations provide important clues to understand how the stellar components in galaxies formed, and to put constraints on their assembly histories. However, a better theoretical understanding of galaxy evolution is needed to interpret observations and to separate the effects of the various underlying physical processes. For example, if radial mixing of stars in a pre-existing disc were significant (Sellwood & Binney 2002), it would be difficult to infer the birth places of stars or to decipher the metallicity distribution of the gas at the time they formed.
Furthermore, the Milky Way is a single galaxy and it is not yet clear that it is “typical” in the context of the currently accepted structure formation model (Boylan-Kolchin et al. 2010), the -Cold Dark Matter (CDM) cosmology. In order to understand galaxy formation in more detail, it is necessary to explore the diversity of galaxy properties inherent to CDM through the variety of possible formation and merger histories. Simulations of galaxy formation in its proper cosmological context have the advantage that they naturally capture important processes such as accretion and mergers, as well as reproducing the early assembly of dark matter haloes from smaller substructures. However, due to computational limitations, until recently such simulations followed one or a few haloes only (e.g. Abadi et al. 2003a,b; Brook et al. 2004; Governato et al. 2007; Scannapieco et al. 2008, among others), preventing a statistical analysis of the distributions of galaxy properties and merger histories. In recent independent projects, Brooks et al. (2009), Scannapieco et al. (2009) and Stinson et al. (2010) have been able to simulate the evolution of larger samples of haloes. This opens up the possibility of exploring a number of important galaxy properties and their evolution, as a function of the host halo’s spin, concentration and assembly history.
In particular, Scannapieco et al. (2009, S09 hereafter) analysed eight simulations of the formation of Milky Way-mass galaxies in a CDM universe, focusing on the formation of the disc components. These simulations are part of a campaign to investigate in detail the formation of galaxies such as our Milky Way, as well as to understand the diversity in galaxy properties expected in the context of CDM.
This work is a continuation of that presented in S09 and a series of companion papers. Scannapieco et al. (2010) investigated how estimates of the disc-to-total ratio vary when different techniques are used, Tissera et al. (2010) studied how galaxy assembly affects the properties of the underlying dark matter halo, and Tissera et al. (2011, in preparation) discusses the chemical properties of the gas and stellar components of the simulated galaxies. In the present paper, we further explore formation histories, structure and dynamical properties of our discs and spheroids.
This paper is organized as follows: Section 2 summarizes the main characteristics of the initial conditions, the simulation code and the simulation setup, as well as recapping previous results relevant for this work. In Section 3 we compare the formation time-scales of discs and spheroids; Sections 4 and 5 discuss the structure, in-situ fractions and dynamical properties of simulated discs and bulges; and in Section 6 we analyse circular velocity curves and gas dynamics. Finally, in Section 7 we summarize our findings and conclusions.
2 Simulations and analysis
2.1 Code and initial conditions
We use for this study the simulations already presented in S09, which follow the formation of eight Milky Way-mass haloes in a CDM universe, including dark matter and baryonic physics. Full details can be found in S09. Here we summarize the main characteristics of the code and initial conditions.
The simulations are based on the initial conditions generated for the Aquarius Project (Springel et al. 2008), adapted to include gas particles. Target haloes have been selected from a lower resolution version of the Millenium-II Simulation (MS-II; Boylan-Kolchin et al. 2009)111The MS-II simulation is an N-body cosmological simulation with billion dissipationless particles in a periodic box with a side of 137 Mpc., and required to have, at , similar mass to the Milky Way, and to be mildly isolated (no neighbour exceeding half of the halo mass within Mpc). The simulations assume a CDM cosmology with , , , and km s-1 Mpc-1. The eight simulations have similar dark matter and gas particle masses, as listed in Table 1, and similar gravitational softenings, either or kpc, which is assumed the same for gas, stars and dark matter particles.
The simulations were run with an extended version of the Tree-PM SPH code GADGET-3 (last described by Springel 2005) which includes star formation, chemical enrichment and supernova feedback (from Type II and Type Ia), metal-dependent cooling (Sutherland & Dopita 1993) and an explicit multiphase model for the gas component which allows coexistent, interpenetrating relative motion and exchange of material between a cold, dense, possibly star-forming phase and a hot diffuse phase. This model is described in detail in Scannapieco et al. (2005, 2006), and has been already used to study the formation of disc galaxies in a cosmological context (Scannapieco et al. 2008; S09; Scannapieco et al. 2010) and the formation of dwarf galaxies (Sawala et al. 2010). We note that the multiphase model and our implementation of star formation and feedback are different from the one in Springel & Hernquist (2003), although we do use their treatment for a UV background, based on the formulation of Haardt & Madau (1996). More details on the simulations, the initial conditions and the input parameters can be found in S09.
At , the simulated haloes have virial masses in the range M⊙ and are represented by about million particles within their virial radius. In Table 1, we show their main properties: virial radius () and virial mass222The virial radius is defined as the one enclosing an overdensity times the critical value. (), masses in stars and in gas (within but excluding satellite objects), cold gas masses (within , again excluding satellites), optical radius (, which encloses of the cold gas plus stellar mass), baryon fraction (within ), and spin parameter (as defined in Eq. (5) of Bullock et al. 2001) at . We also show the dark matter and (initial) gas particle masses, and the formation redshift of the haloes (see below).
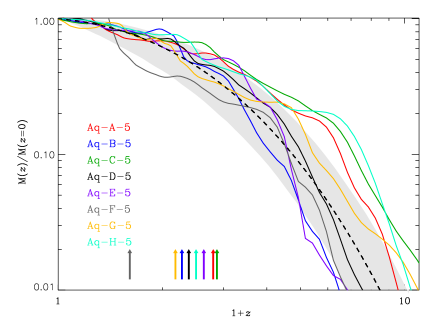
The eight resimulated haloes are representative of Milky Way-mass haloes in CDM. Their mass assembly histories spread around the median relation found for haloes formed in the MS-II (Boylan-Kolchin et al., 2010), although most of them form earlier than the median (Appendix A). In particular, Aq-A, Aq-C, and Aq-H form early, Aq-B and Aq-F form late, and the rest more or less follow the median relation. The formation redshifts for the haloes, defined as the redshift when the total mass reaches half its final value, are listed in Table 1 (see also Fig. 18). Typical formation redshifts are between and , except for Aq-F which forms very late as a result of a major merger occurring at .
| Halo | |||||||||||
|---|---|---|---|---|---|---|---|---|---|---|---|
| [kpc] | [M⊙] | [M⊙] | [M⊙] | [M⊙] | [kpc] | [M⊙] | [M⊙] | ||||
| Aq-A-5 | 232 | 14.9 | 9.0 | 4.6 | 1.51 | 17.9 | 0.09 | 0.017 | 2.6 | 0.56 | 1.9 |
| Aq-B-5 | 181 | 7.1 | 4.0 | 1.7 | 0.33 | 17.7 | 0.08 | 0.031 | 1.5 | 0.29 | 1.3 |
| Aq-C-5 | 237 | 16.1 | 10.8 | 3.6 | 1.18 | 16.0 | 0.09 | 0.012 | 2.2 | 0.41 | 1.9 |
| Aq-D-5 | 233 | 14.9 | 7.9 | 3.2 | 0.02 | 14.8 | 0.07 | 0.019 | 2.3 | 0.22 | 1.4 |
| Aq-E-5 | 206 | 10.8 | 8.4 | 2.6 | 0.44 | 10.6 | 0.10 | 0.026 | 1.8 | 0.33 | 1.6 |
| Aq-F-5 | 196 | 9.1 | 7.7 | 1.7 | 0.12 | 14.1 | 0.10 | 0.049 | 1.2 | 0.23 | 0.6 |
| Aq-G-5 | 180 | 6.8 | 4.4 | 1.53 | 0.61 | 14.1 | 0.09 | 0.048 | 1.2 | 0.23 | 1.2 |
| Aq-H-5 | 182 | 7.4 | 6.5 | 0.52 | 0.11 | 10.4 | 0.10 | 0.008 | 1.4 | 0.25 | 1.5 |
2.2 Morphologies and disc/spheroid decompositions
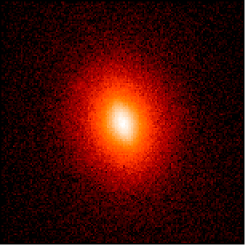
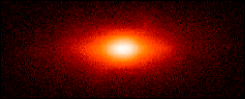
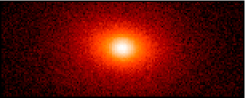
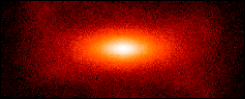
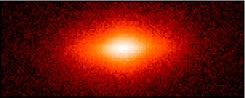
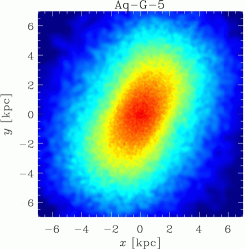
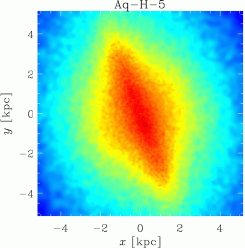
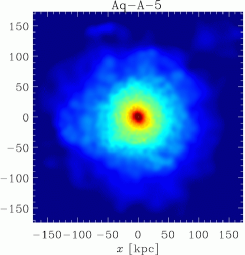
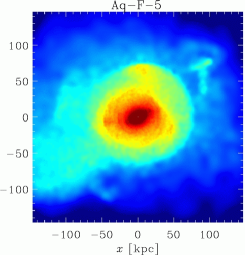
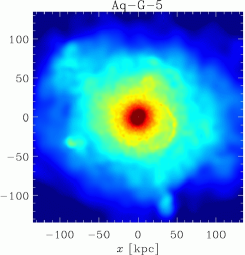
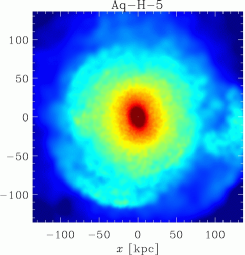
The simulated haloes host, at , galaxies with a variety of morphologies (S09). In Fig. 1, we show face-on and edge-on maps of projected stellar luminosity (in the band), for the eight simulations. In order to quantify the relative importance of the disc and spheroidal components, we use the kinematic disc/spheroid decomposition described in S09, which allows us to link each simulated star to one of these components (we refer to S09 for full details). This method is based on the kinematic of stars, and uses the parameter , where is the angular momentum of each star in the direction (i.e. the direction of the total baryonic angular momentum) and is the angular momentum corresponding to a circular orbit at the position of the star. Values of similar to unity identify stars with disc-like kinematics. These are then tagged as disc stars, while the remaining stars define the spheroidal component.
Using this decomposition technique, S09 divided simulated galaxies into two groups according to the prominence of the disc with respect to the spheroidal component: Aq-C-5, Aq-D-5, Aq-E-5 and Aq-G-5 have significant disc components; while Aq-A-5, Aq-B-5, Aq-F-5 and Aq-H-5 have very small or no discs. Aq-F-5 is the only galaxy with pure spheroid-like stellar kinematics and no sign of net stellar rotation.


An important advantage of the kinematic disc-spheroid decomposition is that the disc component does not suffer from contamination by spheroid stars (S09). However, since spheroids are defined as those stars not tagged as disc, their particles may be a superposition of distinct dynamical structures. In particular, half of the simulated galaxies have bars, which are seen not only by simple visual inspection, but also when bar/disc/bulge decompositions are applied to synthetic images (Scannapieco et al. 2010). As a result, bar particles are classified as spheroidal particles by our decomposition.
We note that, as shown in S09, the (mass-weighted) disc-to-total ratios obtained using the kinematic decomposition are of the order of , much lower than those of late-type spirals. However, when applying techniques identical to those used in observations (i.e. applying bulge/disc/bar decompositions to the 2D light distribution), the disc-to-total ratios are significantly higher, between and (Scannapieco et al. 2010). These are similar to those estimated for early-type spirals but still substantially too small to correspond to late types. Results for the disc-to-total ratios obtained with the kinematic and photometric approaches are given in Table 3.
Because spheroid stars extend all the way to the virial radius (although the vast majority are in the central regions), we will often subdivide the spheroids into “inner” () and “outer” () components ( is the radius which encloses of the baryonic galaxy mass, see Table 1). We adopt these names for two reasons. First, because the “inner” region of the spheroid cannot, in all cases, be thought as a pure bulge, since it may include a bar. Secondly, the “outer” spheroid, although it can be thought as a “stellar halo”, is not comparable to what is generally referred to as the stellar halo in the Milky Way, since it contains stars which lie well outside the solar radius (see the optical radii in Table 1). The use of the optical radius to separate the inner and outer spheroids is somewhat arbitrary; but since all properties (e.g. stellar age distributions, density profiles) vary with radius in a smooth way such arbitrariness is unavoidable. In any case, none of our conclusions is affected by this choice.
2.3 Resolution effects
In Table 2 we compare the global properties of simulated galaxies with lower resolution versions of Aq-C-5 (Aq-C-6) and Aq-E-5 (Aq-E-6 and Aq-E-6b). In Aq-C-6 and Aq-E-6, the mass resolution is a factor of lower than in their level 5 resolution counterparts, while Aq-E-6b has a times lower resolution than Aq-E-5. The Table shows the virial radii and virial masses, as well as the final gaseous and stellar masses within the virial radius.
We find very good agreement for the virial radii and virial masses in all cases. The final stellar masses show larger variations, specially for the lowest resolution simulations (Aq-C-6 and Aq-E-6), where there is up to a percent change with respect to the level 5 resolution cases. In contrast, the stellar masses of Aq-E-6b and Aq-E-5 are very similar, with a difference of the order of percent. For the gas masses we find large differences between Aq-C-6 and Aq-C-5 (), and small differences among the three Aq-E simulations (). Throughout the paper, we will use these additional simulations to investigate the effects of resolution on the properties of simulated galaxies. We shall see that differences are relatively small for the formation time-scales and structural properties of discs and spheroids, while disc dynamical properties are more strongly affected.
| Halo | ||||
|---|---|---|---|---|
| [kpc] | [M⊙] | [M⊙] | [M⊙] | |
| Aq-C-5 | 237 | 16.1 | 10.8 | 3.6 |
| Aq-C-6 | 230 | 15.1 | 6.6 | 1.2 |
| Aq-E-5 | 206 | 10.8 | 8.4 | 2.6 |
| Aq-E-6b | 206 | 10.7 | 7.4 | 2.7 |
| Aq-E-6 | 200 | 10.0 | 4.7 | 2.7 |
In order to test the effects of resolution on disc and spheroid properties, we applied our disc/spheroid decomposition technique to the low resolution simulations. As found in other simulation studies, discs become more significant as resolution is increased. We find that the disc-to-total ratios for Aq-C-6 and Aq-E-6 are lower than for Aq-C-5 and Aq-E-5. For Aq-E-6b, the D/T ratio is only smaller than in Aq-E-5 (see Table 3). We conclude that Aq-E-6b and Aq-E-5 have converged reasonably well, also in terms of the disc/spheroid prominence, while Aq-C-6 and Aq-E-6 might still be affected by resolution effects.
3 Formation time-scales of discs and spheroids
The various dynamical components of the Milky Way and external galaxies are believed to have formed in different ways and on different time-scales. In the context of CDM, where mergers are frequent with a rate that decreases with time, bulges are believed to originate during the early epochs of galaxy assembly, while discs are thought to form later during more quiescent periods, when galaxies grow by smooth accretion rather than by mergers. Small bulges may also form from bars through secular processes.
| Galaxy | D/Tkin | D/Tphot | ||||||
|---|---|---|---|---|---|---|---|---|
| Aq-A-5 | 5.7 (2.4) | 11.7 (11.7) | 11.4 (10.8) | 2.9 | 1.7 | 2.4 | 0.06 | 0.32 |
| Aq-B-5 | 4.2 (3.3) | 10.0 (9.5) | 9.8 (9.3) | 3.0 | 1.5 | 2.0 | 0.09 | 0.42 |
| Aq-C-5 | 8.8 (7.7) | 12.2 (12.2) | 11.9 (11.6) | 2.4 | 1.2 | 1.4 | 0.21 | 0.49 |
| Aq-D-5 | 8.4 (6.8) | 11.1 (10.8) | 11.3 (11.2) | 2.8 | 1.5 | 1.5 | 0.20 | 0.68 |
| Aq-E-5 | 9.0 (8.7) | 11.2 (10.6) | 11.5 (11.2) | 1.9 | 1.9 | 1.4 | 0.14 | 0.40 |
| Aq-F-5 | - | 10.8 (10.7) | 9.8 (9.2) | - | 2.1 | 2.2 | - | (0.44) |
| Aq-G-5 | 8.6 (6.5) | 11.4 (11.3) | 10.8 (10.5) | 2.8 | 1.5 | 2.2 | 0.23 | 0.60 |
| Aq-H-5 | 7.6 (6.9) | 11.9 (11.5) | 11.7 (11.2) | 2.9 | 1.3 | 1.3 | 0.04 | (0.05) |
| Aq-C-6 | 9.3 | 12.3 | 12.4 | 2.6 | 1.0 | 1.0 | 0.15 | - |
| Aq-E-6b | 9.0 | 10.7 | 11.2 | 2.3 | 2.6 | 2.0 | 0.15 | - |
| Aq-E-6 | 10.8 | 11.0 | 11.7 | 1.7 | 2.4 | 1.7 | 0.10 | - |
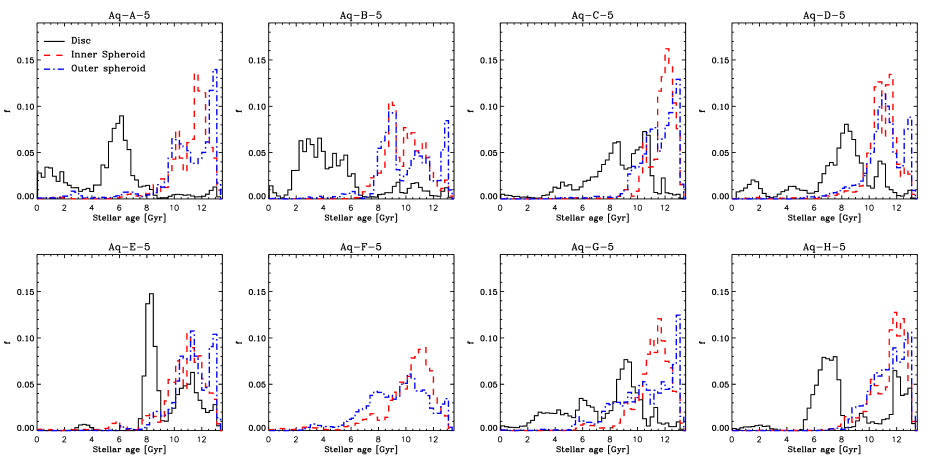
Here we study the typical ages and formation time-scales of the discs, inner and outer spheroids defined in section 2.2. Histograms of stellar ages for these components are shown in Fig. 2. As expected, we find that discs are systematically younger than spheroids, and their typical formation time-scales span several Gyrs. On the other hand, both the inner and outer spheroids show relatively narrow age distributions; in all simulations the spheroidal components form very early and on very short time-scales. Moreover, we detect no systematic difference between inner and outer spheroids, in terms of their stellar ages. Interestingly, we find that, in the case of the discs, the stellar age distributions are in some cases better described by a combination of two or more populations of different ages – this might be indicative of two different components, such as a thick and a thin disc (see the next section).
In Table 3 we show, for the discs and the inner/outer spheroids, the “ages” defined by the median of the corresponding distributions. Typical ages are in the range [-] Gyr for spheroids and [-] Gyr for discs. In Table 3, we also show the values of the standard deviation of the corresponding stellar age distributions, which can be taken as an estimate of the spread in formation times. As is evident from Fig. 2, discs form over larger time-scales, with values between and Gyr. In contrast, the formation time-scales of spheroids are small, typically in the range [] Gyr. Comparing the time-scales for inner and outer spheroids, we find that the latter have systematically longer formation time spreads. As we shall see later, outer spheroids have low in-situ fractions which may explain their broader stellar age distributions.
Finally, we compare the ages obtained for our discs and spheroids with observational results for the discs and bulges of spiral galaxies. To this end, we calculate luminosity-weighted mean ages (SDSS -band) for our simulated discs, inner and outer spheroids, using the Bruzual & Charlot (2003) population synthesis models (for a Salpeter initial mass function (IMF), as assumed in the simulations). Results are listed in Table 3, in parentheses. These luminosity-weighted estimates do not differ significantly from the mass-weighted ones for the inner and outer spheroids but, in the case of the discs, they can be significantly lower than the mass-weighted ones, due to the younger stars. The mean ages of our discs and spheroids are in relatively good agreement with observational results. Typical mean ages of discs and bulges are [] Gyr and Gyr, respectively (MacArthur et al. 2004, 2009). However, we note that observational estimates can vary significantly depending on the assumed star formation histories and the modelling of dust. In addition, mean ages are found to depend on Hubble type, such that earlier-type, faster-rotating and more luminous galaxies are older (MacArthur et al. 2004).
The results found for our level 5 simulations are recovered in the lower resolution runs. Discs are in all cases younger than spheroids, and we detect no significant differences in the ages of inner and outer spheroids. The mean ages for disc, inner spheroids and outer spheroids converge very well (see Table 3), with differences of the order of with respect to the higher resolution simulations (except for Aq-C-6, where differences reach ). Larger differences are detected for the time-scales, ranging from to .
3.1 Disc mass and disc age
As discussed above, the ages of simulated discs are in relatively good agreement with observational results. However, observations reveal a great variety of disc-bulge systems and the estimation of their ages still suffers from large uncertainties. As a result, the scatter in disc and bulge ages obtained observationally is large, and ages cover almost the whole possible range between 2 Gyr and the Hubble time. Theoretically, it is however expected that discs grow significantly at low redshifts, because they are easily disrupted and they have higher survival probability if they form late, during more quiescent evolutionary periods.
In this context, our simulated discs are perhaps older than expected – or, alternatively, not massive enough, while bulges are too massive. As shown in Table 3, the disc-to-total ratios are of the order of (kinematically-defined) or (photometrically-defined). Recent estimations for the mass of the bulge and the disc of our Milky Way are M⊙ and M⊙, respectively (Sofue, Honma & Omodaka 2009). This translates into a disc-to-total mass ratio of (ignoring the mass in the stellar halo which anyway contributes very little to the total mass). In simulations, the formation of overly massive bulges and less massive discs might be due to a number of causes that have been already discussed in the literature: inappropriate modelling of the involved physical processes (e.g. Piontek & Steinmetz 2010; Agertz, Teyssier & Moore 2010), insufficient resolution (e.g. Governato et al. 2007), or even a failure in the cosmological model (e.g. Sommer-Larsen & Dolgov 2001; Mayer, Governato & Kaufmann 2008). In particular, Agertz et al. (2010) claim that the inability to form massive discs is due to the adoption of strong feedback combined with high star formation efficiencies. Note however that although their simulations produce massive discs, they convert baryons into stars with an overall efficiency which is much too high to be consistent with a CDM cosmology (e.g. Guo et al. 2010).

In models where supernova feedback is the main regulating mechanism of star formation, the early formation of very massive bulges may be responsible of the inability to form massive discs later on. This is because feedback at high redshift drives a wind from the inner regions where star formation is taking place, leaving less gas available for late star formation. This occurs in our model, and is illustrated in Fig. 3: the stellar masses (dotted-dashed lines) grow rapidly at early times, leaving little cold gas (dotted lines) at late times. Most of the gas (gas masses are typically times lower than the stellar masses) is hot (dashed lines), and forms gaseous haloes with typical temperatures of K. Much gas is also expelled from our haloes, as reflected in the baryon fractions we find, which are in the range and , substantially smaller than the cosmic baryon fraction assumed (Table 1).
Finally, another possible reason for the generally low SFRs at low redshifts is that our model does not include the effects of gas return from low- and intermediate-mass stars (Tinsley 1974). The gas return fraction of a stellar population of given age over the Hubble time can be as high as , depending on the IMF and, less strongly, on the metallicity (Jungwiert, Combes & Palouš 2001). This gas can in principle be added to the disc and form new stars. Thus, up to about half of the stellar mass forming at redshift may be returned in the form of gas by and be available to make new disc stars (Martig & Bournaud 2009). However, if gas return comes from stars in the bulge, this effect cannot build extended discs, since such stars have low angular momentum.
4 The discs
4.1 Structure
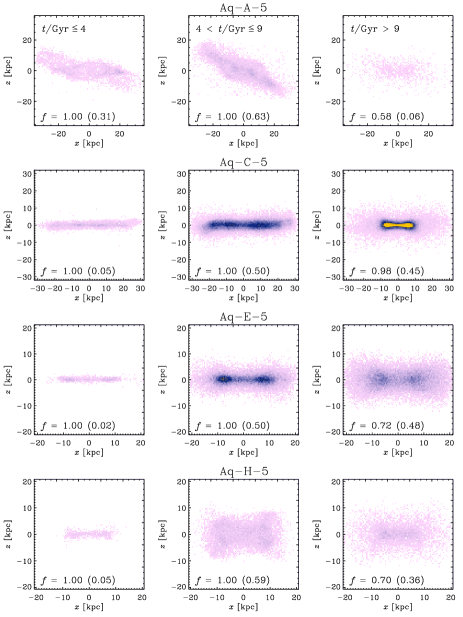
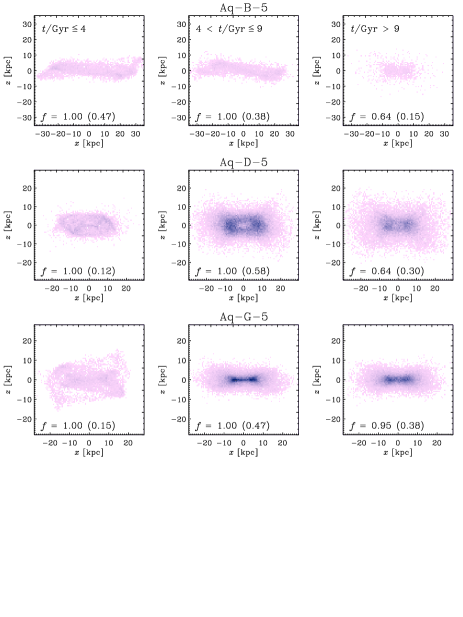
As already shown in Fig. 1, our eight simulated galaxies have a variety of morphologies and, in particular, their discs show a great variety of shapes and masses. Moreover, the distributions of disc stellar ages (Fig. 2) are in general characterized by a superposition of bursts of different age. In order to investigate in more detail the structure of discs at , we show in Fig. 4 the distribution of disc particles, in an edge-on view (note that Aq-F-5 has no disc), up to twice the corresponding optical radius. We plot separately stars formed in three different age bins333For simplicity, we adopt the same age bins for all galaxies, although the valleys in SFR are slightly different in each case. Using individual age bins for the different galaxies, more consistent with their particular distributions, does not alter our results in any significant way.: , and . The plots are color-coded according to the surface mass density at each point; covering 4 orders of magnitude ( M⊙kpc-2).
The diversity of discs is evident: we find not only very thin discs (Aq-C-5, Aq-E-5), but also a variety of shapes: “boxy” or “X”-shaped discs (Aq-D-5, Aq-G-5, Aq-H-5), warps (Aq-B-5), and a case where two misaligned discs of different age are present (Aq-A-5). This diversity arises naturally in the context of CDM due to the different formation, merger and accretion histories of galaxies.
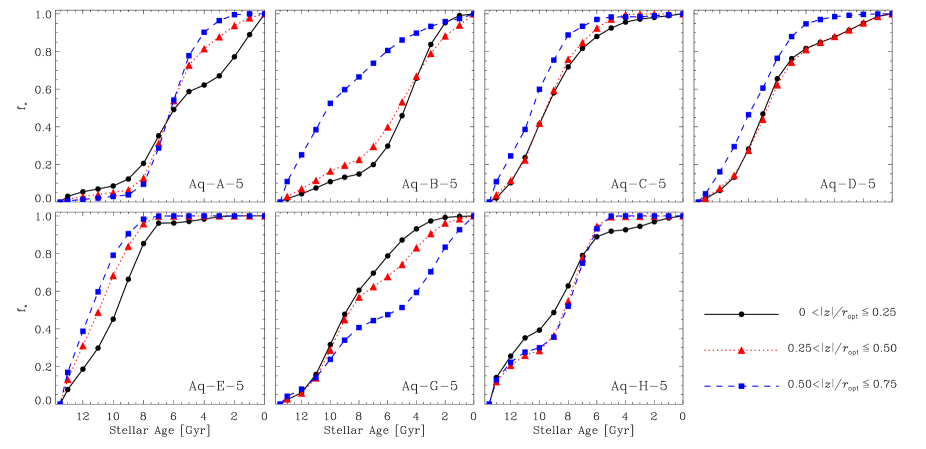
From Fig. 4 we can also observe that stars in the youngest age bin (left-hand panels) tend to define thinner discs than older populations. In Fig. 5 we show the cumulative fraction of stellar mass formed as a function of stellar age for stars located in three different bins of (absolute value of) height above the disc plane: , and times the corresponding optical radius. In general, we find that stars in the lower bins, i.e. closer to the disc plane, are younger than stars at larger vertical distances. This behaviour is more clear in those galaxies with significant disc components (Aq-C-5, Aq-D-5, Aq-E-5). Aq-G-5 has also an important disc component, but we detect the opposite trend: further above the disc plane we find younger stars. It is interesting to note that this galaxy has a strong bar and mixing might play an important role in the distribution of young stars.
Galaxies with less prominent discs also show a trend of younger stars being closer to the disc plane, however, the behaviour is more diverse. In Aq-A-5 and Aq-H-5, the dependence of vertical extent on stellar age is not monotonic. On the contrary, in Aq-B-5 we detect a very well defined relation between stellar age and thickness. We also note that in Aq-A-5 the results might be influenced by the fact that the young stars define a second stellar disc, misaligned with the older disc component. The projection we adopt is such that the older disc is contained in the plane, while the younger disc is not. In fact, if projected with respect to the latter, the young disc appears very thin.
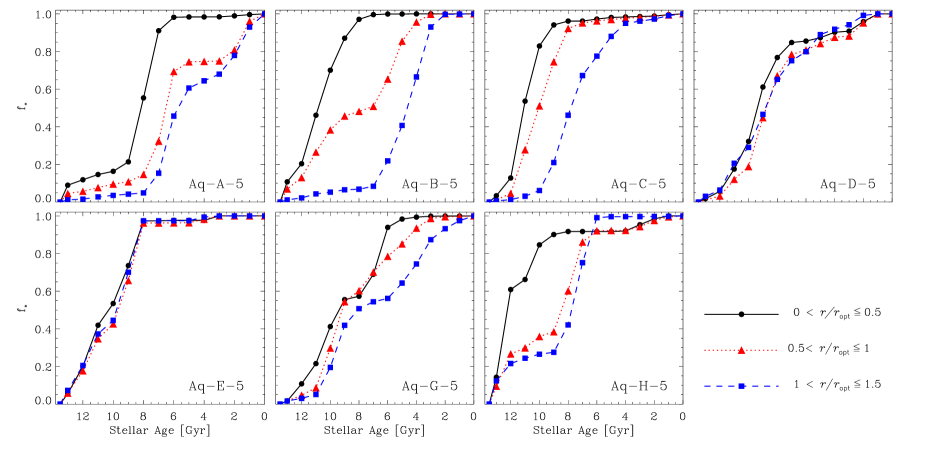
Furthermore, we find that the youngest stars define more extended discs. In Fig. 6 we show the cumulative fraction of stellar mass as a function of stellar age, now for disc stars in three different radial bins according to their present-day positions: , and . The behaviour of the cumulative stellar mass fraction demonstrates an inside-out disc formation pattern for most simulated discs. While the innermost regions are populated with stars older than Gyr, disc stars in the outermost regions are significantly younger. There are two cases, Aq-D-5 and Aq-E-5, for which we detect no significant difference between the three radial bins.
Our findings clearly show that discs in our simulations have preferentially formed from the inside-out. This is reminiscent of recent observational results, which also show evidence for inside-out disc formation in M33 (Barker et al. 2007; Williams et al. 2009) and in local HI-rich galaxies (Wang et al. 2010). Finally, we note that, as already shown in S09 and Scannapieco et al. (2010), simulated discs have half-mass radii that are consistent with observational results (Table 5).
The results presented thus far evidently show that simulated discs are better described by a combination of two (or perhaps more) components, reminiscent of thin and thick discs. We shall see later that these two components also have different dynamical properties. Assuming that we can divide disc stars into thin and thick components depending on their age (we use Gyr and Gyr, respectively), we can estimate the relative masses of the simulated thin and thick discs. We adopt this criterion because it is easy to apply to simulated stars, and follows the observation that, in our Milky Way, the bulk of stars in the thick disc are older than Gyr while the thin disc has a low contribution of stars older than Gyr (Norström et al. 04; Bensby et al. 2007). Using this definition, we find that thick discs contribute between and to the total disc mass (as can be inferred from the mass fractions shown in parentheses in Fig. 4). These results are in relatively good agreement with observational results: in our Milky Way, the contribution of the thick component to the total disc mass is found to be (Jurić et al. 2008), while for thick discs in external galaxies values of the order of are found (Yoachim & Dalcanton 2006), depending on the galaxy stellar mass. As emphasized by these authors, thick discs of external galaxies are very diverse.
The results discussed in this section change little in our lower resolution simulations. We again find that disc populations with different stellar ages have distinct properties, and the trends with stellar age found in the level 5 simulations are recovered. However, we note that the youngest disc components are poorly resolved in the low resolution simulations. In particular, the number of stars younger than Gyr is significantly () smaller, and it is thus not possible to estimate reliably the properties of the youngest subcomponents. However, we find that the relative fraction of disc stars in the different age bins is very similar, suggesting that resolution does not strongly affect our results.
| Galaxy | |||
|---|---|---|---|
| Aq-A-5 | 0.98 | 0.93 | 0.35 |
| Aq-B-5 | 0.95 | 0.85 | 0.19 |
| Aq-C-5 | 0.99 | 0.90 | 0.22 |
| Aq-D-5 | 0.89 | 0.87 | 0.22 |
| Aq-E-5 | 0.86 | 0.73 | 0.28 |
| Aq-F-5 | - | 0.54 | 0.14 |
| Aq-G-5 | 0.98 | 0.78 | 0.31 |
| Aq-H-5 | 0.88 | 0.79 | 0.15 |
| Aq-C-6 | 0.94 | 0.91 | 0.13 |
| Aq-E-6b | 0.90 | 0.74 | 0.31 |
| Aq-E-6 | 0.75 | 0.76 | 0.27 |
4.2 In-situ fractions


In order to investigate the formation sites of the stars that end up in each stellar component, we calculated the in-situ fractions () defined as the fraction of stellar mass that was formed in the main progenitor of the final galaxy. These can be calculated separately for the different components: the disc, and the inner and outer spheroids. For the discs we also estimate separately for the three stellar age bins defined above. We start this calculation at (at higher redshift the main progenitor can be ill-defined), and assume that older stars formed in systems other than the main progenitor. We checked that only a small fraction (less than percent) of the stellar mass is formed before for all simulations, and thus our results are not affected by this choice. Note that stars that are not formed within the main progenitor are thus “accreted” stars (formed in systems other than the main progenitor); consequently, the fraction of accreted stars is given by .
Labels at the bottom of the various panels of Fig. 4 show the in-situ fractions for discs in each age bin, as well as the the fraction of disc stellar mass in that age bin (quantities in parenthesis). We find that all disc stars younger than Gyr formed in-situ, and that even the oldest disc stars (representing between and of the total disc mass) have relatively high in-situ fractions. The overall in-situ fractions for simulated discs are shown in Table 4. The in-situ fractions for discs are for all simulated galaxies. We note that although the bulk of disc stars are formed in-situ, a non-negligible fraction of stars () can be contributed by disrupted satellites that come in on nearly coplanar orbits, as is the case for Aq-E-5, but in general these bring relatively old stars to the final disc. This latter result is very similar to that obtained by Abadi et al. (2003b), who also found that debris from disrupted satellites can be found in thin/thick disc components.


We find very good agreement of the overall in-situ fractions for discs in Aq-C-6 and Aq-E-6b compared to Aq-C-5 and Aq-E-5, with changes of and , respectively (Table 4). In the case of Aq-E-6, the disc in-situ fraction is lower than in Aq-E-5. (Note that the disc/spheroid decomposition can also introduce some differences since, as explained in S09, Aq-E has a rotating bulge and the decomposition is difficult.) The in-situ fractions for stars of given age (in particular for the three stellar age bins used above) show small differences with varying resolution. The largest differences () are found for the oldest stellar populations. For stars younger than Gyr, we recover the result from the level 5 simulations: all such stars formed in-situ.
4.3 Dynamical properties
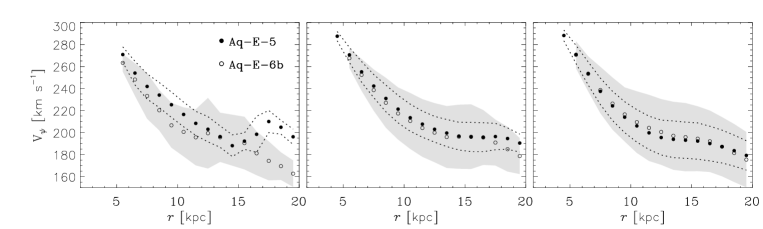
The motion of stars in the simulated discs are dominated by the tangential velocity component. In Fig. 7 we show the mean tangential velocity as a function of radius (filled circles), as well as , where is the dispersion in in the corresponding radial bin. For each simulation, we divided stars in the three age bins we used to analyse the disc structure. Young stars ( Gyr) usually have higher tangential velocities than older stars, particularly at large radii, and lower tangential velocity dispersions444We note that the separation at Gyr of the two youngest stellar age bins is not in all cases separating two different populations, as it can be inferred from Fig. 2.. The tangential velocity decreases with increasing radius, but the decrease for old stars is stronger than for young stars: the difference in between inner and outer regions is km s-1 for the former ( km s-1 for of the galaxies) and km s-1 for the latter ( km s-1 for of the galaxies).
Typical values for the tangential velocity dispersions are km s-1 for disc stars younger than Gyr, for stars with and for stars older than Gyr. These results are consistent with discs having more than a single stellar population: older stars populate discs that are thicker, with lower tangential velocities and higher velocity dispersions, while younger stars populate thinner discs that rotate faster and have lower tangential velocity dispersions. These results are also consistent with our previous findings on the in-situ fractions: while young disc stars were almost entirely formed in-situ, the oldest component has a higher contribution of accreted stars. Thus, it is expected that these have higher velocity dispersions.


Old and young disc stars also show differences in their vertical velocity structure, as shown in Fig. 8. The figure shows the mean tangential velocity of disc stars as a function of (the absolute value of) height over the disc plane (filled circles) for the three stellar age bins. The dotted lines are at indicating the tangential velocity dispersion. For the young stars, the tangential velocity is more or less constant or decreases steadily, as a function of height over the disc plane. Older stars show a more pronounced decrease of with height over the disc plane, with changes of the order or lower than 30 km s-1. Aq-C-5, Aq-E-5 and Aq-G-5 (three of the four galaxies with more prominent discs) show the largest gradients in tangential velocity, both for old and for young stars. In contrast, Aq-A-5, Aq-B-5, Aq-D-5 and Aq-H-5 (except for the youngest stars) tend to have constant tangential velocity as a function of height over the disc plane. Note that in Aq-D-5 the tangential velocity shows a slight increase with height over the disc plane for the young stars. In this galaxy, even the youngest stars define a relatively thick disc (Fig. 4).
We find that the radial and vertical components of the velocity dispersion in discs are larger than the tangential ones. Radial velocity dispersions are km s-1 (with the exception of Aq-A-5 which has km s-1) for the oldest stars and km s-1 for the youngest ones; and vertical velocity dispersions vary from km s-1 to km s-1 from the older to the younger populations. The total velocity dispersions for simulated discs are between and km s-1 for the oldest stars and in the range km s-1 for stars in the youngest age bin.
The results of this section show that the oldest stars define thick discs which rotate times slower and have times larger (total) velocity dispersions than the young, thinner disc components. These results are, in broad terms, consistent with results for the thin and thick discs of the Milky Way (assuming that our separation of thin and thick discs in terms of stellar age is approximately correct). In our Galaxy, thick disc stars are lagging with respect to the thin disc by km s-1 (Gilmore, Wyse & Norris 2002), with km s-1 usually taken as a canonical value (see also Vallenari et al. 2006). On the other hand, in external galaxies the difference in rotation velocity of thin and thick discs appears to be diverse and strongly dependent on galaxy mass, with lower mass galaxies having larger differences between thin and thick velocities (Yoachim & Dalcanton 2008).
In terms of velocity dispersions, our results are in relatively good agreement with the observations of the Milky Way. Vallenari et al. (2006) estimated the velocity dispersion ellipsoid of the thin and thick discs of our Galaxy. Their results for the thick disc are: km s-1 at the solar radius. For the thin disc, they estimate the velocity ellipsoid dividing stars into four stellar age bins, finding (with errors ). As described above, the eight simulated galaxies are diverse and show a wide range in velocity dispersions that agree relatively well with these results (although we note that simulated galaxies are not expected to resemble the Milky Way in detail).
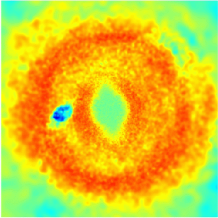
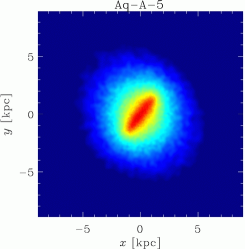
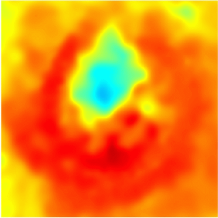
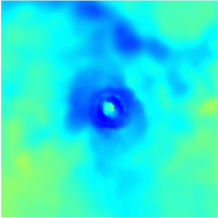
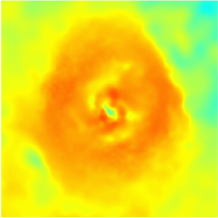
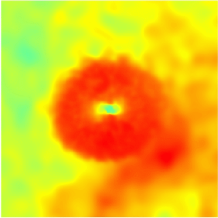
Finally, we note that the velocity structure of the simulated stellar components is complex, in general having important asymmetries. Fig. 9 shows 2D face-on maps of tangential velocity for the eight simulations (including both disc and spheroid stars) within the inner kpc. From these plots we can read off the velocity structure of simulated galaxies, the sizes of bulges and discs, and we can also observe bar patterns, particularly in Aq-C-5, Aq-E-5 and Aq-G-5 (see also the next section). Aq-A-5, Aq-C-5, Aq-D-5 and Aq-E-5 have the largest tangential velocities, as expected since these are the most massive galaxies and therefore have higher circular velocities. In the case of Aq-B-5, the disc starts to dominate at a relatively large radius, showing a ring-like structure. As we discuss below, the absence of a disc in Aq-F-5 is evident from this figure, and also the small disc component of Aq-H-5.
We find that the dynamical structure of discs found for our simulations is also present in the lower resolution runs. In all cases, the older stars define thicker discs compared to the younger populations. In particular, Aq-E-5 and Aq-E-6b show very good agreement, as shown in Fig. 10. In this case, differences in tangential velocities and velocity dispersions are always lower than . For the youngest stars (left-hand panel), tangential velocities are lower for Aq-E-6b than for Aq-E-5. Velocity dispersion are, regardless of stellar age, larger for the lower resolution run. We detect more significant differences for Aq-C-6 and Aq-E-6 with respect to Aq-C-5 and Aq-E-5 respectively. In these cases, the tangential velocities are typically lower in the low resolution runs, while velocity dispersions are larger. These results show that low resolution runs can artificially boost the degree of disc heating.
5 The spheroids
5.1 Structure
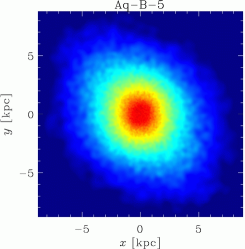
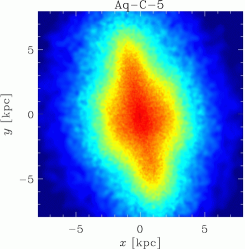
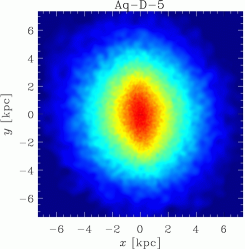
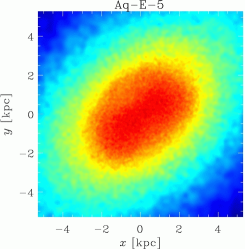
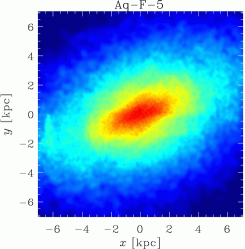
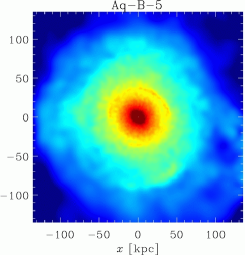
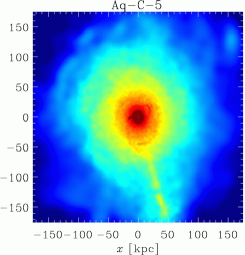
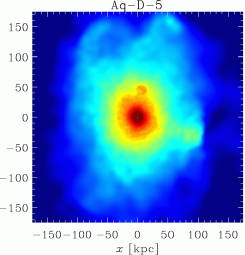
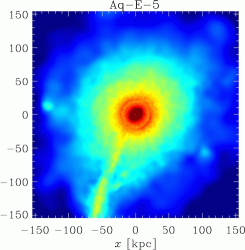
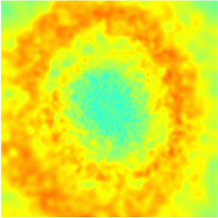
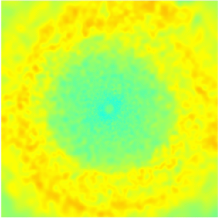
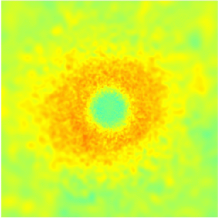
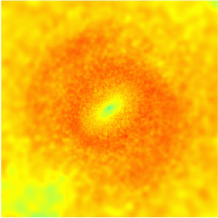
In this section, we discuss the structure of the inner and outer spheroids of our simulated galaxies. In Figs. 11 and 12, we show maps of surface mass density for inner spheroids (up to ) and outer spheroids (up to ), respectively. The plots are color-coded according to the logarithm of the projected surface mass density, covering orders of magnitude and starting at the maximum density corresponding to each simulation. The most striking features of the inner spheroids are the presence of bars (also evident in the velocity distributions, as we discuss below), and the diversity in shape: in some cases they are almost axisymmetric, in others strongly ellipsoidal. Our outer spheroids are highly asymmetric and rich in structure, in particular, in the outermost regions, where there are stellar “streams” and clumps. Note that these are not gravitationally self-bound systems, and they have no dark matter halo associated with them, since satellites with dark matter haloes have already been removed from the analysis. Aq-F-5 shows the most complex and perturbed stellar distribution, due to its recent major merger.
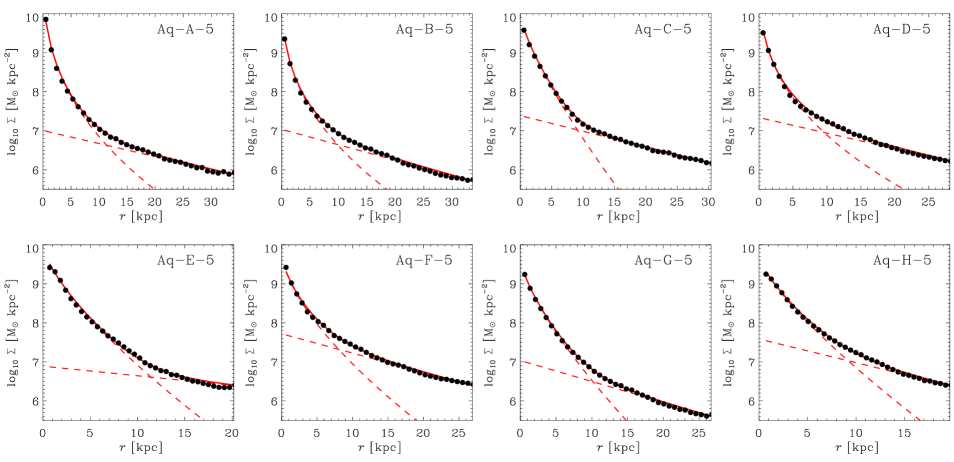
In order to investigate the distribution of stars in the spheroidal components in more detail, we constructed profiles of surface mass density (using equally-spaced bins in ) for all simulations, as shown in Fig. 13. We used stellar mass and not luminosity, but since these are old populations, very similar results are found in the two cases. The profiles were fitted using a combination of Sérsic and exponential profiles for the inner and outer regions, respectively, such that their sum gives the total surface mass density, namely:
| (1) |
The first term of the right-hand side in this equation is equivalent to the standard Sérsic law, i.e.,
| (2) |
but has the advantage that it can be expressed in terms of effective quantities usually quoted in observational studies (e.g. MacArthur et al. 2003). We did additional tests replacing the exponential law used for the outer regions by either a power law or a Sérsic profile, but we found that, in general, the fits were poorer.
In order to properly model the break at which the transition between the exponential and the Sérsic law takes place, which is clearly different for the eight simulations, we repeated the fits changing the break radius and estimated the goodness of the fit using the parameter , defined by:
| (3) |
where is the number of data points. By minimizing we selected the best-fit parameters, which we show in Table 5. Furthermore, for each simulation we have repeated the fits twice, considering the profiles either to or times the corresponding optical radii, and found almost no difference in the best-fit parameters (in all cases lower than a few percent)555The fits have also been repeated for the whole radial extent of the outer spheroids, but were then poorer. Moreover, since the fraction of stellar mass decreases rapidly with increasing radius, the best-fit model does not differ strongly with that obtained using the distributions only up to . Finally, we note that the density profiles in the outer regions for the eight galaxies are diverse, and show signs of streams and clumps, making a fit almost meaningless.. In Fig. 13 we show the best-fit model (solid line) as well as the relative contributions of the Sérsic and exponential laws (dashed lines).
The inner spheroids (“bulges” if bars were absent) are characterized by central surface mass densities between and M⊙ kpc-2, and effective radii in the range kpc. In terms of their shapes, the Sérsic parameters are typically around , i.e., similar to exponential profiles. Aq-A-5 and Aq-B-5 have the highest parameters, a reflection of their very concentrated profiles; on the contrary, Aq-H-5 has the lowest value indicating a shallower profile in the central regions. The outer regions of the spheroids have much lower central surface densities, with M⊙ kpc-2, and scale-lengths of the order of kpc. We find a wide range of relative contributions of the inner and outer components to the total spheroid mass, as can be clearly seen in Fig. 13. We note that, in the cases where bars are present, the profiles should perhaps include an additional component. This might explain the (small) differences between the results here and those presented in Scannapieco et al. (2010)666Another difference between the technique used here and that used in Scannapieco et al. (2010) is that the former uses the 1D (mass) density profiles while the latter considers the 2D (luminosity-weighted) images.. However, we do not find larger values for galaxies with bars, suggesting that the number of fitting parameters is large enough to fit the 1D profiles of Fig. 13, even if bars are not included as an extra component.
| Galaxy | log10() | log10() | |||||
|---|---|---|---|---|---|---|---|
| Aq-A-5 | 21.2 | 9.1 | 1.5 | 2.5 | 7.1 | 12.1 | 0.008 |
| Aq-B-5 | 24.0 | 8.6 | 1.8 | 2.7 | 7.1 | 10.6 | 0.012 |
| Aq-C-5 | 12.2 | 8.9 | 2.3 | 1.2 | 7.4 | 10.3 | 0.003 |
| Aq-D-5 | 11.0 | 8.8 | 1.9 | 2.5 | 7.4 | 10.3 | 0.009 |
| Aq-E-5 | 12.9 | 8.8 | 2.5 | 1.2 | 7.1 | 12.3 | 0.016 |
| Aq-F-5 | - | 8.5 | 2.8 | 1.7 | 7.5 | 10.5 | 0.006 |
| Aq-G-5 | 10.8 | 8.6 | 2.2 | 1.5 | 7.0 | 8.1 | 0.008 |
| Aq-H-5 | 10.6 | 8.6 | 2.6 | 1.3 | 7.6 | 6.9 | 0.005 |
| Aq-C-6 | 8.2 | 8.6 | 2.6 | 1.0 | 7.3 | 8.9 | 0.012 |
| Aq-E-6b | 12.0 | 8.7 | 2.7 | 1.2 | 7.0 | 11.2 | 0.010 |
| Aq-E-6 | 12.9 | 8.2 | 3.8 | 0.9 | 7.3 | 7.4 | 0.016 |
The structural properties of the inner and outer spheroids show very good agreement with the results for simulations with lower resolution (Table 5). We find that all the fitting parameters change by less than , with the exception of Aq-E-6 where larger differences () are found for the effective radius, shape parameter and outer spheroid scale-lengths.
5.2 In-situ fractions
The in-situ fractions for inner and outer spheroids are shown in Table 4. For inner spheroids we find, as we did for discs, that the majority of stars which end up in this component formed in the galaxy’s main progenitor. In-situ fractions for inner spheroids are, in all cases, larger than , with the exception of Aq-F-5 — due to its recent major merger which brings a significant amount of new stars into the system. Conversely, for outer spheroids we find lower in-situ fractions, in the range . This translates into a high contribution of accreted stars; in general, of outer spheroid stars formed in satellites that later fall into the potential well of the main progenitor and disrupt. Our results clearly show that “stellar haloes” are more likely formed by a combination of both in-situ and accreted stars. Furthermore, the in-situ fractions of outer spheroids show a clear anti-correlation with radius, as shown in Fig. 14. Our results are in good agreement with those of Zolotov et al. (2009), who detect an anticorrelation between in-situ fraction and radius for stellar haloes, and also a wide range of stellar halo in-situ fractions, which arise due to the variety of merger histories of their simulated galaxies.

The in-situ fractions for the inner spheroidal components in the three lower resolution simulations are in excellent agreement with their higher resolution counterparts, with differences smaller than (Table 4). For outer spheroids, the differences are larger, in particular for Aq-C-6 which has a lower in-situ fraction compared to Aq-C-5. For Aq-E-6b and Aq-E-6, differences are smaller ( and respectively) with respect to Aq-E-5. Note that outer spheroids are expected to be more strongly affected than the inner components, due to poorer resolution in the low mass satellites which contribute many of their stars.
5.3 Dynamical properties
The dynamical structure of simulated inner spheroids can be read from Fig. 9, where we show the face-on 2D distribution of mean tangential velocities (note that all stars, including disc and spheroidal components, are shown in these maps). The relative contribution and size of bulges and bars can be clearly seen in these plots: Aq-A-5 has an asymmetric velocity distribution even in the very central regions; Aq-B-5 has an extended bulge with a smooth transition in velocity increasing towards the disc region; Aq-C-5 has a more extended disc and the bulge (the region where no significant tangential velocity is detected) is relatively small; Aq-D-5 has a spherical bulge with a rapid transition to the disc region; Aq-E-5 shows signs of rotation from the very inner regions and its velocity structure is also rather asymmetric; Aq-F-5, the only galaxy with no disc component, has very low tangential velocities regardless of distance to the centre; Aq-G-5 has no clear indication of a significant bulge (but it has a strong bar, see below); and Aq-H-5 has an asymmetric velocity structure with low rotation (this is also one of the less massive galaxies). Furthermore, the presence of bars is clear in Aq-C-5, Aq-E-5 and Aq-G-5. In this latter case, the bar seems to dominate the inner regions, and there is no clear indication of a significant true bulge. A more detailed study in terms of the dynamical properties of stars, and also through the use of bulge/disc/bar decompositions (Scannapieco et al. 2010) shows that Aq-A-5 also has an important bar component (see also Fig. 11).
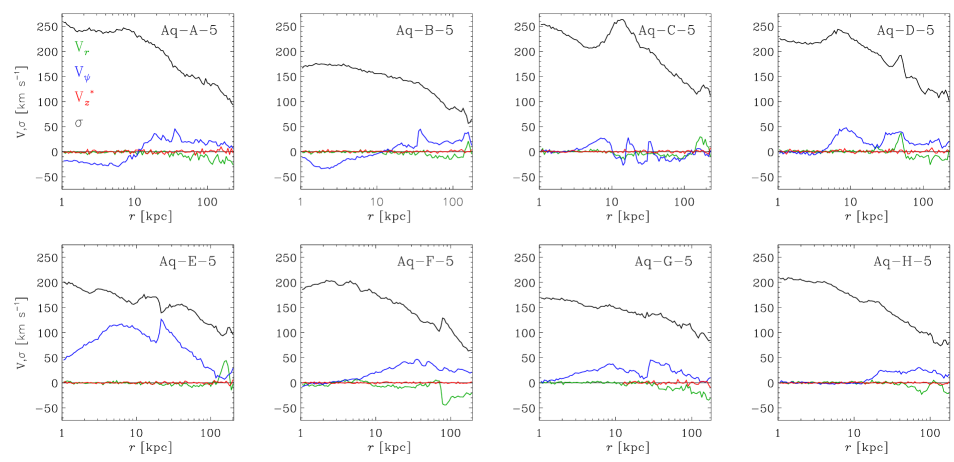
In Fig. 15 we show the profiles of radial, tangential and vertical velocities for spheroid stars, as well as the corresponding total velocity dispersions. For the vertical velocities, we use , in order to distinguish between inflows () and outflows (). The radial and vertical velocity components are very small in all simulations. In some cases, there are signs of non-zero but small radial velocities in the outermost regions, but these are not significant, specially taking into account that the amount of stellar mass in these regions is very small. We do find non-zero tangential velocities, with a great variety of patterns: Aq-A-5 and Aq-B-5 are counter-rotating in the inner parts and co-rotating in the outer regions (always in relation to the overall rotation of the disc); the spheroidal component of Aq-E-5 has a net rotation (S09); the other galaxies show signs of co-rotation, mainly outside the inner regions. The total velocity dispersions decline with radius, varying typically from km s-1 in the inner regions to km s-1 near the virial radius.

The dynamical properties of the inner and outer spheroids in our lower resolution simulations are in good agreement with their higher resolution counterparts, and span the same ranges in the three components of the velocity and of the velocity dispersion.
6 Circular velocity curves and gas dynamics
Fig. 16 shows the total circular velocities, as a function of radius for our eight simulations (solid lines). All simulations have similar circular velocity curves, reaching maximum at small radii, and declining smoothly at larger distances. The characteristics of the circular velocity profiles are determined by the mass distributions and relative mass contributions of the stellar, gaseous and dark matter components. In this way, the shape of the circular velocity curves in the inner regions is dominated by the stellar spheroids, which are massive and centrally concentrated (Fig. 13). The circular velocities for the stellar components are, in all cases, strongly peaked at kpc, as indicated by the triple dotted-dashed lines. At larger radii, the stellar mass grows only modestly, and the stellar circular velocities decline.


At kpc, the total circular velocities start being dominated by the dark matter. The dark matter components exhibit flat circular velocity curves, as indicated by the dashed lines in Fig. 16. However, due to the non-negligible contribution of the stellar component, the total circular velocity curves are not completely flat in the outer regions. The differences between the peak circular velocity and the velocity at kpc are of the order of to and are larger than in most observed galaxies. This is a common problem in cosmological galaxy formation simulations, but in our case it is not very severe.
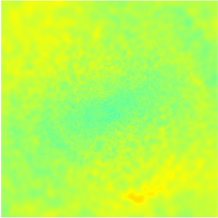
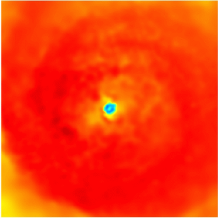
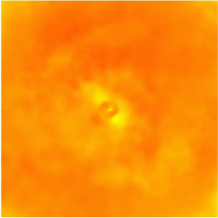
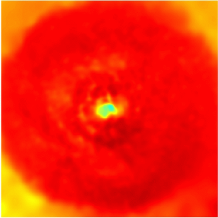
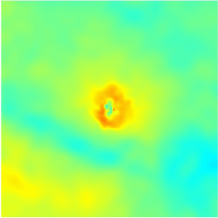
In the case of the gas components (dotted-dashed lines), we find very low circular velocities, indicative of the small amount of left over cold gas in the central regions (Fig. 3, see also Table 1). The circular velocities are a proxy for the mass, rather than real velocities. From Figs. 3 and 16, it is clear that the gas contributes very little to the total circular velocity; however, the gas is, in most cases, on nearly circular orbits in the disc plane. This can be seen from the open circles in Fig. 16, which represent the mean gas velocity as a function of radius for the different simulations (we have done this calculation after doing an extra projection, in order to get the rotation plane of the gas which is not always the same as that of the stellar discs). The mean gas velocities are relatively high, but their structure is complex, due to the non trivial interplay between cooling and heating by SN feedback. This complexity can also be observed in Fig. 17, where we show the mean tangential velocities for the gas, in a 2D view (with the galaxies face-on). The velocity distributions usually present strong asymmetries and, in some cases such as Aq-E-5, the mean tangential velocities are negative, indicating that the gas disc is counter-rotating with respect to the stellar disc. This results from significant late accretion of gas with misaligned angular momentum (see S09). As for the stars, we detect little rotation in the gas component of Aq-F-5, the galaxy with a recent major merger.
The circular velocity curves are similar for varying resolution, although the inner parts show differences that reflect those found for the total stellar masses in each simulation (Table 2). In particular, Aq-C-6 has a lower peak velocity and a lower velocity at kpc compared to Aq-C-5; and in Aq-E-6b (Aq-E-6) the peak velocities and velocities at kpc are () and () lower than those found for Aq-E-5.
7 Conclusions
We have continued our study of the properties of discs and spheroids in eight simulations of galaxy formation in a CDM cosmology. The simulations correspond to haloes with present day virial masses in the range M⊙ and spin parameters between and . We use a kinematic decomposition to separate discs from spheroids. Four of the eight galaxies have significant discs, three have small discs, and one is a pure spheroid. None could represent a late-type spiral. We compared the formation histories, in-situ fractions, structure and dynamical properties within and between galaxies, subdividing also by age and by radius. Our main results are summarized below.
Formation time-scales. We found significant differences between the formation histories and time-scales of discs and spheroids. Spheroids are formed early and on short time-scales, while discs are younger and have broad age distributions, often with a number of different bursts. Typical (mass-weighted) ages for spheroids and discs are Gyr and [] Gyr, respectively. Because spheroids are old, we detect no difference in their mass- and luminosity-weighted ages. On the contrary, luminosity-weighted ages for discs are [] Gyr, significantly smaller than the mass-weighted estimates. The mean ages of our simulated discs and spheroids are in good agreement with observational results.
Thin and thick discs. We find clear signs of the presence of more than one component in our simulated discs, reminiscent of observed thin and thick discs. The youngest stars define thin structures, with high tangential velocities and low velocity dispersions, whereas the oldest disc stars define thicker discs, with lower rotational velocities and higher velocity dispersions. Assuming that thin and thick disc components can be distinguished by the age of their stars (we adopted Gyr as the boundary), we determined typical rotation velocities and velocity dispersions for thick/thin simulated discs. These agree reasonably well with observations of the Milky Way. We note, however, that our simulations cover a range of galaxy masses and halo properties, and therefore of typical rotation velocities and velocity dispersions.
Structure of discs, bulges and bars. As expected in the context of the CDM cosmology assumed in this work, the stellar components of our eight simulations show great variety in their structure. Discs have a wide range of thicknesses and scale-lengths, and are usually complex, with misaligned components or boxy shape. The inner regions of spheroids also show great diversity: half of the simulated galaxies have bar components, which can dominate over the bulges. Sérsic fits to the mass density profiles generally give shape parameters , i.e. they are similar to exponential. As found in other studies, outer spheroids or “stellar haloes” are very rich in structure, with streams, clumps and shells, similar to observational results (Martínez-Delgado et al. 2010). In broad terms, the sizes and structure of our bulges and discs agree well with observational results, although our bulges are too massive with respect to discs.
In-situ fractions. These are useful to investigate the dominant formation channels for the different stellar components. We find that discs have the highest in-situ fractions, typically , and all disc stars younger than Gyr formed in the disc itself. In one of the simulated galaxies, however, of the final disc mass is contributed by a satellite that came in on a nearly coplanar orbit. These stars are generally old but are able to stay in the disc. Inner spheroids (i.e. bulges and bars) also have relatively high in-situ fractions, generally larger than , and consequently a low contribution from accreted stars formed in systems other than the main progenitor. Conversely, outer spheroids have a large contribution from accreted stars and low in-situ fractions, in the range . As expected, the lowest in-situ values are detected for systems with recent massive mergers. Our results suggest that the outer regions of galaxies are populated by a combination of in-situ and accreted stars, with the relative fraction reflecting the particular formation and accretion history of the host. We also find a negative dependence of in-situ fraction on radius, the outermost regions of simulated galaxies are almost entirely populated by accreted stars. These results are in good agreement with other studies (e.g. Zolotov et al. 2009; Cooper et al. 2010).
Dynamical properties. We find complex and highly asymmetric dynamical structures for the stellar and gaseous components of our simulated galaxies. They reflect not only the diversity of our discs, bulges and bars, but also the non-trivial interplay between cooling and heating mechanisms. Circular velocity curves are relatively flat for kpc, and have peak velocities which are to higher than the value at larger radii.
We tested the effects of resolution by comparing the results of our simulations to several additional simulations of and times lower mass resolution. We find relatively good agreement for the formation time-scales, structure and in-situ fractions of discs and spheroids. The dynamical properties show more significant variation with resolution, in particular for the discs. We find that in simulations of higher resolution the discs tend to have higher tangential velocities and lower velocity dispersions. These results indicate that low resolution runs suffer from artificial disc heating. However, the trends found for the velocities and velocity dispersions with age are still captured in the low resolution runs.
In broad terms, our simulations agree with previous studies, and also show similar deficiencies, the most important one being the presence of overly dominant bulges. It is still under debate whether these deficiencies are due to insufficient resolution, or are a consequence of a poor description of the gas hydrodynamics or the star formation and feedback processes. On the other hand, the persistent failure to reproduce late-type galaxies in a cosmological context in typical galactic haloes may indicate that additional physical processes, not yet considered in simulations, play a role in the regulation of star formation in galaxies. Our understanding of important processes related to galaxy formation – from the formation of stars to the effects of supernova and black hole feedback – is still quite rudimentary, so it is remarkable that cosmological simulations nevertheless produce galaxies with structural and dynamical properties in reasonable agreement with observational results.
Acknowledgments
We thank the referee for a thorough reading of this work and for his/her helpful comments and suggestions. The simulations were carried out at the Computing Centre of the Max-Planck-Society in Garching. This research was supported by the DFG cluster of excellence ‘Origin and Structure of the Universe’. CS thanks M. Boylan-Kolchin for providing the data for Fig. 18, Lauren MacArthur for her help in the interpretation of observational results, and M. Steinmetz, M. Vlajic, J. Wang and M. Williams for useful and stimulating discussions.
References
- [1] Abadi M.G., Navarro J.F., Steinmetz M., Eke V.R., 2003a, ApJ, 591, 499
- [2] Abadi M.G., Navarro J.F., Steinmetz M., Eke V.R., 2003b, ApJ, 597, 21
- [3] Agertz O., Teyssier R., Moore B., 2010, MNRAS, 410, 1391
- [4] Barker M.K., Sarajedini A., Geisler D., Harding P., Schommer R., 2007, ApJ, 133, 1125
- [5] Bensby T., Zenn A.R., Oey M.S., Feltzing S., 2007, ApJ, 663, 13
- [6] Boylan-Kolchin M., Springel V., White S.D.M., Jenkins A., Lemson G., 2009, MNRAS, 398, 1150
- [7] Boylan-Kolchin M., Springel V., White S.D.M., Jenkins A., 2010, MNRAS, 406, 896
- [8] Brook C.B., Kawata D., Gibson B.K., Flynn C., 2004, MNRAS, 349, 52
- [9] Brooks A.M., Governato F., Quinn T., Brook C.B., Wadsley J., 2009, ApJ, 694, 396
- [10] Bruzual G., Charlot S., 2003, MNRAS, 344, 1000
- [11] Bullock J.S., Dekel A., Kolatt T.S., Kravtsov A.V., Klypin A.A., Porciani C., Primack J.R., 2001, ApJ, 555, 240
- [12] Ceverino D., Klypin A., 2009, ApJ, 695, 292
- [13] Cooper A.P., et al., 2010, MNRAS, 406, 744
- [14] Gilmore G., Wyse R.F.G., Norris J.E., 2002, ApJ, 574, 39
- [15] Governato F., et al., 2004, ApJ, 607, 688
- [16] Governato F., Willman B., Mayer L., Brooks A., Stinson G., Valenzuela O., Wadsley J., Quinn T., 2007, MNRAS, 374, 1479
- [17] Governato F., et al. 2009, MNRAS, 398, 312
- [18] Guo Q., White S.D.M., Li C., Boylan-Kolchin M., 2010, MNRAS, 404, 1111
- [19] Haardt F., Madau P., 1996, ApJ, 461, 20
- [20] Jungwiert B., Combes F., Palouš J., 2001, A&A, 376, 85
- [21] Jurić M., et al., 2008, ApJ, 673, 864
- [22] MacArthur L.A., Courteau S., Holtzman J.A., 2003, ApJ, 582, 689
- [23] MacArthur L.A., Courteau S., Bell E., Holtzman J.A., 2004, ApJS, 152, 175
- [24] MacArthur L.A., Gonz lez J.J., Courteau S., 2009, MNRAS, 395, 28
- [25] Martig M., Bournaud F., 2010, ApJ, 714, 275
- [26] Martínez-Delgado D., et al., 2010, AJ, 140, 962
- [27] Mayer L., Governato F., Kaufmann T., 2008, Advanced Science Letters, 1, 7
- [28] Navarro J.F., Benz W., 1991, ApJ, 380, 320
- [29] Norström B., et al., 2004, A&A, 418, 989
- [30] Okamoto T., Eke V.R., Frenk C.S., Jenkins A., 2005, MNRAS, 363, 1299
- [31] Piontek F., Steinmetz M., 2010, MNRAS, 410, 2625
- [32] Robertson B., Yoshida N., Springel V., Hernquist L., 2004, ApJ, 606, 32
- [33] Sánchez-Blázquez P., Courty S., Gibson .K, Brook C.B., 2009, MNRAS, 398, 591
- [34] Sawala T., Scannapieco C., Maio U., White S.D.M., 2010, MNRAS, 402, 1599
- [35] Scannapieco C., Gadotti D.A., Jonsson P., White S.D.M., MNRAS, 407, 41
- [36] Scannapieco C., Tissera P.B., White S.D.M., Springel V., 2005, MNRAS, 364, 552
- [37] Scannapieco C., Tissera P.B., White S.D.M., Springel V., 2006, MNRAS, 371, 1125
- [38] Scannapieco C., Tissera P.B., White S.D.M., Springel V., 2008, MNRAS, 389, 1137
- [39] Scannapieco C., White S.D.M., Springel V., Tissera P.B., 2009, MNRAS, 396, 696 (S09)
- [40] Sellwood J.A., Binney J.J., 200, MNRAS, 336, 785
- [41] Sofue Y., Honma M., Omodaka T., 2009, PASJ, 61, 227
- [42] Sommer-Larsen J., Dolgov A., 2001, ApJ, 551, 608
- [Springel & Hernquist 2003] Springel V., Hernquist L., 2003, MNRAS, 339, 289
- [43] Springel V., 2005, MNRAS, 364, 1105
- [44] Springel V., et al., 2008, MNRAS, 391, 1685
- [45] Stinson G, Bailin J., Couchman H., Wadsley J., Shen S., Brook C.B., Quinn T., 2010, MNRAS, 408, 812
- [46] Sutherland R.S., Dopita M.A., 1993, ApJS, 88, 253
- [47] Tinsley B. M., 1974, ApJ, 192, 629
- [48] Tissera P.B., White S.D.M., Pedrosa S., Scannapieco C., 2010, MNRAS, 406, 922
- [49] Vallenari A., Pasetto S., Bertelli G., Chiosi E., Spagna A., Lattanzi M., 2006, A&A, 451, 125
- [50] Wang J., et al., 2010, MNRAS, 412, 1081
- [51] Williams B.F., Dalcanton J.J., Dolphin A.E., Holtzman J., Sarajedini A., 2009, ApJ, 695, 15
- [52] Yoachim P., Dalcanton J.J., 2006, AJ, 131, 226
- [53] Zolotov A., Willman B., Brooks A.M., Governato F., Brook C.B., Hogg D.W., Quinn T., Stinson G., 2009, ApJ, 702, 1058
Appendix A Mass assembly histories
Fig. 18 shows the mass assembly history of our eight simulated haloes, where accounts for all mass within the virial radius, and is normalized to its present-day value. The median mass assembly history of Milky Way-mass haloes from the MS-II Simulation is also shown, as given by Boylan-Kolchin et al. (2010). Clearly, the mass assembly histories of our eight haloes are a representative sample of Milky Way-mass haloes formed in a CDM universe, although most of them form earlier than the median relation. Our plot is similar to that shown by Boylan-Kolchin et al. (2010), but we include the two additional haloes analysed in this paper.