Hubble and Spitzer Space Telescope Observations of
the Debris Disk around the Nearby K Dwarf HD 9294511affiliation:
Based in part on guaranteed observing time awarded by the National Aeronautics and Space Administration (NASA) to the Advanced
Camera for Surveys Investigation Definition Team and the Multiband Imaging Photometer for Spitzer Instrument Team.
Abstract
We present the first resolved images of the debris disk around the nearby K dwarf HD 92945, obtained with the Hubble Space Telescope’s Advanced Camera for Surveys. Our F606W (Broad ) and F814W (Broad ) coronagraphic images reveal an inclined, axisymmetric disk consisting of an inner ring about 20–30 (43–65 AU) from the star and an extended outer disk whose surface brightness declines slowly with increasing radius approximately 30–51 (65–110 AU) from the star. A precipitous drop in the surface brightness beyond 110 AU suggests that the outer disk is truncated at that distance. The radial surface-density profile is peaked at both the inner ring and the outer edge of the disk. The dust in the outer disk scatters neutrally but isotropically, and it has a low -band albedo of 0.1. This combination of axisymmetry, ringed and extended morphology, and isotropic neutral scattering is unique among the 16 debris disks currently resolved in scattered light. We also present new infrared photometry and spectra of HD 92945 obtained with the Spitzer Space Telescope’s Multiband Imaging Photometer and InfraRed Spectrograph. These data reveal no infrared excess from the disk shortward of 30 µm and constrain the width of the 70 µm source to AU. Assuming that the dust comprises compact grains of astronomical silicate with a surface-density profile described by our scattered-light model of the disk, we successfully model the 24–350 µm emission with a minimum grain size of µm and a size distribution proportional to throughout the disk, but with maximum grain sizes of 900 µm in the inner ring and 50 µm in the outer disk. Together, our HST and Spitzer observations indicate a total dust mass of . However, our observations provide contradictory evidence of the dust’s physical characteristics: its neutral – color and lack of 24 µm emission imply grains larger than a few microns, but its isotropic scattering and low albedo suggest a large population of submicron-sized grains. If grains smaller than a few microns are absent, then stellar radiation pressure may be the cause only if the dust is composed of highly absorptive materials like graphite. The dynamical causes of the sharply edged inner ring and outer disk are unclear, but recent models of dust creation and transport in the presence of migrating planets support the notion that the disk indicates an advanced state of planet formation around HD 92945.
1 Introduction
A circumstellar disk is called a “debris disk” if the age of its host star exceeds the lifetimes of its constituent dust grains. Intergrain collisions, radiation pressure, and Poynting–Robertson drag eliminate dust around solar-type stars in Myr (Backman & Paresce, 1993; Lagrange et al., 2000); (Zuckerman, 2001; Meyer et al., 2007; Wyatt, 2008). The presence of dust around older stars suggests that the dust has been replenished by cometary evaporation or by collisions among unseen planetesimals. Resolved images of debris disks enable studies of the properties and dynamics of grains that compose the debris in extrasolar planetary systems. They also provide opportunities for indirectly detecting planets via their dynamical effects on the distribution of the dust.
Observing light scattered by debris disks is difficult because the disks have small optical depths () and their host stars are bright. Dozens of optically thick disks around young stars have been imaged in scattered light, but only 16 debris disks have been resolved in this manner (Table 1). Five of these debris disks surround stars with masses : AU Microscopii (spectral type M1 Ve; Kalas et al., 2004), HD 107146 (G2 V; Ardila et al., 2004), HD 53143 (K1 V; Kalas et al., 2006), HD 61005 (G8 V; Hines et al., 2007), and HD 92945 (K1 V; this paper). Thus, few examples of the circumstellar environments of low-mass stars in the late stages of planet formation are known.
The nearby star HD 92945 (K1 V, , distance = pc; ESA 1997) was first identified by Silverstone (2000) as a candidate for attendant circumstellar dust based on its 60 µm flux measured by the Infrared Astronomical Satellite (IRAS), which significantly exceeds the expected photospheric flux at that wavelength. Mid-infrared and submillimeter images of HD 92945 from the Spitzer Space Telescope and the Caltech Submillimeter Observatory also reveal excess fluxes at 70 µm and 350 µm that, along with the IRAS measurement, are consistent with an optically thin disk of blackbody grains having an inner radius of 15–23 AU, an equilibrium temperature of 40–46 K, and a fractional infrared luminosity of , where is the bolometric luminosity of the star (Chen et al., 2005; Plavchan et al., 2009). This fractional luminosity is about half that of the disk surrounding the Myr-old, A5 V star Pictoris (Decin et al., 2003). López-Santiago et al. (2006) estimate an age of –150 Myr for HD 92945 based on its luminosity, lithium absorption strength, and association with the Local (Pleiades) Moving Group. However, Plavchan et al. (2009) suggest an age of Myr based on correlations of age with X-ray and Ca II H and K emission (Mamajek & Hillenbrand, 2008).
In this paper, we present the first resolved scattered-light images of the debris disk around HD 92945. These coronagraphic images from the Hubble Space Telescope (HST) provide only the second opportunity to study a debris disk around a K dwarf at visible wavelengths. We also present new mid-infrared photometry and spectra of the disk obtained from the Spitzer Space Telescope. Together, these HST and Spitzer observations allow us to constrain the optical properties, sizes, and spatial distribution of the dust grains within the disk. We use these constraints to revise the estimates of the disk’s fractional infrared luminosity and mass previously reported by Chen et al. (2005) and Plavchan et al. (2009). Finally, we discuss the morphology of the disk in the context of other spatially resolved debris disks and current models of dust production and dynamics during the late stages of planet formation.
2 Observations and Data Processing
Our HST and Spitzer observations are presented jointly as the result of agreements between the HST Advanced Camera for Surveys (ACS) Investigation Definition Team (IDT), the Multiband Imaging Photometer for Spitzer (MIPS) Instrument Team, and the investigators associated with Spitzer Fellowship program 241 (C. H. Chen, Principal Investigator), which utilizes Spitzer’s InfraRed Spectrograph (IRS) and the MIPS Spectral Energy Distribution (SED) mode. The inclusion of HD 92945 in the ACS IDT’s dedicated effort to discover and characterize nearby debris disks was informed by an early 70 µm MIPS detection of cold circumstellar dust around the star (Chen et al., 2005). The MIPS detection confirmed the previous IRAS measurement and established an acceptible likelihood of detection by ACS based on previous successful imaging of the debris disk around HD 107146 (Ardila et al., 2004).
2.1 HST/ACS Coronagraphic Observations
2.1.1 Imaging Strategy and Reduction
The ACS observations of HD 92945 were performed as part of HST Guaranteed Time Observer (GTO) program 10330, which followed the IDT’s standard strategy of first obtaining coronagraphic images through a single broadband filter to assess the presence of a debris disk and later obtaining multiband images of the disk, if warranted. The first images of HD 92945 were obtained on UT 2004 December 1 using the High Resolution Channel (HRC) of ACS (Ford et al., 2003; Maybhate et al., 2010). The HRC has a -pixel CCD detector whose pixels subtend an area of 0028 0025, providing a field of view (FOV). HD 92945 was acquired in the standard “peak-up” mode with the coronagraph assembly deployed in the focal plane of the aberrated beam. The star was then positioned behind the small (09 radius) occulting spot located approximately at the center of the FOV. Two successive coronagraphic exposures of 1100 s were recorded using the F606W (Broad ) filter. Two 0.1 s and two 35 s direct (i.e., non-coronagraphic) exposures of HD 92945 were also recorded for the purposes of photometric calibration and detection of any bright circumstellar material obscured by the occulting spot. The 0.1 s exposures were digitized using an analog-to-digital (A/D) gain of DN-1 to allow unsaturated images of the unocculted star; the other images were recorded with an A/D gain of DN-1 for better sampling of faint sources. All images were recorded within one HST orbit. A similar set of F606W images of HD 100623 (K0 V, , pc; ESA 1997) was recorded during the orbit immediately following the observation of HD 92945. These images provide references for the instrumental point-spread functions (PSFs) of a nearby star with colors similar to HD 92945 but having no known circumstellar dust (Smith et al., 1992).
Follow-up HRC observations of HD 92945 were conducted on UT 2005 July 12. (The same observations attempted previously on UT 2005 April 21 were unsatisfactory because of failed guide-star acquisition.) Because of changing seasonal constraints on the spacecraft’s roll angle, the FOV was rotated counterclockwise by 157° from the orientation obtained 7 months earlier. Multiple coronagraphic exposures totalling 4870 s and 7600 s were recorded through the F606W and F814W (Broad ) filters, respectively, over 5 consecutive HST orbits. One direct exposure of 0.1 s was also recorded through each filter for photometric calibration. The A/D gain settings conformed with those used in the first-epoch observation. Likewise, coronagraphic exposures of HD 100623 totalling 2178 s and 2412 s were recorded through F606W and F814W, respectively, over 2 consecutive orbits immediately following the observation of HD 92945. One 10 s coronagraphic exposure of HD 100623 was recorded through each filter to ensure unsaturated imaging of the PSF along the perimeter of the occulting spot. One direct exposure of 0.1 s was also recorded through each filter for photometric purposes.
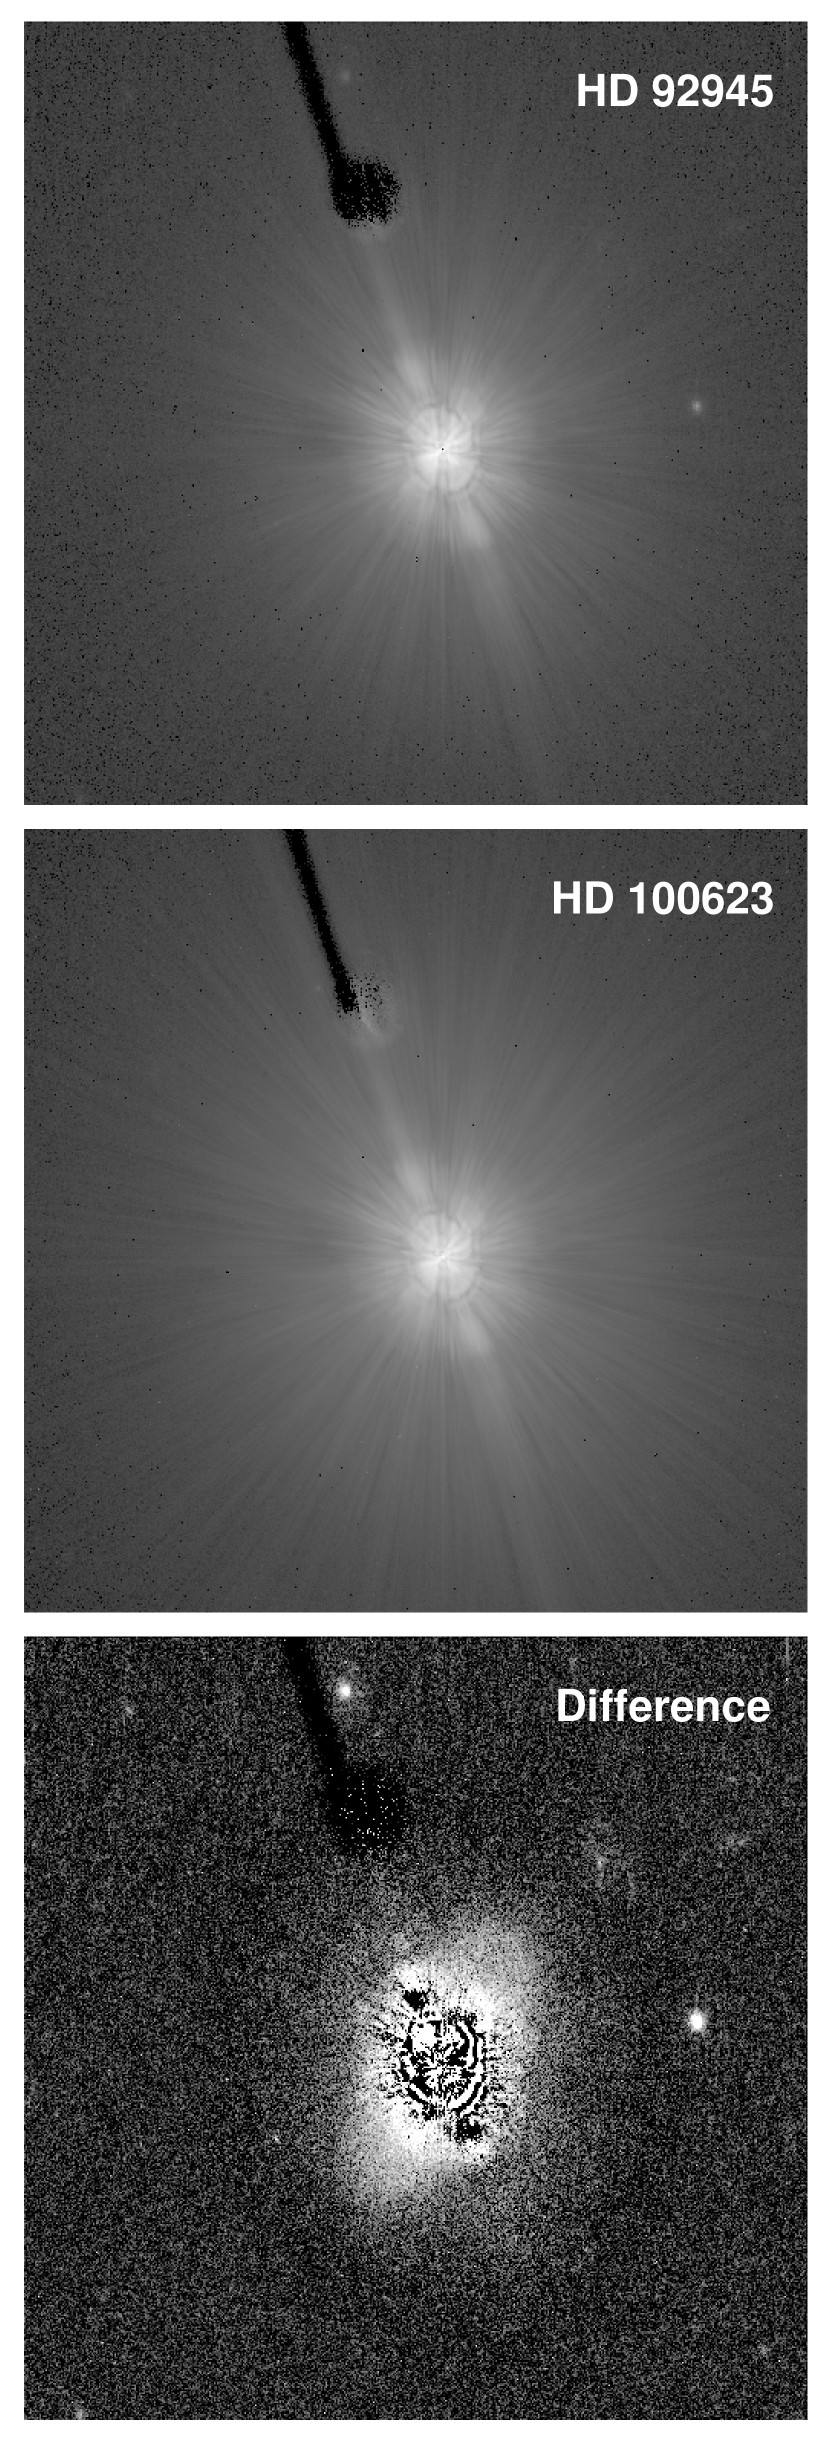
The initial stages of image reduction (i.e., subtraction of bias and dark frames and division by a direct or coronagraphic flat field) were performed by the ACS image calibration pipeline at the Space Telescope Science Institute (STScI; Pavlovsky et al. 2006). We averaged the images recorded with the same combinations of filter, exposure time, and roll angle after interpolating over permanent bad pixels and rejecting transient artifacts identified as statistical outliers. We then normalized the averaged images to unit exposure time. We replaced saturated pixels in the long-exposure images of HD 100623 with unsaturated pixels at corresponding locations in the 10 s images. Throughout this process, we tracked the uncertainties associated with each image pixel. In this manner, we created cosmetically clean, high-contrast images and meaningful error maps for each combination of star, filter, and roll angle. The reduced, second-epoch F606W images of HD 92945 and HD 100623 are shown in the top and middle panels of Figure 1, respectively. The corresponding first-epoch F606W and second-epoch F814W images are qualitatively similar to those shown in Figure 1.
2.1.2 Subtraction of the Coronagraphic PSF
To examine the scattered-light component of the dust around HD 92945, we removed from each image the overwhelming light from the occulted star’s PSF. By observing HD 92945 and HD 100623 in consecutive HST orbits, we limited the differences between the PSFs of the two stars that would otherwise be caused by inconsistent deployment of the coronagraph assembly, gradual migration of the occulting spot, or changes in HST’s thermally driven focus cycles (commonly called “breathing”; Krist, 2002). We measured the positions of the stars behind the occulting spot using the central peaks of the reduced coronagraphic PSFs (Figure 1) that resulted from the reimaging of incompletely occulted, spherically aberrated starlight by ACS’s corrective optics (Krist, 2000). The positions of the two stars differed by –0.5 pixel (008–0013). Similar offsets between two coronagraphic images of the same star cause % variations in the surface brightness profiles of the occulted PSFs over most of the HRC’s FOV (Krist, 2000). For different stars, this alignment error may be compounded by differences between the stars’ colors and brightnesses.
Optimal subtraction of the coronagraphic PSF requires accurate normalization and registration of the filter images of the reference star HD 100623 with the corresponding images of HD 92945. We used the 0.1 s direct F606W and F814W images and conventional aperture photometry to measure the relative brightnesses of each star in each bandpass. The first-epoch F606W images of HD 100623 were slightly saturated, but the flux-conserving A/D gain of 4 DN-1 (Gilliland, 2004) and a large (05 radius) aperture permitted accurate measurement of the integrated flux. We computed flux ratios, , of 5.00 and 4.83 for F606W and F814W, respectively. We divided the images of HD 100623 by these ratios to bring the integrated brightnesses of the reference PSFs into conformity with those of HD 92945.
We aligned the normalized images of HD 100623 with the corresponding images of HD 92945 using an interactive routine that permits orthogonal shifts of an image with subpixel resolution and cubic convolution interpolation. The shift intervals and normalization factors (i.e., ) were progressively refined throughout the iterative process. We assessed the quality of the normalization and registration by visually inspecting the difference image created after each shift or normalization adjustment. Convergence was reached when the subtraction residuals were visibly minimized and refinements of the shift interval or normalization factor had inconsequential effects (e.g., bottom panel of Figure 1). Based on these qualitative assessments, we estimate that the uncertainty of the registration along each axis is pixel and the uncertainty of in each bandpass is %.
After subtracting the coronagraphic PSFs from each image of HD 92945, we transformed the images to correct the pronounced geometric distortion across the HRC’s image plane. In doing so, we used the coefficients of the biquartic-polynomial distortion map provided by STScI (Meurer et al., 2002) and cubic convolution interpolation to conserve the imaged flux. This correction yields a rectified pixel scale of 0025 0025. We then combined the first- and second-epoch F606W images by rotating the former images counterclockwise by 157°, aligning the images according to the previously measured stellar centroids, and averaging the images after rejecting pixels that exceeded their local values. Regions shaded by the HRC’s occulting bar and large occulting spot were excluded from the average, as were regions corrupted by incomplete subtraction of the linear PSF artifact seen in Figure 1. (Because the orientations of the first- and second-epoch F606W images differed by 157°, the regions obscured by the occulters and the linear artifact at one epoch were unobscured at the other epoch.) Again, we tracked the uncertainties associated with each stage of image processing to maintain a meaningful map of random pixel errors.
We combined in quadrature the final random-error maps with estimates of the systematic errors caused by uncertainties in the normalization and registration of the reference PSFs. The systematic-error maps represent the convolved differences between the optimal PSF-subtracted image of HD 92945 and three nonoptimal ones generated by purposefully misaligning (along each axis) or misscaling the images of HD 100623 by amounts equal to our estimated uncertainties in PSF registration and . The total systematic errors are 1–5 times larger than the random errors within 5 of HD 92945, but they diminish to 2–25% of the random errors beyond – from the star. We refer to the combined maps of random and systematic errors as total-error maps. Note that these maps exclude systematic errors caused by changes in HST’s focus between the observations of HD 92945 and HD 100623 or by small differences in the stars’ colors, which affect the spatial and spectral distributions of light within the PSFs. (Krist, 2000; Krist et al., 2003). Unfortunately, without precise knowledge of HST’s thermally varying optical configuration or the stars’ spectra, these systematic errors cannot be accurately predicted or assessed.
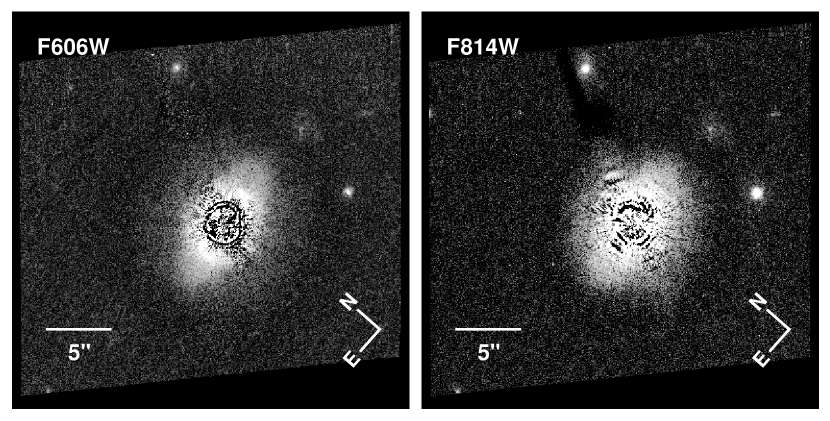
Figure 2 shows the PSF-subtracted and distortion-corrected images of HD 92945 in F606W and F814W. Each image has been divided by the measured brightness of the star in the respective bandpass. The alternating light and dark bands around the occulting spot reflect imperfect PSF subtraction caused by the slightly mismatched centroids of HD 92945 and HD 100623 (Krist et al., 2003). These subtraction residuals preclude accurate photometry of the disk within 0 ( AU) of the star. Likewise, the residual bands extending from the occulting bar in the F814W image are caused by imperfect subtraction of the linear PSF artifact seen in Figure 1. (Similar residual bands were removed from the F606W image, as described above.) The images show three distinct structures centered about the star: (1) a relatively bright but partially obscured elliptical ring extending 0–30 from the star, (2) an elliptical disk of lower but more uniform surface brightness extending beyond the ring and oriented at a position angle (PA) of °, and (3) a circular halo of very-low surface brightness encompassing both the ring and disk and extending outward to and in the F606W and F814W images, respectively. The halo itself is surrounded by a 5-wide ring having slightly lower surface brightness than the residual sky at the edges of the FOV.
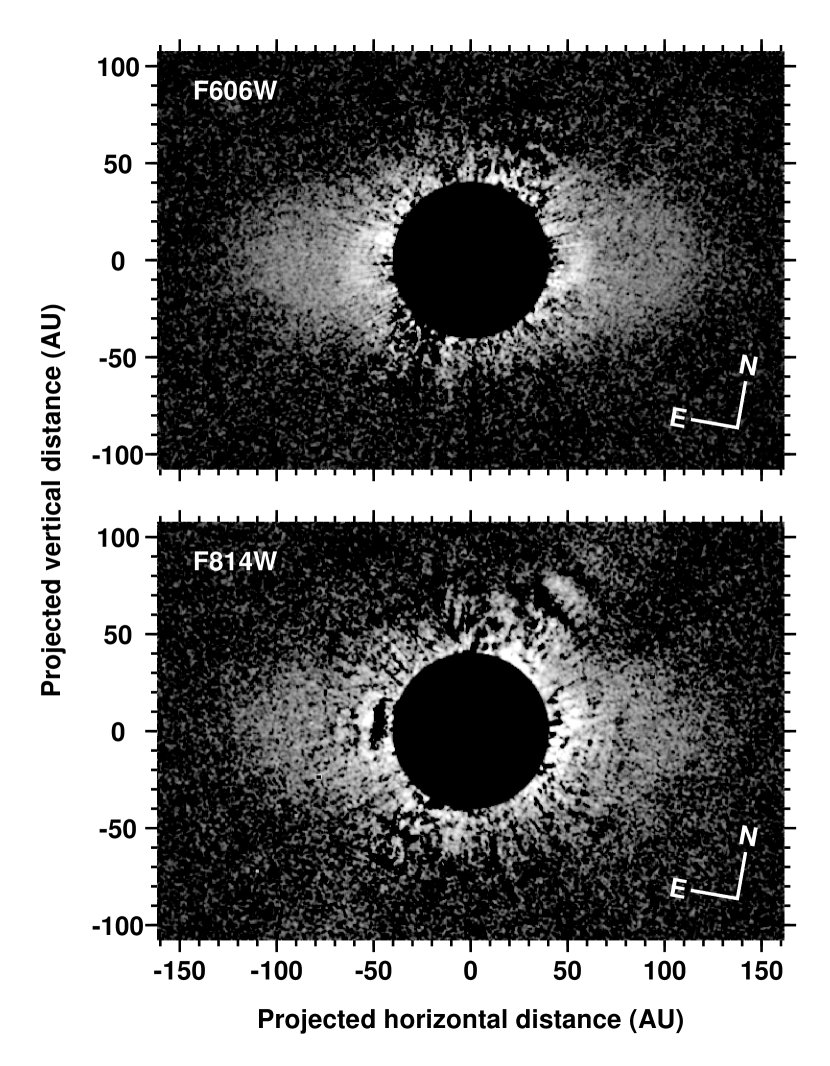
The faint extended halo and surrounding dark ring are well-known artifacts of the subtraction of two coronagraphic HRC images recorded at different phases of HST’s breathing cycle (Krist, 2000; Krist et al., 2003). The prominent halo in the F814W image may also reflect incomplete subtraction of red photons ( µm) that have diffusely scattered from the CCD substrate back into the CCD (Sirianni et al., 2005). Some of this red halo may remain if the far-red colors of HD 92945 and HD 100623 differ slightly. To remove the halos from our F606W and F814W images, we azimuthally subtracted 9th- and 10th-order polynomials fitted to the average radial profiles of the halos measured beyond 30 and 32 from the star, respectively, and within ° of the minor axis of the elliptical disk. The accuracy of this subtraction is clearly contingent on the assumptions that the halo is azimuthally symmetric and that any actual circumstellar flux in the fitted region is negliglible. The halo-subtracted images are shown in Figure 3; they represent the final stage of our HRC image processing.
2.2 Spitzer Observations
2.2.1 MIPS Photometry
Following the 24 µm and 70 µm MIPS detections of HD 92945 recorded with the coarse (default) image resolution (Chen et al., 2005; Plavchan et al., 2009), we obtained 70 µm fine-scale (524 533 per pixel) and 160 µm coarse-scale (1596 1804 per pixel) MIPS images as part of Spitzer GTO program 40679. The 70 µm fine-scale images were recorded on UT 2008 February 16 using two cycles of 10 s exposures and a small field dither pattern located at each of 4 target positions on a square grid with sides of 1622 (3.16 pixels). The total effective on-source exposure time was 672 s. The 160 µm images were obtained on UT 2008 June 22 using one cycle of the small field dither pattern and 10 s exposures at each of 9 target positions with relative offsets of and ( pixels) along the short axis of the 220 pixel array and with , , and offsets along the long axis of the array to provide a large area for background measurement. For both imaging bandpasses, the observing strategy provided enhanced subpixel sampling for improved PSF subtraction and deconvolution.
The 70 µm and 160 µm data were processed using the MIPS Data Analysis Tool (DAT; Gordon et al. 2005) version 3.10, which produces mosaics with rectified pixel sizes of 262 and , respectively. No field sources brighter than 3% of HD 92945’s brightness were detected within of the star. Photometry within a 12-pixel square aperture yielded a 70 µm flux density of mJy after subtraction of the local background, which is consistent with the default-scale measurement of Plavchan et al. (2009). After applying a 7% color correction relative to a fiducial Rayleigh–Jeans spectrum within the 70 µm bandpass, we obtain a final 70 µm flux density of mJy for HD 92945. We derived a 160 µm flux density of mJy using a 12-pixel square aperture and an aperture correction of 0.73 derived from an Tiny Tim/Spitzer model PSF (Krist, 2006). In both bandpasses, the formal error is dominated by the absolute photometric calibration. The near-infrared spectral leak of the MIPS 160 µm bandpass is not a concern for HD 92945, which has a relatively faint -band magnitude of 5.7 (Colbert et al., 2010).
2.2.2 MIPS and IRS Spectroscopy
We observed HD 92945 with the MIPS SED mode on UT 2005 June 23. This mode produces a low-resolution (–25) spectrum from 55 to 90 µm (Heim et al., 1998; Colbert et al., 2010). The slit was oriented at PA = 300°, i.e., ° from the projected major axis of the disk seen in the ACS/HRC images. Ten cycles of 10 s exposures were recorded for a total integration time of 629 s. We obtained a background SED by chopping from the nominal pointing, and we then subtracted the background SED from the target SED. The images were reduced using MIPS DAT version 3.10, which produces a mosaic with 44 pixels 9 pixel-1 in the spatial direction and 65 pixels in the spectral direction (Gordon et al., 2005). We smoothed the mosaic in the spectral direction with a 5-pixel boxcar to improve the measured signal-to-noise ratio (S/N). We then summed the signal in 5 columns centered on the peak emission along each row of the mosaic and extracted the SED. To calibrate the flux, we scaled a similarly reduced and extracted SED of the spectrophotometric standard star Canopus (spectral type G8 III) to a flux density of 3.11 Jy at 70 µm and then corrected for the MIPS spectral response function by assuming that Canopus has a Rayleigh-Jeans SED at far-infrared wavelengths. We used a point-source aperture correction, keeping in mind that a secondary correction is needed when fitting a spatially extended disk model to the SED (§4.2).
We performed IRS observations of HD 92945 on UT 2005 May 21 using both Short–Low (SL1: 7.4–14.5 µm; SL2: 5.2–8.7 µm) and Long–Low (LL1: 19.5–38.0 µm; LL2: 14.0–21.3 µm) spectroscopic modes (Houck et al., 2004). The widths of the SL and LL entrance slits are 37 and 106, respectively. For each mode, we obtained 6 s exposures at two positions along the slit. We extracted and summed the spectra from the two slit positions to enhance the S/N and then subtracted the same spectra to establish the observational uncertainty above the normal shot noise and 5% uncertainty in the absolute photometric calibration. We then spliced the four spectral orders after removing their low-S/N edges, thereby obtaining a total wavelength range of 5.3–34 µm. Our measured flux density of 42 mJy at 24 µm matches very well the MIPS 24 µm value reported by Plavchan et al. (2009). As before, we assumed a point-source aperture correction with the understanding that a secondary correction should be applied if the source is found to be extended (§4.2).
3 Analysis of Optical Scattered Light
3.1 Surface Brightness
The fully processed ACS/HRC images (Figure 3) suggest that HD 92945 is surrounded by an azimuthally symmetric disk of dust that is moderately inclined with respect to the line of sight and sharply confined to the region within 1 ( AU) of the star. Any obvious azimuthal variations can be attributed either to geometric projection or to PSF-subtraction residuals. Such axisymmetry is rare within the present group of debris disks resolved in scattered light (Table 1), which typically display asymmetries associated with perturbations from embedded planets or nearby stars (e.g., Pic and HD 141569A; Golimowski et al. 2006; Clampin et al. 2003), interaction with the interstellar medium (e.g., HD 61005; Hines et al. 2007), and/or enhanced forward scattering by micron-sized dust grains (e.g., HD 15745; Kalas et al. 2007a). The apparent axisymmetry of HD 92945’s disk permits us to examine the surface brightness profiles along the projected semimajor axes of the disk and to ascribe these profiles to the entire disk with reasonable confidence.
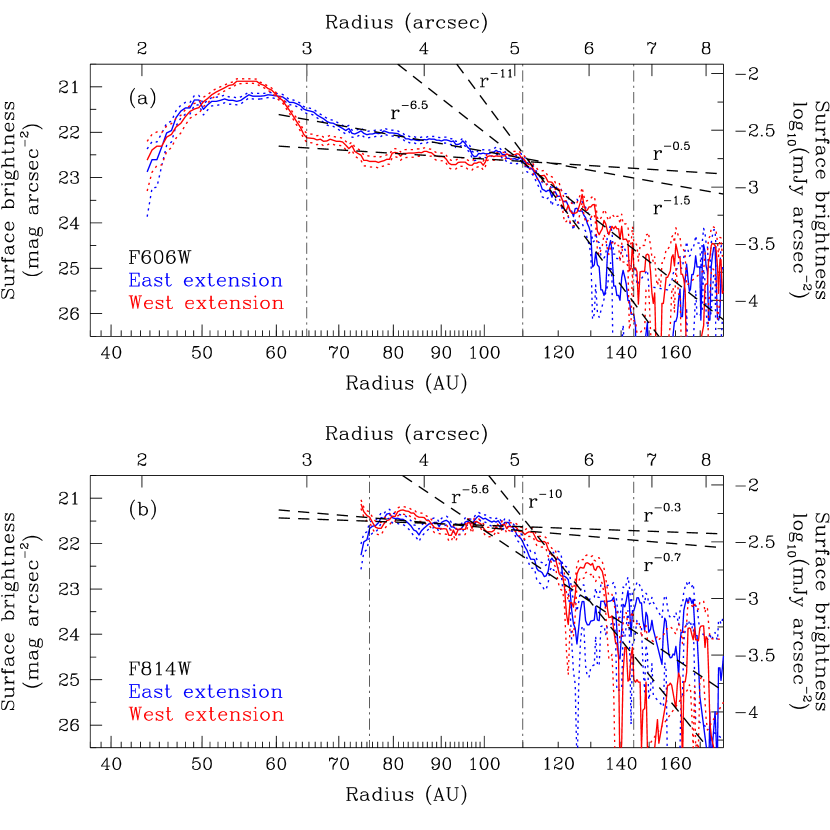
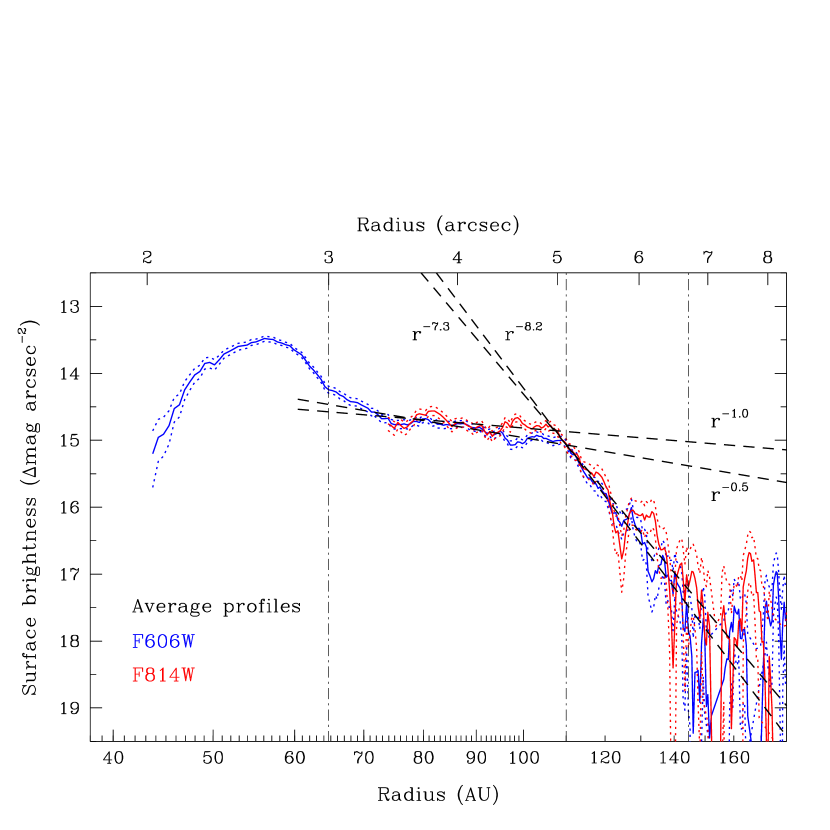
Figures 4 and 4 show the F606W and F814W surface brightness profiles (and their errors) along the opposing semimajor axes of the projected disk. The profiles were extracted from the respective images shown in Figure 3 after smoothing the images with an pixel boxcar. The F606W profile has a credible inner radial limit of ( AU) because the two orientations used for the F606W images allow us to remove obvious PSF-subtraction artifacts near the occulting spot (§2.1.2). However, the single orientation of the F814W image prevents credible measurement of the F814W profiles within 4 of the star. The F606W profiles are peaked between and (43–65 AU) from the star – the region we call the inner ring – with maxima of 21.0–21.5 mag arcsec-2. In the region 30–51 (67–110 AU) from the star, the F606W and F814W profiles decline approximately as radial power laws, , where –1.5 for F606W and –0.7 for F814W. Beyond 1 (110 AU), the profiles decrease so precipitously (–11) that the disk is effectively truncated at that radius.
The error profiles indicate no significant differences between the F814W profiles of the eastern and western sides of the projected disk, but the opposing F606W profiles differ by 2– over most of the imaged region. These error profiles, which are obtained from our error maps (§2.1.2), reflect the combined uncertainties incurred from random errors (i.e., read and photon noise) and systematic errors from improperly scaled or aligned reference PSFs. They do not include systematic errors stemming from any intrinsic but unquantifiable discrepancies between the coronagraphic PSFs of HD 92945 and HD 100623 caused by differences in the stars’ colors, HST’s focus during the stars’ observations, or the positions of the stars behind the occulting spot. The maximum difference of mag arcsec-2 between the opposing F606W profiles corresponds to a PSF-subtraction error of % at , which is within the range of local residuals expected for focus variations of a few microns typically associated with breathing or changes in HST’s orientation with respect to the Sun (Krist, 2000; Krist et al., 2003). Therefore, the F606W and F814W surface brightness profiles along the opposing semimajor axes are consistent with our initial assumption of an axisymmetric disk.
3.2 Intrinsic Color
Figure 5 shows the averages of the F606W and F814W surface brightness profiles extracted from both sides of the projected disk. The profiles have been normalized to the measured brightnesses of the star in the respective bands, so that the ordinate now expresses the surface brightness of the disk as a differential magnitude: (mag arcsec-2)disk – magstar. The F606W and F814W profiles are nearly coincident 35–67 from the star and can be represented by radial power laws with for –51 (65–110 AU) and for . These overlapping profiles indicate that the disk has an intrinsic color of , i.e., the dust grains are neutral scatterers at red wavelengths. This neutrality is unusual among the debris disks listed in Table 1; only HD 32297’s disk was previously reported to have intrinsic visible and near-infrared colors that are neither strongly blue nor red (Mawet et al., 2009).
The disk’s neutral color at visible wavelengths suggests that the minimum size of the dust grains is at least a few microns for the expected varieties of grain compositions and porosities (Golimowski et al., 2006). If so, then the near-infrared colors of the disk should not deviate significantly from gray. Schneider et al. (2011, in preparation) report a possible detection of HD 92945’s disk using the coronagraphic imaging mode of HST’s Near Infrared Camera and Multi-Object Spectrometer (NICMOS) in the F110W bandpass ( µm, µm; Viana et al. 2009).111The NICMOS images of HD 92945 were obtained in April 2005 as part of a coronagraphic survey of 57 circumstellar-disk candidates (GO Program 10177) that was planned independently of the ACS IDT program. The PSF-subtracted NICMOS image shows excess signal beyond from the star in all directions, but prominent residuals from imperfect PSF subtraction obscure any morphology resembling the disk seen in our ACS images. An azimuthal median profile of the unobscured circumstellar region indicates that the residual F110W surface brightnesses – from the star are nearly an order of magnitude higher than those expected from our ACS images, assuming neutral scattering at visible and near-infrared wavelengths. If valid, the NICMOS results indicate that the disk exhibits a nonintuitive combination of gray colors at visible wavelengths and increased brightness around µm.
3.3 Surface Density of the Dust
The surface brightness of an optically and geometrically thin disk relative to the incident flux at a given angular radius from the star is
| (1) |
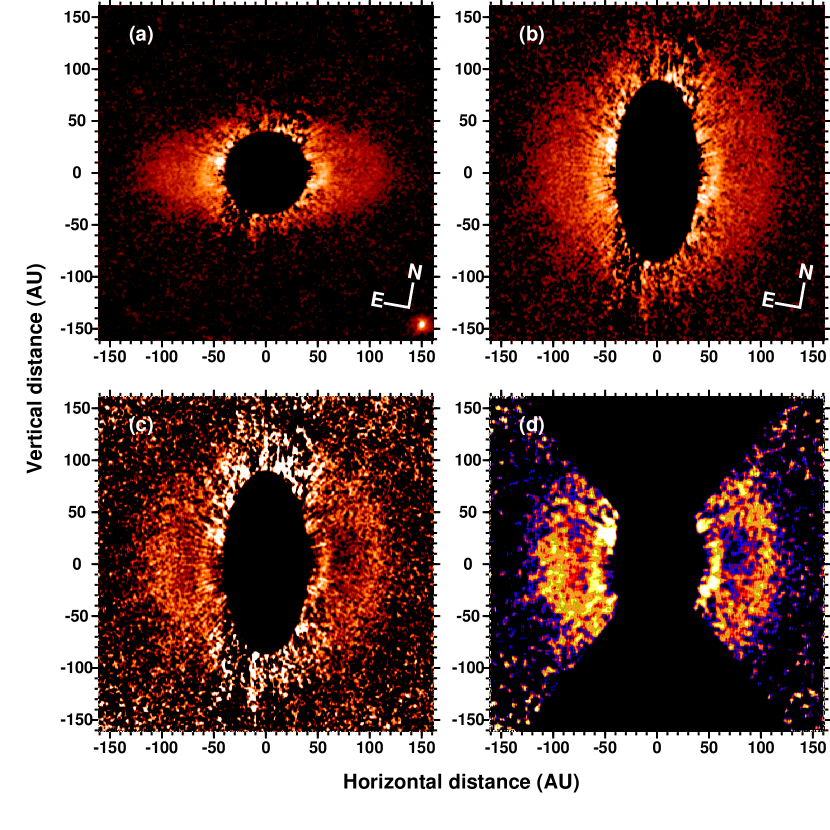
where and are the scattering cross section and surface density of the dust, respectively. Assuming that the grains have homogeneous composition and scatter isotropically, we can map the surface density of dust in HD 92945’s disk by scaling a deprojected version of the scattered-light image by . Figure 6 shows the sequential stages of the conversion of our F606W image to such a map. Figures 6a and 6b are false-color reproductions of our F606W image shown in Figure 3 before and after rotating the disk by ° about its projected major axis so that the disk appears circular and coplanar with the sky. Figures 6c and 6d show with different color tables and smoothing factors the deprojected image after multiplying by to compensate for the geometric dilution of incident starlight with angular distance from the star. These images represent the surface brightness of the dust scaled by an assumed constant value .
Our scaled surface-density map reveals concentrations of grains not only in the previously described inner ring, but also along the outer edge of the disk defined by the sharp decline in the radial surface brightness profile at or 110 AU (§3.1). These overdensities are apparent on both the eastern and western sides of the disk; they appear to be concentric rings of dust centered on the star. The outer ring appears less azimuthally uniform on the eastern side, which may indicate nonisotropic scattering but more likely reflects lower S/N in the southeastern region of the image. If the major axis of the projected disk is properly identified and the dust distribution is axisymmetric, then any evidence of forward scattering should be symmetric about the projected minor axis of the disk and not concentrated in its southeastern quadrant.
3.4 Scattered Light Model
To obtain more quantitative constraints on the density distribution and scattering properties of the circumstellar dust, we applied the three-dimensional scattering model and nonlinear least-squares fitting code previously used to characterize the disk around AU Mic (Krist et al., 2005). Using the azimuthally averaged radial profile from Figure 6c as a guide, the model simultaneously computes the scattering phase function, radial density profile, and inclination of the disk that best fits the observed scattered-light image. The model image also provides a better estimate of the ratio of integrated reflected light from the disk and emitted star light than can be obtained from coronagraphic images that have regions with large PSF-subtraction residuals. Consequently, we modeled only our F606W image of the disk, which has better overall S/N and PSF subtraction than the F814W image.
The F606W radial density profile used to guide the model is represented by the solid curve in Figure 7. Because the model code is designed to produce best-fitting radial density profiles as a series of contiguous power-law functions, we allowed the code to fit up to 18 distinct power-law segments to approximate the unusually complex F606W profile of HD 92945. These 18 segments were established for computational convenience; they are not associated with any physical attributes of the disk itself. We set the inner radius of the model profile at 41 AU, as there appears to be a true clearing in the F606W image despite the large PSF-subtraction residuals near the star. (The disk’s surface brightness inside 41 AU certainly does not increase in a manner consistent with the steep increase associated with the outer edge of the inner ring.) We also placed an outer limit of 150 AU on the model profile, in conformity with the largest distance at which the disk is confidently seen in our F606W image.
Because the plane of HD 92945’s disk is inclined ° from the line of sight (i.e., ° from an “edge-on” presentation), our scattering model cannot constrain the vertical distribution of the dust as a function of radial distance from the star. We can only derive a radial density distribution integrated along lines of sight across the disk. Nevertheless, if we assume that the disk is vertically thin relative to its radial extent (as in the case of AU Mic, whose disk is viewed edge-on), the models show that the vertical density profile does not strongly affect the appearance of a moderately inclined disk in scattered light. We therefore adopted a priori for HD 92945 a Lorentzian vertical density profile similar to those observed in the edge-on disks around AU Mic (Krist et al., 2005) and Pic (Golimowski et al., 2006). We also assumed a flat disk with a fixed scale height of either 0.5 AU or 3.0 AU, which bracket the scale heights observed for AU Mic’s disk within AU of the star (Krist et al., 2005).
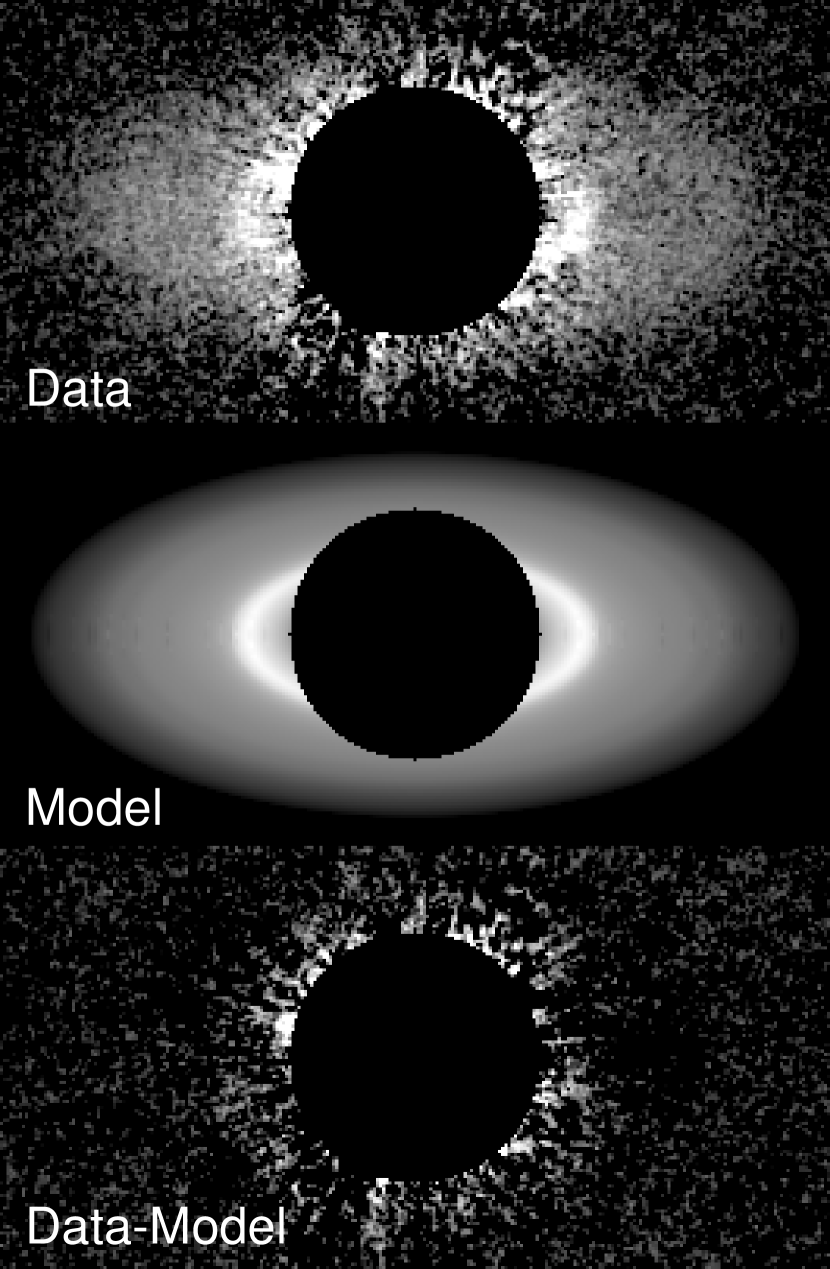
Having fixed the disk’s inner and outer radii, thickness, and vertical density profile, we allowed our code to determine the radial density profile, intensity normalization, scattering phase function (as described by the asymmetry parameter ; Henyey & Greenstein 1941), and disk inclination that best fits the observed F606W image of HD 92945. The model images were convolved with an “off-spot” coronagraphic HRC PSF appropriate for unocculted field sources (Krist, 2000) before comparison with the actual F606W image. Figure 8 shows the best-fit model for AU; the corresponding model for AU is effectively identical. The dashed and dotted curves in Figure 7 represent the radial-density profile of the best-fit model and the azimuthally averaged profile of the model’s surface density map (i.e., the equivalent of Figure 6c), respectively. The models yield for both vertical scale heights, which confirms our qualitative presumption of isotropic scattering. The derived inclinations are 274 and 278 (relative to the line of sight) for AU and 3.0 AU, respectively. Finally, both models yield an integrated F606W flux ratio of .
4 Analysis of Thermal Emission
4.1 Far-Infrared Spectral Energy Distribution
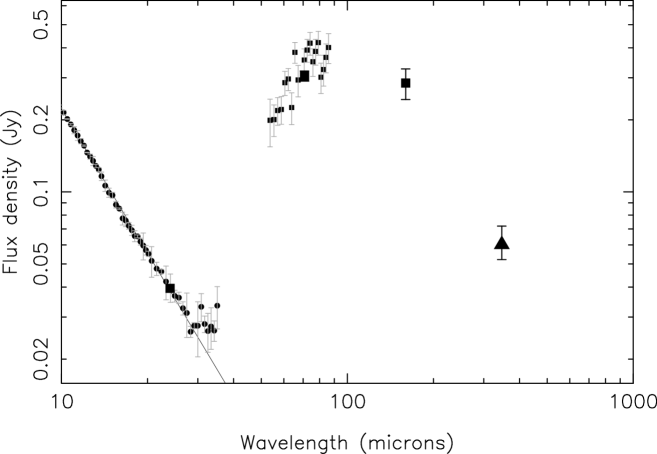
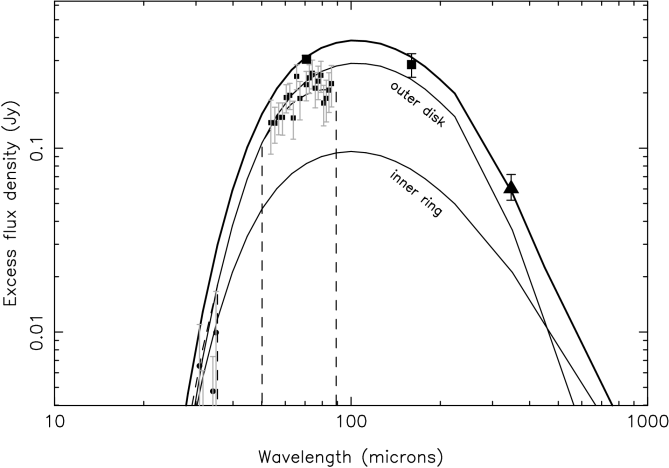
Figure 9 shows our MIPS and IRS data together with previously reported MIPS and ground-based submillimeter measurements of HD 92945. The solid line represents the theoretical Rayleigh–Jeans profile extrapolated from a K model atmosphere (Castelli & Kurucz, 2003) normalized to the measured Two Micron All Sky Survey (2MASS; Skrutskie et al. 1997) magnitude of . The stellar photospheric emission detected with IRS closely tracks the theoretical Rayleigh–Jeans profile and dominates the total emission shortward of 30 µm. An infrared excess begins in the 30–35 µm region of the IRS spectrum, rises steeply at the onset of MIPS SED coverage at 55 µm, and then flattens across the 70–160 µm region spanned by the MIPS broadband photometry. Undulations in the MIPS SED between 55 and 90 µm are artifacts of the SED extraction process.
Fits of elliptical gaussian profiles to the MIPS fine-scale 70 µm and coarse-scale 160 µm images reveal no significant source extension. Our results constrain the full width of the 70 µm source at half the maximum emission to AU. These findings are consistent with the course-scale 70 µm results of Chen et al. (2005).
4.2 Modeling the Infrared SED
We seek a model that reproduces our photometric and spectroscopic Spitzer observations of HD 92945, including an upper limit on the angular extent of the 70 µm MIPS image. To attain this model, we followed the strategy applied by Krist et al. (2010) to their HST and Spitzer observations of the dust ring surrounding HD 207129. We initially assumed the following:
-
1.
The radial distribution of dust obtained from our scattered-light model also delimits the dust responsible for the mid-infrared excess detected in the MIPS and IRS data.
-
2.
All dust is in local thermal equilibrium (LTE) with a star of luminosity and mass .222The adopted values of luminosity and mass for HD 92945 are obtained from the NASA/IPAC/NExScI Star and Exoplanet Database (http://nsted.ipac.caltech.edu).
-
3.
The dust comprises astronomical silicate grains whose wavelength-dependent emissivities are calculated from Mie theory and the optical constants of Laor & Draine (1993).
-
4.
The grains have a size distribution, , appropriate for a steady-state collisional cascade (Dohnanyi, 1969), but bounded between minimum and maximum radii and .
We calculated model thermal images with spatial resolution for each of 31 wavelengths spanning 10–850 µm for this dust distribution and various combinations of vertical optical depth, , and . Our initial value of µm was based on the maximum radius () of grains with mass density 2.5 g cm-3 that are immediately blown out from the disk by radiation pressure (Strubbe & Chiang, 2006; Plavchan et al., 2009). We compared the total flux from each set of 31 models with the observed SED of HD 92945’s excess infrared emission. We combined appropriate subsets of the model images to simulate the MIPS 24, 70, and 160 µm broadband images. To produce synthetic IRS and MIPS SED data, we convolved the model images with instrumental PSFs suitably windowed by the entrance slits and position angles used in our Spitzer observations. Because the disk appears unresolved in our broadband MIPS images, we assume that the losses of flux through the slits are identical to those of a point source.
The strongest constraint on is provided by the weak infrared excess seen in the IRS spectrum longward of 30 µm. Our initial model yielded µm, µm, and a vertical optical depth of 0.0027 for grains of size located at the inner edge of the disk ( AU). Thus, . Although these results are consistent with the observed upper limit of the 70 µm source size, we had to steepen the grain-size distribution to to fit the 70 µm and 160 µm photometry simultaneously. Even with this adjustment, the initial model overestimated the 350 µm flux density by a factor of 1.7.
To address this problem, we postulated that the large grains are not evenly distributed throughout the observed disk but are confined to the inner ring at 41–63 AU. We also surmised that the outer disk (63–150 AU) consists of smaller particles that have been ejected from the inner ring by some combination of collisions, stellar wind, radiation pressure, and/or gravitational scattering by planetary bodies. Similar structures have been inferred for the disks surrounding AU Mic and Pic (Strubbe & Chiang, 2006), HD 61005 (Maness et al., 2009), Fomalhaut (Chiang et al., 2009), and Vega (Müller et al., 2010). We thus adopted a two-component dust model for HD 92945’s disk. We maintained the grain-size distribution and surface-density profile derived from the scattered-light images, but assumed that µm within the ring and µm elsewhere in the disk. This change reduced the total number of large grains in the disk and brought the model into agreement with the 350 µm measurement.
While this two-component model provides a good fit to the MIPS and IRS data, it is inconsistent with the observed surface brightness of the disk in scattered light. The average albedo of the dust is
| (2) |
where and are the fractions of bolometric stellar flux that are scattered and emitted by the dust, respectively. According to Mie theory, astronomical silicate grains with µm should have from visible to near-infrared wavelengths (Voshchinnikov et al., 2005). We used this value in the LTE calculations intrinsic to our SED model. However, if we assume from our ACS F606W and F814W images that the disk scatters neutrally at all wavelengths that significantly heat the dust (notwithstanding the NICMOS results of Schneider et al. 2011, in preparation), then our scattered-light model implies (§3.4). We also derive from the measured infrared SED (Figure 9), which supersedes previous estimates of reported by Chen et al. (2005) and Plavchan et al. (2009). We therefore obtain , which is times smaller than the predicted Mie value. As noted before for HD 207129’s disk (Krist et al., 2010), simple Mie grains are inconsistent with the combined visible and far-infrared observations of the disk surrounding HD 92945.
We produced another two-component model using but retaining the original Mie value for the grain absorption efficiency, . In other words, we retained the emissive properties of astronomical silicate grains but modified their reflectivity so they are essentially black. To compensate for the effect of this adjustment on the short-wavelength end of the SED, we increased to 4.5 µm because larger, less reflective grains achieve the same equilibrium temperature as smaller, more reflective grains at a given distance from the star. Figure 10 shows our final model, which best matches the observed SED and surface brightness of the disk if the sources of the scattered and emitted light are cospatial. The component SEDs show that the outer disk is the dominant contributor to the observed 70, 160, and 350 µm emission and that the larger grains in the inner ring should become the dominant emitters longward of µm.
The constraints placed on , , and by our final model are unique for the assumed emissive properties of compact astrosilicate grains, but other constraints may be obtained for different assumptions about these properties. Supplemental photometry at 450 and 850 µm would be a useful check of our values of in both the inner ring and outer disk. We can however exclude blackbody grains from consideration, as they would be too cold at the radii delimited by the scattered-light images to produce the observed SED. Moreover, the disk is too extensive to be characterized by a single blackbody temperature. Any resemblance of our SED model longward of 160 µm (Figure 10) to the Rayleigh–Jeans tail of a single Planck distribution is coincidental.
4.3 Integrated Dust Mass
Combining our final values of , , and for each dust component with the surface-density profile from our scattered-light model, we obtain an integrated dust mass of g () for compact grains of pure astronomical silicate. Although is 18 times larger in the inner ring than the outer disk, the inner ring is 4 times less massive than the outer disk. This disparity is caused by the relatively large surface area of the outer disk and the steeply declining grain-size distribution throughout both the inner ring and outer disk. Our estimated mass of g for grains smaller than 900 µm in the inner ring is % of the computed mass of Fomalhaut’s ring (Holland et al., 1998; Kalas et al., 2005),333Kalas et al. (2005) computed masses of (0.7–1.5) g for Fomalhaut’s ring assuming albedos of 0.1–0.05, which conform to our measured value of for HD 92945. For the extreme case of , Kalas et al. (2005) computed a mass of g, which is comparable with our estimate for HD 92945’s inner ring. and % of the predicted mass of the ring around HR 4796A (Klahr & Lin, 2000).
Our integrated dust mass is times larger than the value obtained by Plavchan et al. (2009) from early MIPS 24 and 70 µm photometry of HD 92945. This discrepancy is due to prior assumptions that the dust lies within a thin shell of radius 23 AU, , and µm. None of these assumptions is upheld by our scattered-light images and thermal model. For comparative purposes, we applied the same formula used by Plavchan et al. (2009) to compute the dust mass and obtained a value that is only 20% larger than the one derived from our observed surface-density profile. Therefore, our revised dust mass of supersedes those previously reported by Chen et al. (2005) and Plavchan et al. (2009).
5 Discussion
5.1 Dust Properties
The dust’s neutral color and negligible emission at 24 µm indicate that the collisional cascade is suppressed below radii of
several microns, which is an order of magnitude larger than . This truncation of the grain-size distribution is
counterintuitive for a star of subsolar mass and luminosity, especially as the dust’s isotropic scattering and low albedo indicate a
large population of submicron-sized grains (Voshchinnikov et al., 2005). This contradiction suggests that our initial assumptions about the location,
composition and/or size distribution of the thermally emitting dust should be reviewed.
5.1.1 Radial Distribution
Our invocation of two dust components with common but different to explain the disk’s neutral color and infrared SED is based on the assumption that the dust grains responsible for the scattered light and the infrared excess are cospatial. Although the inner ring seen in our coronagraphic F606W image suggests that the dust is created in a coincident planetesimal belt, the presence of dust closer to the star cannot be ruled out by our coronagraphic images alone. If such dust is present and in LTE with the stellar radiation field, it must have µm (our derived value for the inner ring) or a large albedo to avoid a detectable 24 µm excess. The former option worsens the discrepancy between the large needed to fit the infrared SED and the small for a young K dwarf like HD 92945. The latter option counterintuitively suggests that conditions favorable for icy grains increase within 40 AU of the star rather than beyond the expected snow line at AU (Kennedy & Kenyon, 2008). Thus, neither option favors the presence of much dust between the star and the inner ring.
Conversely, if much dust exists beyond the apparent outer limit of the scattered-light disk ( or 110 AU), then its albedo must be nearly zero to conform with the observed surface brightness profiles (Figure 5). Moreover, must be much steeper than the traditional power law (Dohnanyi, 1969) to account for both the observed SED longward of 160 µm and the unresolved 70 µm image of the disk. Such a small albedo again counters the expected formation of icy mantles beyond the snow line, and it implies a corresponding increase in emissivity for grains larger than µm. Such small grains would be efficiently expelled from the disk by radiation pressure. Collectively, these arguments support our assumption that all the thermally emitting dust is confined within the angular limits of the visible scattered light seen Figure 3.
5.1.2 Composition and Porosity
Recent theoretical studies of other debris disks have frequently invoked highly porous aggregate grains to explain the observed scattered light and/or thermal emission from the dust (Li & Greenberg, 1998; Li & Lunine, 2003a, b; Li et al., 2003; Graham et al., 2007; Fitzgerald et al., 2007; Shen et al., 2009). Models of the optical properties of porous grains have yielded diverse and sometimes contradictory results, so we defer a detailed model of HD 92945’s disk using porous aggregate grains to other investigations. For now, we qualitatively assess the substitution of such grains for the compact grains in our scattered-light and thermal models.
Voshchinnikov et al. (2005) showed that the Henyey–Greenstein scattering asymmetry parameter, , of moderately porous grains increases by factors of 1–1.25 over that of compact grains for –2.5 µm and -band wavelengths. Shen et al. (2009) showed that the degree of porosity has little effect on the scattering phase functions of grains at wavelengths . Consequently, neither compact nor porous micron-sized grains account for the isotropic scattering observed from HD 92945’s disk. The effect of porosity on the albedo is unclear, however, as Hage & Greenberg (1990) and Voshchinnikov et al. (2005) oppositely predict that highly porous grains have lower and higher albedos, respectively, than compact grains of similar composition.
The effect of porosity on the sizes of grains that succumb to radiation pressure is also ambiguous because also depends on the composition of the grains. Mukai et al. (1992) showed that the ratio of the forces of radiation and gravity on a grain decreases with increasing porosity for µm, regardless of grain composition. Saija et al. (2003) confirmed this result and emphasized that the decreasing was limited to ultraviolet and visible wavelengths. Mukai et al. (1992) also showed that increases with porosity for absorptive grains (e.g., magnetite and graphite) with µm, and it becomes nearly independent of grain size at the highest porosities. On the other hand, dielectric grains (e.g. astronomical silicate) with µm experience decreasing as porosity increases. Köhler et al. (2007) determined that increases rapidly with increasing porosity for both graphite and silicate grains with µm. Collectively, these results indicate that high porosity of grains in HD 92945’s disk does not explain the µm obtained from our silicate-based thermal model. However, high porosity may be responsible for such a large value of if the dust is mostly composed of more absorptive materials like graphite.
5.1.3 Size Distribution
Our need to steepen HD 92945’s grain-size distribution from the traditional representation (Dohnanyi, 1969) to reproduce the observed SED is consistent with thermal models of the disks around AU Mic (Strubbe & Chiang, 2006) and HD 207129 (Krist et al., 2010), which, like our model, employ compact spherical grains. On the other hand, models that employ fluffy porous grains, like those developed for the disks around HR 4796A (Li & Lunine, 2003a), HD 141569A (Li & Lunine, 2003b), and Eridani (Li et al., 2003), require grain-size distributions that are significantly shallower than . Recent models of collisional cascades in the presence of radiation pressure have shown that the rapid loss of grains with creates a wave in the size distribution of the remaining grains (Thébault et al., 2003; Krivov et al., 2006; Thébault & Augereau, 2007), so a single power-law representation may be inappropriate regardless of porosity or composition. Thébault & Augereau (2007) noted that the wave becomes sufficiently damped for that the size distribution can be approximated by , which matches our best-fitting thermal model of HD 92945. This agreement is surprising because our model suggests that most grains in the outer disk, which is the dominant contributor to the observed SED at µm (Figure 10), are smaller than µm and should therefore lie in the wavy part of the distribution. Our result may indicate that the wave is actually smaller and/or less extensive than predicted by Thébault & Augereau (2007) and that the size distribution follows the power law for grains as small as (A. Gáspár, personal communication).
Thébault et al. (2003) noted that the wavy structure in the size distribution is more pronounced for materials that are prone to cratering
rather than catastrophic fragmentation. If so, then softer and more absorptive grains like graphite may not easily account for both
the large µm (§5.1.2) and the monotonic size distribution obtained from our thermal model.
Of course, our model is based on the common a priori assumption of a power-law distribution without any regard to goodness-of-fit,
so we cannot discount any possible compositions of the dust without an exhaustive investigation of alternative size distributions.
5.1.4 Effects of Stellar Wind
Plavchan et al. (2005, 2009) studied the tangential and radial contributions of corpuscular stellar wind to the removal of grains in the debris disks of late-type dwarfs. They found that the tangential component (or “corpuscular drag”) is more important than Poynting–Robertson drag for K and M dwarfs whose mass-loss rates from stellar wind () are similar to the solar rate. Strubbe & Chiang (2006) obtained for AU Mic from their scattered light and thermal model of its disk, but they concluded that corpuscular drag is not a significant mechanism of grain removal from the disk because the grains are more quickly destroyed by mutual collisions within the dust’s “birth ring.” Plavchan et al. (2009) confirmed that the collisional lifetime of grains in the birth ring is times smaller than the timescale for removal by corpuscular drag, so stellar wind does not presently contribute to the evolution of AU Mic’s disk.
Wood et al. (2005) developed an empirical relationship between X-ray luminosity and for G, K, and M dwarfs with X-ray luminosities erg cm-2 s-1 and ages Myr. Although HD 92945’s X-ray luminosity of erg cm-2 s-1 is formally beyond the applicable range of this relation, we nonetheless apply the relation to determine whether stellar wind may be a contributing factor to the large observed in HD 92945’s disk. We find that , which implies that the stellar wind augments the radiation pressure on the grains by only % (Plavchan et al., 2009). In other words, HD 92945’s radiation and corpuscular wind together yield µm, which is 18 times smaller than obtained from our thermal model.
For to be consistent with , HD 92945’s mass-loss rate would have to be an implausible . However, if the stellar wind velocity was larger than assumed by Plavchan et al. (2009), then the required could be significantly reduced. This possibility is unlikely, however, because is approximately equal to the escape velocity, which is approximately constant for stars on the lower main sequence. We therefore conclude that neither corpuscular drag nor blow-out is responsible for the derived for HD 92945’s inner ring.
5.2 Disk Morphology
The other known neutrally scattering debris disk surrounds the A star HD 32297 (Mawet et al., 2009) and presents a nearly edge-on and highly asymmetric appearance that has alternately been attributed to collisional interaction with the interstellar medium (Kalas, 2005), the destruction of a large planetesimal (Grigorieva et al., 2007), or the resonant trapping of dust by an inner planet (Maness et al., 2008). Although HD 92945’s disk shows no significant asymmetry along its projected major axis, its morphology may represent an azimuthally smoother remnant of collisions within one or more planetesimal belts. In fact, the combination of an inner ring surrounded by a diffuse disk conforms very well to structures predicted by a variety of dynamical models that explore the evolution of debris disks as embedded planets form and/or migrate (Kenyon & Bromley, 2002, 2004; Wyatt, 2003, 2006; Thébault & Wu, 2008), or as the dust alone migrates in the face of radiation pressure and gas drag (Klahr & Lin, 2000; Takeuchi & Artymowicz, 2001). HD 92945’s age (Plavchan et al., 2009) and undetected H2 emission (Ingleby et al., 2009) suggest that the disk is largely depleted of gas, so we discount gas–dust coupling as a viable cause of the disk’s ringed structure.
5.2.1 Comparison with Dynamical Models
The surface brightness and density maps of HD 92945’s disk (Figure 6) strikingly resemble those produced by Kenyon & Bromley (2004) and Wyatt (2006) from their dynamical models of dust created from collisions of planetesimals confined to rings or planetary resonances. Kenyon & Bromley (2004) modeled the scenario in which the collisions occur in an expanding ring associated with an outwardly propagating wave of planet formation. At any given epoch, this scenario conforms to the “birth ring” concept of Strubbe & Chiang (2006). Wyatt (2006) considered an alternative scenario in which the colliding planetesimals are trapped in a gravitational resonance of an outwardly migrating planet. The resulting dust grains either remain in or migrate from resonance according to their size (or, more accurately, their associated value of ). In this model, Kuiper Belt grains with would fall out of resonance with a migrating Neptune but remain bound to the Sun in increasingly eccentric and axisymmetric orbits as they are scattered by multiple close encounters with the planet.
Whereas HD 92945’s inner ring may be readily described by such dynamical models, the precipitous decline in its surface brightness beyond 110 AU is more problematic. For example, Kenyon & Bromley (2004) initially considered a star with a quiescent disk having a surface-density profile at –150 AU, which after several hundred Myr remains smoothly asymptotic at large radii except when a ring, gap, or shadow passes through the region. Changes in the the initial parameters of the system affected the time scales but not the outcomes of the disk evolution. To reproduce HD 92945’s double-peaked surface-density profile (Figure 7), this model requires two concurrent waves of planet formation at the inner and outer edges of the imaged disk. Kenyon & Bromley (2004) showed that a close encounter with a passing star can also initiate a wave of planet formation at the inner edge of the disk, but we identify no such fly-by candidates in our HST and Spitzer images.444Five field sources are seen in the ACS/HRC F606W images obtained on UT 2004 December 1 and UT 2005 July 12, but all have motion relative to HD 92945 that is consistent with a distant background object. No field sources within of HD 92945 are seen in the broadband MIPS images. Therefore, the model of Kenyon & Bromley (2004) is probably insufficient to explain the apparently sharp boundaries of HD 92945’s disk.
The resonant-dust model of Wyatt (2006) accommodates sharp inner and outer edges of the disk if the grains have values of between those necessary for escape from the gravitational resonance and radiative expulsion from the disk. The former limit depends on the planet’s mass, so we can assess whether the different values of obtained from our thermal model of the inner ring and outer disk (§4.2) are consistent with the presence of a migrating planet between the star and the inner ring. If we crudely extrapolate plots of computed for a variety of solar-system grains with (Burns et al., 1979) and apply them to the dust surrounding HD 92945, then our value of µm in the outer disk indicates that for compact grains that leave the resonance. For a star like HD 92945, this lower limit of is consistent with a migrating planet of mass (Wyatt, 2006). This scenario implies that larger grains in the disk – like those confined by our thermal model to the inner ring – librate resonantly over a broad but finite range of azimuths.
Returning to the birth-ring scenario, Thébault & Wu (2008) found that the surface brightness of an optically thin dust disk of mass achieves a collisionally steady-state profile with no sharp outer edge. The smooth decline at large distances is mainly caused by the forced outward migration of small grains by radiation pressure. They also found that if either the migration or the production of small grains were somehow inhibited, then the disk would retain the sharp edge initially defined by the planetesimal belt. The former possibility does not apply to HD 92945 because its disk has very little mass (§4.3) and is optically thin, but the latter one may be relevant to both the morphology and large of the disk if it is dynamically cold. Thébault & Wu (2008) determined that the low eccentricities of bodies in dynamically cold disks not only reduce the production of small grains from destructive collisions of larger bodies, but also increase the destruction of small grains because the grains are more likely to collide with larger bodies as they are radiatively expelled from the disk. Although the potential link between a cold disk and large is intriguing, the low eccentricities needed for such a condition conflict with the high eccentricities of grains in the outer disk (caused perhaps by repeated encounters with a migrating planet) that likely produce the double-peaked surface-density profiles observed for HD 92945 (Figure 7) and modeled by Wyatt (2006).
5.2.2 Effect of Disk Inclination
The intermediate inclination of HD 92945’s disk makes our scattered-light model (§3.4) insensitive to the disk’s vertical thickness and its possible radial dependence. We are therefore unable to constrain the scale height of the disk, which is an indicator of its dynamical temperature and a means for assessing the relevance of the dynamical models just described. Moreover, the disk’s inclination inhibits the detection of small-scale clumps or perturbations like those seen in the disks of AU Mic (Krist et al., 2005) and Pic (Golimowski et al., 2006), which are viewed along their edges through extensive columns of dust. Consequently, we are unable to ascribe the apparent axisymmetry of the dust to the dominance of radiation pressure in a quiescent disk, a temporary lull in the stochastic collisions of planetesimals, or some other process. Resolved images of the disk at far-infrared or submillimeter wavelengths would allow us to determine whether the axisymmetry persists over a large range of particle sizes and whether resonant trapping of planetesimals dust by a migrating planet is indeed a viable explanation for the observed surface density of the disk (Wyatt, 2006).
6 Summary and Concluding Remarks
Our ACS/HRC coronagraphic images of HD 92945 reveal an inclined axisymmetric debris disk comprising an inner ring 0–30 (43–65 AU) from the star and a faint outer disk with average F606W (Broad ) and F814W (Broad ) surface brightness profiles declining as for 0–51 (65–110 AU) and for 1–67 (110–145 AU). The sharp break in the profiles at 110 AU suggests that the disk is truncated at that distance. The observed relative surface-density profile is peaked at both the inner ring and the outer edge of the disk. This morphology is unusual among the 15 other disks that have been spatially resolved in scattered light, which typically exhibit either solitary rings with sharp edges (e.g., HR 4796A and Fomalhaut) or asymmetric nebulosity with indefinite outer limits (e.g., Pic and HD 61005). Only HD 181327 has an axisymmetric ring and extended nebulosity somewhat akin to HD 92945’s disk, but its nebulosity is asymmetric and has a steep (but not truncated) surface brightness profile within AU (Schneider et al., 2006).
The dust in HD 92945’s outer disk scatters neutrally and isotropically in the and bands. These characteristics contradict current optical models of compact and porous grains, which predict that grains larger than a few microns are neutral scatterers and submicron-sized grains are isotropic scatterers at these wavelengths. The disk’s anomalously low -band albedo (%) also suggests a large population of submicron-sized grains. If grains smaller than a few microns are absent, then stellar radiation pressure may be the cause only if the dust is composed of highly absorptive materials like graphite. Optical models of compact silicate grains suggest a maximum blow-out size of µm, and this size decreases as porosity increases (Mukai et al., 1992).
Our Spitzer MIPS and IRS measurements reveal no significant infrared excess from HD 92945’s disk shortward of 30 µm, and they constrain the width of the 70 µm source to AU. Assuming that the dust comprises compact grains of astronomical silicate confined to the disk imaged with ACS, we modeled the 24–350 µm emission with a grain-size distribution and µm throughout the disk, but with µm and 50 µm in the inner ring and outer disk, respectively. Combining these thermal constraints with the albedo and surface-density profile obtained from our ACS images, we obtain an integrated dust mass of .
Conflicting indicators of minimum grain size are not unique to HD 92945. Krist et al. (2010) reported that the narrow ring around the G0 V star HD 207129 exhibits both isotropic scattering and very low albedo (%), but its far-infrared SED is adequately modeled with silicate grains with µm and . As in the case of HD 92945, this value of greatly exceeds the radiative blow-out size for the host star, and is significantly steeper than the traditional representation for a steady-state collisional cascade (Dohnanyi, 1969). The results for HD 92945 and HD 207129 are based on reliable and well-calibrated HST and Spitzer data, so it appears that the conflicting indicators stem from an incomplete understanding of the composition and optical properties of compact and porous grains around low-mass stars. Current grain models indicate that the scattering asymmetry parameter and albedo are insufficiently sensitive to composition and porosity to account for our observational results, but some contradictory trends demand that caution be exercised when applying the models to observational data. As demonstrated by Graham et al. (2007) for AU Mic, polarimetric imaging of HD 92945’s disk may provide definitive constraints on the sizes and porosity of the grains and thus avoid some ambiguities of the grain models.
HD 92945’s disk morphology is remarkably like those predicted from dynamical models of dust produced from collisions of planetesimals perturbed by coalescing or migrating planets. The planet-resonance model of (Wyatt, 2006) is particularly intriguing because it yields, for a plausible range of grain sizes, a double-peaked surface density profile that resembles the observed profile of HD 92945’s disk. Furthermore, this model predicts differences between the size distributions of grains that remain in the resonance in which they were created and those that leave the resonance on bound, axisymmetric orbits because of radiation pressure. Such spatial segregation by grain size may be relevant to our thermal model of HD 92945’s infrared SED, which requires two components of dust distinguished by values of that are 18 times larger in the inner ring than in the outer disk in order to match the observed 70, 160, and 350 µm fluxes.
As Wyatt (2006) has advocated and as existing multiband images of the disks around Pic, Vega, and Fomalhaut have shown, resolved images over a broad spectral range are needed to constrain the composition and location of the HD 92945’s dust, as well as the mechanism(s) responsible for the disk’s morphology at each wavelength. The high-resolution infrared and millimeter imaging capabilities of the Herschel Observatory and the Atacama Large Millimeter Array (ALMA) are well suited for determining the location or distribution of the unresolved thermal emission detected with Spitzer. If the planet-resonance model of Wyatt (2006) applies to HD 92945, then Herschel and ALMA images should reveal increasing concentrations of resonant dust as the imaging wavelength increases. Constraining the location of the resonances would in turn constrain the mass and location of a putative migrating planet, which, at an age of Myr and possible mass of only a few (§5.2.1), may not be directly detected with a high-resolution, near-infrared coronagraph such as that used to image the younger giant planet Pic b (Lagrange et al., 2010).
Given the demise of the ACS/HRC and the uncertain future of NICMOS, the next likely opportunity for imaging HD 92945’s disk in
scattered light will follow the launch of the James Webb Space Telescope. JWST’s Near-Infrared Camera and Tunable
Filter Imager will provide coronagraphic imaging from 1.5–5.0 µm, which together with our ACS images will permit an assessment
of the chromatic dependence of the albedo, color, and scattering asymmetry of the dust over nearly a decade of wavelengths.
Coronagraphic imaging with JWST’s Mid-Infrared Instrument (MIRI) will probably be less fruitful, as Spitzer observations
have shown no significant excess flux from dust shortward of 30 µm. However, MIRI will be useful for assessing the presence
and characteristics of an infant planetary system. That said, more immediately accessible 450 and 850 µm ground-based
photometry would help to constrain the submillimeter end of HD 92945’s SED and, consequently, the distribution and size limits of
grains in the inner ring and outer disk.
References
- Ardila et al. (2004) Ardila, D. R., et al. 2004, ApJ, 617, L147
- Augereau et al. (1999) Augereau, J. C., Lagrange, A.-M., Mouillet, D., & Ménard, F. 1999, A&A, 350, L51
- Backman & Paresce (1993) Backman, D. E., & Paresce, F. 1993, in Protostars and Planets III, ed. E. H. Levy & J. I. Lunine (Tucson: University of Arizona), 1253
- Burns et al. (1979) Burns, J. A., Lamy, P. L., & Soter, S. 1979, Icarus, 40, 1
- Campo Bagatin et al. (1994) Burns, J. A., Lamy, P. L., & Soter, S. 1979, Icarus, 40, 1
- Castelli & Kurucz (2003) Castelli, F., & Kurucz, R. L. 2003, in Proc. IAU Symp. 210, eds. N. Piskunov, W. W. Weiss, & D. F. Gray (San Francisco: ASP), A20
- Chiang et al. (2009) Chiang, E., Kite, E., Kalas, P., Graham, J. R., & Clampin, M. 2009, ApJ, 693, 734
- Chen et al. (2005) Chen, C. H., et al. 2005, ApJ, 634, 1372
- Clampin et al. (2003) Clampin, M., et al. 2003, AJ, 126, 385
- Colbert et al. (2010) Colbert, J., et al. 2010, MIPS Instrument Handbook, Version 2.0 (Pasadena: SSC)
- Decin et al. (2003) Decin, G., Dominik, C., Waters, L. B. F. M., & Waelkens, C. 2003, ApJ, 598, 636
- Dohnanyi (1969) Dohnanyi, J. W. 1969, J. Geophys. Res., 74, 2531
- ESA (1997) ESA, 1997, The Hipparcos and Tycho Catalogues, ESA SP-1200
- Fitzgerald et al. (2007) Fitzgerald, M. P., Kalas, P. G., Duchêne, G., Pinte, C., & Graham, J. R. 2007, ApJ, 670, 536
- Ford et al. (2003) Ford, H. C., et al. 2003, Proc. SPIE, 4854, 81
- Gilliland (2004) Gilliland, R. L. 2004, Instrument Science Report ACS 2004-01 (Baltimore: STScI)
- Golimowski et al. (2006) Golimowski, D. A., et al. 2006, AJ, 131, 3109
- Graham et al. (2007) Graham, J. R., Kalas, P. G., & Matthews, B. C. 2007, ApJ, 654, 595
- Grigorieva et al. (2007) Grigorieva, A., Artymowicz, P., & Thébault, P. 2007, A&A, 461, 537
- Gordon et al. (2005) Gordon, K. D., et al. 2005, PASP, 117, 503
- Hage & Greenberg (1990) Hage, J. I., & Greenberg, J. M. 1990, ApJ, 361, 251
- Heim et al. (1998) Heim, G. B., et al. 1998, Proc. SPIE, 3356, 985
- Henyey & Greenstein (1941) Henyey, L. G., & Greenstein, J. L. 1941, ApJ, 93, 70
- Hillenbrand et al. (2008) Hillenbrand, L. A., et al. 2008, ApJ, 677, 630
- Hines et al. (2007) Hines, D. C., et al. 2007, ApJ, 671, L165
- Holland et al. (1998) Holland, W. S., et al. 1998, Nature, 392, 788
- Houck et al. (2004) Houck, J. R., et al. 2004, Proc. SPIE, 5487, 62
- Ingleby et al. (2009) Ingleby, L., et al. 2009, ApJ, 703, L137
- Jura (1991) Jura, M. 1991, ApJ, 383, L79
- Kalas (2005) Kalas, P. 2005, ApJ, 635, L169
- Kalas et al. (2007a) Kalas, P., Duchene, G., Fitzgerald, M. P., & Graham, J. R. 2007, ApJ, 671, L161
- Kalas et al. (2007b) Kalas, P., Fitzgerald, M. P., & Graham, J. R. 2007, ApJ, 661, L85
- Kalas et al. (2005) Kalas, P., Graham, J. R., & Clampin, M. 2005, Nature, 435, 1067
- Kalas et al. (2006) Kalas, P., Graham, J. R., Clampin, M., & Fitzgerald, M. P. 2006, ApJ, 637, L57
- Kalas et al. (2004) Kalas, P., Liu, M. C., & Matthews, B. C. 2004, Science, 303, 1990
- Kennedy & Kenyon (2008) Kennedy, G. M., & Kenyon, S. J. 2008, ApJ, 673, 502
- Kenyon & Bromley (2002) Kenyon, S. J., & Bromley, B. C. 2002, ApJ, 577, L35
- Kenyon & Bromley (2004) Kenyon, S. J., & Bromley, B. C. 2004, AJ, 127, 513
- Klahr & Lin (2000) Klahr, H. H., & Lin, D. N. C. 2000, ApJ, 554, 1095
- Köhler et al. (2007) Köhler, M., Minato, T., Kimura, H., & Mann, I. 2007, Adv. Space Res., 40, 266
- Krist (2000) Krist, J. 2000, Instrument Science Report ACS 2000-04 (Baltimore: STScI)
- Krist (2002) Krist, J. 2002, Instrument Science Report ACS 2002-11 (Baltimore: STScI)
- Krist (2006) Krist, J. 2006, Tiny Tim/Spitzer User’s Guide (Pasadena: SSC)
- Krist & Hook (2004) Krist, J., & Hook, R. 2004, The Tiny Tim User’s Guide, Version 6.3 (Baltimore: STScI)
- Krist et al. (2005) Krist, J. E., et al. 2005, AJ, 129, 1008
- Krist et al. (2010) Krist, J. E., et al. 2010, AJ, 140, 1051
- Krist et al. (2003) Krist, J. E., Hartig, G. F., Clampin, M., Golimowski, D. A., Ford, H. C., & Illingworth, G. D. 2003, Proc. SPIE, 4860, 20
- Krivov et al. (2006) Krivov, A. V., Löhne, T., & Sremčević, M. 2006, A&A, 455, 509
- Lagrange et al. (2000) Lagrange, A.-M., Backman, D. E., & Artymowicz, P. 2000, in Protostars and Planets IV, ed. V. Mannings, A.P. Boss, & S. S. Russell (Tucson: University of Arizona), 639
- Lagrange et al. (2010) Lagrange, A.-M., et al. 2010, Science, 329, 57
- Laidler et al. (2005) Laidler, V. et al. 2005, Synphot User’s Guide, Version 5.0 (Baltimore: STScI)
- Laor & Draine (1993) Laor, A., & Draine, B. T. 1993, ApJ, 402, 441
- Li & Greenberg (1998) Li, A., & Greenberg, J. M. 1998, A&A, 331, 291
- Li & Lunine (2003a) Li, A., & Lunine, J. I. 2003a, ApJ, 590, 368
- Li & Lunine (2003b) Li, A., & Lunine, J. I. 2003b, ApJ, 594, 987
- Li et al. (2003) Li, A., Lunine, J. I., & Bendo, G. J. 2003, ApJ, 598, L51
- López-Santiago et al. (2006) López-Santiago, J., Montes, D., Crespo-Chacón, I., & Fernández-Figueroa, M. J. 2006, ApJ, 643, 1160
- Mamajek & Hillenbrand (2008) Mamajek, E. E., & Hillenbrand, L. A. 2008, ApJ, 687, 1264
- Maness et al. (2009) Maness, H. L., et al. 2009, ApJ, 707, 1098
- Maness et al. (2008) Maness, H. L., Fitzgerald, M. P., Paladini, R., Kalas, P., Duchene, G.& Graham, J. R. 2008, ApJ, 686, L25
- Mawet et al. (2009) Mawet, D., Serabyn, E., Stapelfeldt, K., & Crepp, J. 2009, ApJ, 702, L47
- Maybhate et al. (2010) Maybhate, A., et al. 2010, ACS Instrument Handbook, Version 10.0 (Baltimore: STScI)
- Meurer et al. (2002) Meurer, G. R., et al. 2002, in 2002 HST Calibration Workshop, eds. S. Arribas, A. Koekemoer, and B. Whitmore (Baltimore: STScI), 65
- Meyer et al. (2007) Meyer, M. R., Backman, D. E., Weinberger, A. J., & Wyatt, M. C. 2007, in Protostars and Planets V, eds. B. Reipurth, D. Jewitt, and K. Keil (Tucson: University of Arizona), 573
- Mukai et al. (1992) Mukai, T., Ishimoto, H., Kozasa, T., Blum, J., & Greenberg, J. M. 1992, A&A, 262, 315
- Müller et al. (2010) Müller, S., Löhne, T., & Krivov, A. V. 2010, ApJ, 708, 1728
- Pavlovsky et al. (2006) Pavlovsky, C., et al. 2006, ACS Data Handbook, Version 5.0 (Baltimore: STScI)
- Plavchan et al. (2005) Plavchan, P., Jura, M., & Lipscy, S. J. 2005, ApJ, 631, 1161
- Plavchan et al. (2009) Plavchan, P., Werner, M. W., Chen, C. H., Stapelfeldt, K. R., Su, K. Y. L., Stauffer, J. R., & Song, I. 2009, ApJ, 698, 1068
- Saija et al. (2003) Saija, R., Iatì, M. A., Giusto, A., Borghese, F., Denti, P., Aiello, S., & Cecchi–Pestellini, C. 2003, MNRAS, 341, 1239
- Schneider et al. (1999) Schneider, G., et al. 1999, ApJ, 513, L127
- Schneider et al. (2006) Schneider, G., et al. 2006, ApJ, 650, 414
- Schneider et al. (2005) Schneider, G., Silverstone, M. D., & Hines, D. C. 2005, ApJ, 629, L117
- Shen et al. (2009) Shen, Y., Draine, B. T., & Johnson, E. T. 2009, ApJ, 696, 2126
- Silverstone (2000) Silverstone, M. D. 2000, Ph.D. thesis, Univ. California at Los Angeles
- Sirianni et al. (2005) Sirianni, M., et al. 2005, PASP, 117, 1049
- Skrutskie et al. (1997) Skrutskie, M. F., et al. 1997, in The Impact of Large Scale Near-IR Surveys, ed. F. Garzon (Dordrecht: Kluwer), 25
- Smith et al. (1992) Smith, B. A., Fountain, J. W., & Terrile, R. J. 1992, A&A, 261, 499
- Smith & Terrile (1984) Smith, B. A., & Terrile, R. J. 1984, Science, 226, 1421
- Stapelfeldt et al. (2011) Stapelfeldt, K. R., et al. 2011, in prep.
- Strubbe & Chiang (2006) Strubbe, L., & Chiang, E. 2006, ApJ, 648, 652
- Takeuchi & Artymowicz (2001) Takeuchi, T., & Artymowicz, P. 2001, ApJ, 557, 990
- Thatte et al. (2009) Thatte, D., et al. 2009, NICMOS Data Handbook, Version 8.0 (Baltimore: STScI)
- Thébault & Augereau (2007) Thébault, P., & Augereau, J.-C. 2007, A&A, 472, 169
- Thébault et al. (2003) Thébault, P., Augereau, J.-C., & Beust, H. 2003, A&A, 408, 775
- Thébault & Wu (2008) Thébault, P., & Wu, Y. 2008, A&A, 481, 713
- Viana et al. (2009) Viana, A., et al. 2009, NICMOS Instrument Handbook, Version 11.0 (Baltimore: STScI)
- Voshchinnikov et al. (2005) Voshchinnikov, N. V., Il’in, V. B., & Henning, T. 2005, A&A, 429, 371
- Weinberger et al. (1999) Weinberger, A. J., Becklin, E. E., Schneider, G., Smith, B. A., Lowrance, P. J., Silverstone, M. D., Zuckerman, B., & Terrile, R. J. 1999, ApJ, 525 L53
- Wood et al. (2005) Wood, B. E., Müller, H.-R., Zank, G. P., Linsky, J. L., & Redfield, S. 2005, ApJ, 628, L143
- Wyatt (2003) Wyatt, M. C. 2003, ApJ, 598, 1321
- Wyatt (2006) Wyatt, M. C. 2006, ApJ, 639, 1153
- Wyatt (2008) Wyatt, M. C. 2008, ARA&A, 46, 339
- Zuckerman (2001) Zuckerman, B. 2001, ARA&A, 39, 549
- Zuckerman et al. (1995) Zuckerman, B., Forveille, T., & Kastner, J. H. 1995, Nature, 373, 494
- Zuckerman & Song (2004) Zuckerman, B., & Song, I. 2004, ApJ, 603, 738
| Spectral | Fractional Luminosity | Imaging Informationaa Pertains to the first published scattered-light images of the disks.
REFERENCES.– (1) Decin et al. 2003; (2) Jura 1991; (3) Zuckerman et al. 1995; (4) Plavchan et al. 2009; (5) Hillenbrand et al. 2008; (6) Silverstone 2000; (7) Zuckerman & Song 2004; (8) Schneider et al. 2006; (9) Smith & Terrile 1984; (10) Schneider et al. 1999; (11) Augereau et al. 1999; (12) Weinberger et al. 1999; (13) Kalas et al. 2004; (14) Ardila et al. 2004; (15) Kalas et al. 2005; (16) Schneider et al. 2005; (17) Kalas et al. 2006; (18) Kalas et al. 2007b; (19) Kalas et al. 2007a; (20) Hines et al. 2007; (21) Krist et al. 2010; (22) Stapelfeldt et al. 2011; (23) this paper. |
|||||
|---|---|---|---|---|---|---|---|
| Host Star | Type | log() | Ref. | Telescope | Coronagraph | Ref. | |
| Pic | A5 V | 1 | Dupont 2.5 m | Seeing-limited | 9 | ||
| HR 4796A | A0 V | 2 | HST | NICMOS | 10 | ||
| HD 141569A | B9.5 Ve | 3 | HST | NICMOS | 11,12 | ||
| AU Mic | M1 Ve | 4 | UH 2.2 m | Seeing-limited | 13 | ||
| HD 107146 | G2 V | 5 | HST | ACS/HRC | 14 | ||
| Fomalhaut | A3 V | 6 | HST | ACS/HRC | 15 | ||
| HD 32297 | A0 V | 6 | HST | NICMOS | 16 | ||
| HD 53143 | K1 V | 7 | HST | ACS/HRC | 17 | ||
| HD 139664 | F5 V | 7 | HST | ACS/HRC | 17 | ||
| HD 181327 | F5.5 V | 8 | HST | NICMOS, ACS/HRC | 8 | ||
| HD 15115 | F2 V | 7 | HST | ACS/HRC | 18 | ||
| HD 15745 | F2 V | 7 | HST | ACS/HRC | 19 | ||
| HD 61005 | G8 V | 5 | HST | NICMOS | 20 | ||
| HD 207129 | G0 V | 7 | HST | ACS/HRC | 21 | ||
| HD 10647 | F9 V | 7 | HST | ACS/HRC | 22 | ||
| HD 92945 | K1 V | 4 | HST | ACS/HRC | 23 | ||