Unifying boxy bulge and planar long bar in the Milky Way
Abstract
It has been known for some time that the Milky Way is a barred disk galaxy. More recently several studies inferred from starcount observations that the Galaxy must contain a separate, new, flat long bar component, twisted relative to the barred bulge. Here we use a simulation with a boxy bulge and bar to suggest that these observations can be reproduced with a single structure. In this simulation a stellar bar evolved from the disk, and the boxy bulge originated from it through secular evolution and the buckling instability. We calculate starcount distributions for this model at different longitudes and latitudes, in a similar way as observers have done for resolved starcounts. Good agreement between the simulation and the observations can be achieved for a suitable snapshot, even though the simulation has a single boxy bulge and bar structure. In this model, part of the long bar signature is due to a volume effect in the starcounts, and another part is due to chosing a snapshot in which the planar part of the boxy bulge and bar has developed leading ends through interaction with the adjacent spiral arm heads. We also provide predictions from this model for the line-of-sight velocity distributions at the longitudes with the long bar signature, for comparison with upcoming surveys.
Subject headings:
Galaxy: structure — Galaxy: bulge — Galaxy: kinematics and dynamics1. Introduction
During the last decades it has become clear that our Galaxy (hereafter, the MW) is a barred system, as first suggested by de Vaucouleurs (1964). Now we have good evidence from NIR photometry (Dwek et al., 1995; Binney et al., 1997), star counts (Stanek et al., 1997; López-Corredoira et al., 2005), gas kinematics (Englmaier & Gerhard, 1999; Fux, 1999), microlensing (Hamadache et al., 2006) and dynamical effects near the solar circle (Dehnen, 2000; Minchev et al., 2007). Several of these works refer to the boxy bulge which ends at a galactic radius of kpc, even though in some models for the observed data (e.g., Binney et al., 1997) it is clear that the MW bar extends further in the Galactic plane.
Such a single boxy bulge and bar structure consisting of a boxy bulge and a planar bar continuation is a characteristic outcome of the secular evolution of barred galaxies (Athanassoula, 2005), where the bar eventually buckles and forms a boxy-bulge (e.g., Combes et al., 1990; Raha et al., 1991). After the buckling event the bar resumes its evolution and continues to grow slowly through angular momentum exchange between bar, disk and dark matter halo (e.g. Lynden-Bell & Kalnajs, 1972; Athanassoula, 2003; Debattista & Sellwood, 2000; Martinez-Valpuesta et al., 2006, MV06).
The MW’s boxy bulge and bar has its long axis in the first quadrant, at an angle with respect to the Sun-Galactic center line (Gerhard, 2002). But more recently star count observations extending to greater longitudes have led to surprising results (Benjamin et al., 2005; Cabrera-Lavers et al., 2007, 2008; Churchwell et al., 2009, hereafter B05,C07,C08,C09), confirming an earlier analysis by Hammersley et al. (2000): these observations found indications for a separate long bar with an orientation of , extending from longitude to ( kpc to kpc galactocentric radius), and therefore coexisting with the conventional Galactic boxy bulge and bar over a range of radii. This interpretation, if correct, would dynamically be quite puzzling: two separate rotating bars should align with each other through dynamical coupling in at most a few rotation periods.
In this letter we show that a separate inferred long bar does not necessarily follow from the star count data, and we suggest a plausible model to explain these data with a single barred structure whose inner parts represent the boxy bulge. We also show some predictions for radial velocity distributions that could be used to test this model in the near future.
2. A model for the Milky Way’s bar and bulge formed through secular evolution
The simulation used in this work is similar to that published in MV06 and has not been run to match the MW structure. The code used is FTM 4.4 (updated version) from Heller & Shlosman (1994). The total number of particles is , distributed initially in an exponential disk with , embedded in a live dark matter halo. After Gyr the bar becomes very strong and buckles, thereby weakening. Later the bar resumes its evolution and grows again, resulting in a prominent boxy bulge and bar structure.
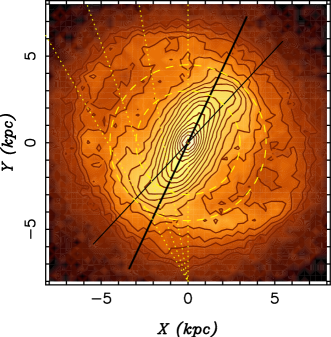
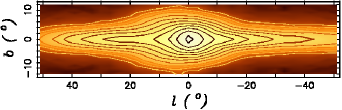
We consider the simulated galaxy at time Gyr, after the boxy bulge has formed and the bar has regrown. The density distribution for this snapshot is shown in Figure 1a, oriented at an angle with respect to the line from the Galactic center to the observer. The boxy bulge is apparent in Figure 1b. The model is scaled so that the end of the planar bar appears just inside longitude as seen from the observer. The bar length is kpc, and the maximum ellipticity is . Relative to the planar bar, the boxy bulge is larger in in the scaled model than in the MW, as measured by comparing the maxima in the asymmetry map with those from the COBE data (Bissantz et al., 1997; Bissantz & Gerhard, 2002). Also both the boxy bulge and the disk are vertically more extended in the model. The Sun is placed at kpc.
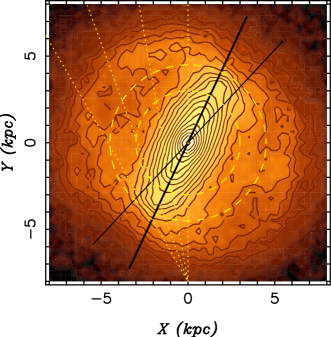
In the face-on view we can easily identify the curved, leading ends of the stellar bar. Over a period of 1.2 Gyr, the model shows oscillations from leading through straight to trailing ends and back. The bar spends 40% of this time in the leading phases. Similar morphology can be seen in other barred simulations in the literature (e.g. Fux, 1997, model m08) and also in some observed galaxies such as NGC 3124 (Efremov, 2011) and NGC 3450 (Buta et al., 2007). The oscillations between trailing and leading ends of the bar could be related to the oscillations seen in the bar growth in N-body simulations (e.g. Dubinski et al., 2009) and may be due to non-linear coupling modes between the bar and spiral arms (Tagger et al., 1987). This topic is beyond the scope of this paper. For comparison we show a snapshot at a later time in this simulation where the ends of the bar are straight and the spiral arms appear to emerge from them (Figure 2).
2.1. Quantitative analysis: no separate ’long bar’ is needed
We apply a similar technique as was used to identify two different barred structures in the MW from star count data (B05,C07,C08,C09). We view the projected model as an observer in the disk at kpc distance from the center would see it. To increase the particle resolution, we symmetrize the model vertically and divide the (longitude, latitude)-()-space into bins of and , respectively. Then we count particles in each of the corresponding cones and bin these particles in distance modulus, with . The distance modulus is given by .
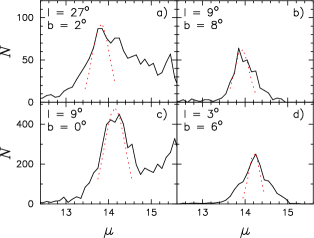
In Figure 3 we show histograms in for several lines-of-sight. To quantify the distribution of particles with and to assign a distance value to the maximum number counts, we fit a Gaussian to the left-most peak, i.e., the one nearest to the observer. In the histogram obtained when looking towards the ends of the bar in the Galactic plane (Figure 3a) we can identify three main peaks, one corresponding to the bar, one to a spiral arm in the back, and one to the end of the disk. The -value of the fitted maximum corresponds to the end of the bar, where the bar is flat. The second histogram for (Figure 3b) shows the distribution of stars in a field well above the plane where the boxy bulge dominates. The fitted maximum corresponds to a position on the thick line in Figure 1 at . In the first panel we can clearly identify the particles in the disk, but in the second showing the higher latitude field, disk particles are absent. We also show the histogram for (Figure 3c), where we can see the increment in the number of particles with respect to those at , and the displacement of the maximum towards larger distance in comparison with . In the last panel we show one of the central lines-of-sight for the boxy bulge.
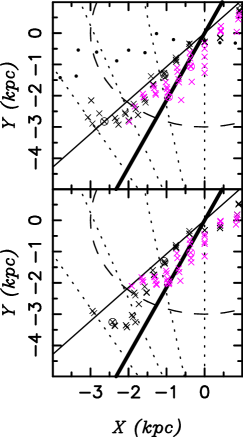
Repeating the identification of maxima for all fields in and , we produce a similar plot as in C07. The distance modulus for each maximum is converted to distance in kpc from the observer’s position and plotted in Figure 4 in galactocentric coordinates. We show such a plot both for the snapshot with leading bar ends (Figure 4a, corresponding to Figure 1), and for the snapshot with straight ends (Figure 4b, corresponding to Figure 2). In both models, the points computed from star counts above the plane (pink crosses) follow the heavy line indicating the true orientation angle fixed by us for the model’s boxy bulge and bar, except at the very center and at negative where the maxima are closer to the observer due to tangent point effects.
For lower latitudes (black crosses), the points move further back. In both models, for longitudes in the region of the boxy bulge, points in the plane now approximately follow an imaginary line with . This is due to a volume effect combined with the shallow disk density distribution: . There is an intermediate region with , where the boxy bulge becomes thinner and transits into the planar bar, and then there is a region, ( to kpc), where we can see just particles in the plane. In this region, both models differ: the volume effect alone, as illustrated for the bar with the straight ends in Figure 4b, accounts for only half the shift from to . Whereas for the snapshot with the leading bar ends (Figure 4a) the in-plane points now approximately follow the imaginary line right until the end of the bar is reached. If we were not aware of the original structure of the model, the results shown in Figure 4 could easily be interpreted as evidence for a model with two structures, one thicker and shorter at and another thinner and longer at . Clearly, the case discussed shows that a separate long bar is not necessarily implied by the observed star count distributions and that a single boxy bulge and bar structure is a valid and dynamically simpler interpretation of these data.
3. Radial velocity predictions
Several large radial velocity surveys of Galactic bulge and disk stars are currently on-going or planned, and we thus provide some predictions for our model. We scale the average circular velocity curve of the model to the data of Clemens (1985) for radii 3-4.5 kpc, and then compute the radial velocities at different longitudes as seen from the Sun (assuming =250 km/s; Reid et al., 2009). We show the mean velocity, dispersion, and particle number vs. distance modulus in Figure 5 for two in-plane positions near the end of the planar bar. The non-circular motions in the barred models leave a clear signature at compared with the initial axisymmetric disk. In this range the bar’s velocity profile is flat. For the leading-ends bar it has a break at and then increases towards an axisymmetric type of profile. For the straight-ends bar the break happens earlier and the radial velocities are slightly smaller. The difference between axisymmetric and bar case is km/s. The velocity dispersions of both bar models in the two fields are higher by km/s for all . Also note the difference between the star counts with between the three models.
Velocities in the boxy bulge are outside the scope of this paper; they have already been studied with a similar N-body simulation by Shen et al. (2010) and compared with results from the BRAVA survey.

4. Summary and Conclusions
We have analyzed star counts in the inner Galaxy using an N-body model which arose from secular evolution of a disk galaxy, a natural mechanism for galaxies like ours. The bar and buckling instabilities in the stellar disk lead to a boxy bulge which extends to a longer in-plane bar. The bar couples with the spiral arms in the disk, giving rise alternately to leading, straight or trailing bar ends.
As seen from within the disk at 8 kpc from the center, the maxima of the line-of-sight distance distributions in the Galactic plane occur at distances somewhat further than the maxima of the line-of-sight density distributions, due to the volume effect in the star counts. Assuming a plausible orientation (), this explains part of the observational signature which was previously used to infer the existence of a second long bar. If in addition we choose a model snapshot where the bar has leading ends, most of the long bar signature in the star count data can be reproduced. While not made specially to match the MW, this model thus illustrates that the traditional Galactic bar (the boxy bulge) and the more recently inferred long bar can plausibly be explained by a single boxy bulge and bar structure.
To test this further we have determined the dependence of the mean radial velocity and velocity dispersion on distance modulus in Galactic plane fields near the inferred end of the planar bar. These illustrate the differences between the barred model and an axisymmetric rotating disk, which can be compared with upcoming radial velocity survey data for the inner MW. Future work should also address in more detail the spiral arm - bar interaction which gives rise to the curved ends of the bar, and aim at constructing a more detailed dynamical model allowing us to understand better the structure and evolution of the inner Milky Way.
Acknowledgments
We thank Ken Freeman for helpful discussions about this work. IMV thanks Peter Hammersley for discussions on the MW.
References
- Athanassoula (2003) Athanassoula, E. 2003, MNRAS, 341, 1179
- Athanassoula (2005) Athanassoula, E. 2005, MNRAS, 358, 1477
- Benjamin et al. (2005) Benjamin, R. A., et al. 2005, ApJ, 630, L149
- Binney et al. (1997) Binney, J., Gerhard, O., & Spergel, D. 1997, MNRAS, 288, 365
- Bissantz et al. (1997) Bissantz, N., Englmaier, P., Binney, J., & Gerhard, O. 1997, MNRAS, 289, 651
- Bissantz & Gerhard (2002) Bissantz, N., & Gerhard, O. 2002, MNRAS, 330, 591
- Buta et al. (2007) Buta, R. J., Corwin, H. G., & Odewahn, S. C. 2007, The de Vaucouleurs Altlas of Galaxies (Cambridge University Press)
- Cabrera-Lavers et al. (2008) Cabrera-Lavers, A., González-Fernández, C., Garzón, F., Hammersley, P. L., & López-Corredoira, M. 2008, A&A, 491, 781
- Cabrera-Lavers et al. (2007) Cabrera-Lavers, A., Hammersley, P. L., González-Fernández, C., López-Corredoira, M., Garzón, F., & Mahoney, T. J. 2007, A&A, 465, 825
- Churchwell et al. (2009) Churchwell, E., et al. 2009, PASP, 121, 213
- Clemens (1985) Clemens, D. P. 1985, ApJ, 295, 422
- Combes et al. (1990) Combes, F., Debbasch, F., Friedli, D., & Pfenniger, D. 1990, A&A, 233, 82
- de Vaucouleurs (1964) de Vaucouleurs, G. 1964, in IAU Symposium, Vol. 20, The Galaxy and the Magellanic Clouds, ed. F. J. Kerr, 195–+
- Debattista & Sellwood (2000) Debattista, V. P., & Sellwood, J. A. 2000, ApJ, 543, 704
- Dehnen (2000) Dehnen, W. 2000, AJ, 119, 800
- Dubinski et al. (2009) Dubinski, J., Berentzen, I., & Shlosman, I. 2009, ApJ, 697, 293
- Dwek et al. (1995) Dwek, E., et al. 1995, ApJ, 445, 716
- Efremov (2011) Efremov, Y. N. 2011, Astronomy Reports, 55, 108
- Englmaier & Gerhard (1999) Englmaier, P., & Gerhard, O. 1999, MNRAS, 304, 512
- Fux (1997) Fux, R. 1997, A&A, 327, 983
- Fux (1999) —. 1999, A&A, 345, 787
- Gerhard (2002) Gerhard, O. 2002, in Astronomical Society of the Pacific Conference Series, Vol. 273, The Dynamics, Structure & History of Galaxies, ed. G. S. Da Costa & H. Jerjen, 73–+
- Hamadache et al. (2006) Hamadache, C., et al. 2006, A&A, 454, 185
- Hammersley et al. (2000) Hammersley, P. L., Garzón, F., Mahoney, T. J., López- Corredoira, M., & Torres, M. A. P. 2000, MNRAS, 317, L45
- Heller & Shlosman (1994) Heller, C. H., & Shlosman, I. 1994, ApJ, 424, 84
- López-Corredoira et al. (2005) López-Corredoira, M., Cabrera-Lavers, A., & Gerhard, O. E. 2005, A&A, 439, 107
- Lynden-Bell & Kalnajs (1972) Lynden-Bell, D., & Kalnajs, A. J. 1972, MNRAS, 157, 1
- Martinez-Valpuesta et al. (2006) Martinez-Valpuesta, I., Shlosman, I., & Heller, C. 2006, ApJ, 637, 214
- Minchev et al. (2007) Minchev, I., Nordhaus, J., & Quillen, A. C. 2007, ApJ, 664, L31
- Raha et al. (1991) Raha, N., Sellwood, J. A., James, R. A., & Kahn, F. D. 1991, Nature, 352, 411
- Reid et al. (2009) Reid, M. J., et al. 2009, ApJ, 700, 137
- Shen et al. (2010) Shen, J., Rich, R. M., Kormendy, J., Howard, C. D., De Propris, R., & Kunder, A. 2010, ApJ, 720, L72
- Stanek et al. (1997) Stanek, K. Z., Udalski, A., Szymanski, M., Kaluzny, J., Kubiak, M., Mateo, M., & Krzeminski, W. 1997, ApJ, 477, 163
- Tagger et al. (1987) Tagger, M., Sygnet, J. F., Athanassoula, E., & Pellat, R. 1987, ApJ, 318, L43