Formation of Dust in the Ejecta of Type Ia Supernovae
Abstract
We investigate the formation of dust grains in the ejecta of Type Ia supernovae (SNe Ia), adopting the carbon-deflagration W7 model. In the calculations of dust formation, we apply the nucleation and grain growth theory and consider the two cases with and without formation of CO and SiO molecules. The results of the calculations show that for the sticking probability of 1, C, silicate, Si, and FeS grains can condense at early times of 100–300 days after the explosion, whereas Fe and SiC grains cannot form substantially. Due to the low gas density in SNe Ia with no H-envelope, the average radii of the newly formed grains are generally below 0.01 m, being much smaller than those in Type II-P SNe. This supports our previous conclusion that the radius of dust formed in the ejecta is smaller in SNe with less massive envelopes. The total dust mass ranges from to 0.2 for 0.1–1, depending on whether or not CO and SiO molecules are formed. We also estimate the optical depths and thermal emission by the newly formed dust and compare to the relevant observations of SNe Ia. We find that the formation of C grains in SNe Ia is suppressed to be consistent with the observational constraints. This implies that energetic photons and electrons heavily depress the formation efficiency of C grains or that the outermost C-O layer of SNe Ia is almost fully burned. Finally, we perform the calculations of dust destruction in the SN remnants and find that dust grains formed in the ejecta of SNe Ia are almost completely destroyed in the shocked gas before being injected into the interstellar medium. This indicates that SNe Ia are unlikely to be the major sources of interstellar dust.
Subject headings:
dust, extinction — galaxies: abundances — infrared: stars — ISM: supernova remnants — supernovae: general — white dwarfs1. Introduction
Type Ia supernovae (SNe Ia) are considered to be thermonuclear explosions of carbon-oxygen white dwarfs (WDs). In the single degenerate scenario, the progenitor of an exploding WD grows up to a mass close to the Chandrasekhar limit through mass transfer from the binary companion and finally undergoes carbon ignition near the center (e.g., Nomoto 1982). However, it has been a matter of controversy whether the nuclear burning front propagates as a subsonic deflagration wave (Nomoto et al. 1976, 1984b) or as a supersonic detonation wave growing from the deflagration (Khokhlov 1991a, 1991b). Although there are some differences in the resulting elemental distributions, both the propagation modes can synthesize a significant amount of iron-peak elements as well as intermediate-mass elements such as Si, S, and Ca (Höflich et al. 1995; Iwamoto et al. 1999). Thus, SNe Ia are major sources of heavy elements and play a critical role in the chemical enrichment history of the universe (e.g., Nomoto et al. 1984a; Timmes et al. 1995; Kobayashi & Nomoto 2009).
It has been also supposed that SNe Ia can be possible producers of dust grains, especially Fe grains (Tielens 1998) and would have important consequences for the evolution and inventory of interstellar dust (Dwek 1998). This presumption is mainly based on their metal-rich compositions of the cooling gas in the ejecta similar to those in core-collapse supernovae (CCSNe) for which several pieces of observational evidence for dust formation have been reported (see Kozasa et al. 2009 for review). In addition, the formation of dust in SNe Ia has been suggested from the analysis of presolar grains extracted from meteorites; Clayton et al. (1997) pointed out that the isotopic signatures of type X silicon carbide (SiC) particles can be explained if SiC grains condense out of the explosive helium burning layer in SNe Ia. However, the composition, size, and amount of dust grains formed in the ejecta of SNe Ia and injected into the interstellar medium (ISM) have not been fully explored to date.
It should be mentioned that systematic studies of SN Ia rates have proposed the presence of a prompt component of SNe Ia exploding in a timescale as short as 0.1 Gyr after the stellar birth (Mannucci et al. 2005, 2006; Della Valle et al. 2005; Scannapieco & Bildsten 2005). The increasing testimonies of such short-lived SNe Ia have been thereafter given by many theoretical and observational works (Totani et al. 2008; Aubourg et al. 2008; Hachisu et al. 2008a, 2008b; Matteucci et al. 2009; Brandt et al. 2010, Maoz et al. 2010). Although in the single degenerate scenario SNe Ia are not expected to generate in metal-poor environments as low as [Fe/H] (Kobayashi et al. 1998), prompt SNe Ia might have occur in the early universe at redshifts higher than , where most of observed quasar systems have already reached solar- and super-solar metallicities (Juarez et al. 2009). Hence, if prompt SNe Ia could actually produce dust grains, they would have made a large contribution to dust budgets not only in our Galaxy but also in high-redshift dusty galaxies (e.g., Valiante et al. 2009).
On the other hand, no observation of normal SNe Ia has reported convincing evidence for the ongoing formation of dust in the ejecta as indicated by an increase of infrared (IR) continuum, a rapid decline of optical luminosity, and blueshifts of atomic line emissions; Gerardy et al. (2007) observed two SNe Ia, SN 2003hv and SN 2005df, at 100–400 days since the explosion with the Spitzer Space Telescope. However, the observed mid-IR spectral energy distributions (SEDs) did not show any evolution, allowing the authors to conclude that the mid-IR fluxes are dominated by the strong atomic line emission rather than thermal emission from newly formed dust. Maeda et al. (2009) discovered an accelerated fading of the optical light curve for the peculiar SN Ia 2006gz, but it remains unclear whether this is responsible for dust formation. Furthermore, no IR emission from dust formed in the ejecta has been seen in the supernova remnant (SNR) of Tycho (Douvion et al. 2001) identified as a standard SN Ia (Krause et al. 2008), although recently Ishihara et al. (2010) suggested the possible detection of thermal emission from the ejecta-origin dust, based on the IR observations with the AKARI.
The fact that the existence of newly formed dust has not been distinctly confirmed so far implies that formation of dust in SNe Ia is likely to be inefficient or impossible because of some physical conditions in the ejecta different from CCSNe; SNe Ia have much higher expansion velocities of the ejecta and produce much more radioactive element 56Ni than typical CCSNe. A higher expansion velocity leads to a lower gas density in the ejecta, which prevents dust grains from growing to radii larger than 0.01 m or even makes the condensation of dust unsuccessful (Nozawa et al. 2008, 2010). In addition, energetic photons and electrons generated from the decay of radioactive elements can inhibit the formation of dust grains (Nozawa et al. 2008) and also can disturb the formation of SiO and CO molecules that affects the dust formation processes (Höflich et al. 1995). Thus, it is essential to examine how the formation process of dust in the ejecta depends on the type of SNe, by taking account of the time evolution of gas temperature and density, the formation of CO and SiO molecules, and the impacts of high-energy photons and electrons.
In this paper, we investigate the formation of dust in the expanding ejecta of SNe Ia, with the aim of revealing the roles of SNe Ia in the dust enrichment in the universe. In Section 2, we describe the models of SNe Ia and the method of calculation of dust formation. In the calculations, we adopt as a model of SNe Ia the carbon-deflagration W7 model (Nomoto et al. 1984b; Thielemann et al. 1986), and apply the nucleation and grain growth theory to estimate the composition, size, and mass of dust that can condense in the ejecta. The results of the calculations are presented in Section 3 for the two cases with and without the formation of CO and SiO molecules. In Section 4, we calculate the optical depths and thermal emissions by the newly formed dust and apply them to the observational constraints. Then we discuss the formation process of dust in SNe Ia and the elemental composition in the outermost layer of SNe Ia. In Section 5, we calculate the destruction of the newly formed grains by the reverse shock and examine whether they can survive to be injected from SNe Ia into the ISM. The summary is devoted in Section 6.
2. Calculation of Dust Formation in the Ejecta of SNe Ia
2.1. Model of SNe Ia
The composition, size, and number density of dust formed in SNe depends on the elemental composition in the ejecta as well as the time evolution of the density and temperature of the gas (Kozasa et al. 1989, 1991; Nozawa et al. 2003). In the calculations of dust formation in SNe Ia, we adopt the nucleosynthesis and hydrodynamic results of the one-dimension carbon-deflagration W7 model (Nomoto et al. 1984b; Thielemann et al. 1986). The W7 model can account for many of the observed characteristics of normal SNe Ia, so it has been extensively used as one of the most standard SN Ia models. In the W7 model, the ejecta mass is , and the kinetic energy of the explosion is erg . The mass of synthesized 56Ni is (56Ni) , which is one order of magnitude larger than those ((56Ni) ) produced in typical CCSNe.
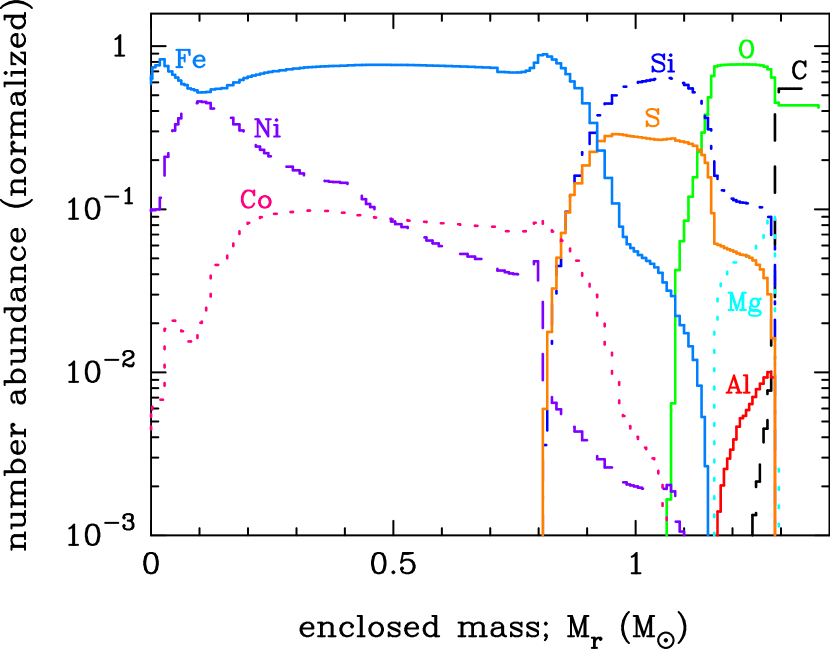
Figure 1 shows the number abundances of elements relevant to dust formation in the ejecta of the W7 model at 300 days after the explosion as a function of enclosed mass . In Type II-P SNe (SNe II-P) with massive H-envelopes, dust grains can only form in the metal-rich gas inside the He core (Kozasa et al. 1989). However, SNe Ia do not have H-rich envelopes, and dust formation would be possible in the entire region of the ejecta. We divide the ejecta of the W7 model into four layers, according to the elemental composition of interest to dust formation: the Fe–Ni layer ( 0–0.91 ), the Si–S layer ( 0.91–1.14 ), the O-rich layer ( 1.14–1.28 ), and the C–O layer ( 1.28–1.38 ).
In the deflagration W7 model, 0.1 of C and O remains unburned in the outermost layer. In W7, the initial C+O white dwarf is assumed to be composed of , , and (where denotes the mass fraction) with a number ratio of C/O . Therefore, we can expect the formation of C grains in the outermost C–O layer, although the C/O ratio in the outermost layer is determined by many cycles of recurrent He-shell flashes, thus being highly uncertain. On the other hand, in the delayed detonation model, pre-existing C atoms can be completely burned, except for those in the very outer layers with the expansion velocities higher than 20,000 km s-1 (Iwamoto et al. 1999), which prohibits the condensation of large amounts of C grains. The formation of C grains and the elemental composition in the outer layer of SNe Ia will be discussed in Section 4.4.
In the calculations, we consider the onion-like elemental composition as shown in Figure 1, assuming that any microscopic and macroscopic mixing of elements do not occur before the condensation of dust grains. This assumption is supported by a variety of studies; the spectrum synthesis calculations of a time-series of spectra obtained during 5–377 days for SN 2002bo, SN 2004eo, and SN 2003du demonstrated that the abundance distributions in the ejecta of these SNe Ia are fully stratified with some degree of macroscopic mixing (Stehle et al. 2005; Mazzali et al. 2008; Tanaka et al. 2011). Based on the analysis of the emission profiles in the mid-IR spectrum at days, Gerardy et al. (2007) have also shown that the ejecta structure in SN Ia 2005df is chemically stratified. Furthermore, X-ray observations of the Tycho SNRs indicate that the layered composition has been retained in the ejecta even at 450 yr after the explosion (Badenes et al. 2006; Hayato et al. 2010 see also Kosenko et al. 2010 for Type Ia SNR 0519–69.0).
The time evolution of the gas density in the freely expanding ejecta is calculated as , based on the density structure of the W7 model. The time evolution of the gas temperature is evaluated by solving the radiative transfer equation simultaneously with the energy equation of the radiation plus gas under the assumption of the local thermodynamic equilibrium (LTE, Iwamoto et al. 2000). The energy deposition through the decay of radioactive isotopes is calculated by giving a constant -ray absorption opacity that can reproduce the behavior of the bolometric light curves observed for standard SNe Ia. The kinetic energies of positrons are assumed to be deposited instantaneously in situ. The energy loss by positron escape becomes more important at later times when the density in the ejecta is low enough. However, at the epochs relevant to this study ( days), this effect can be negligible (Milne et al. 2001).
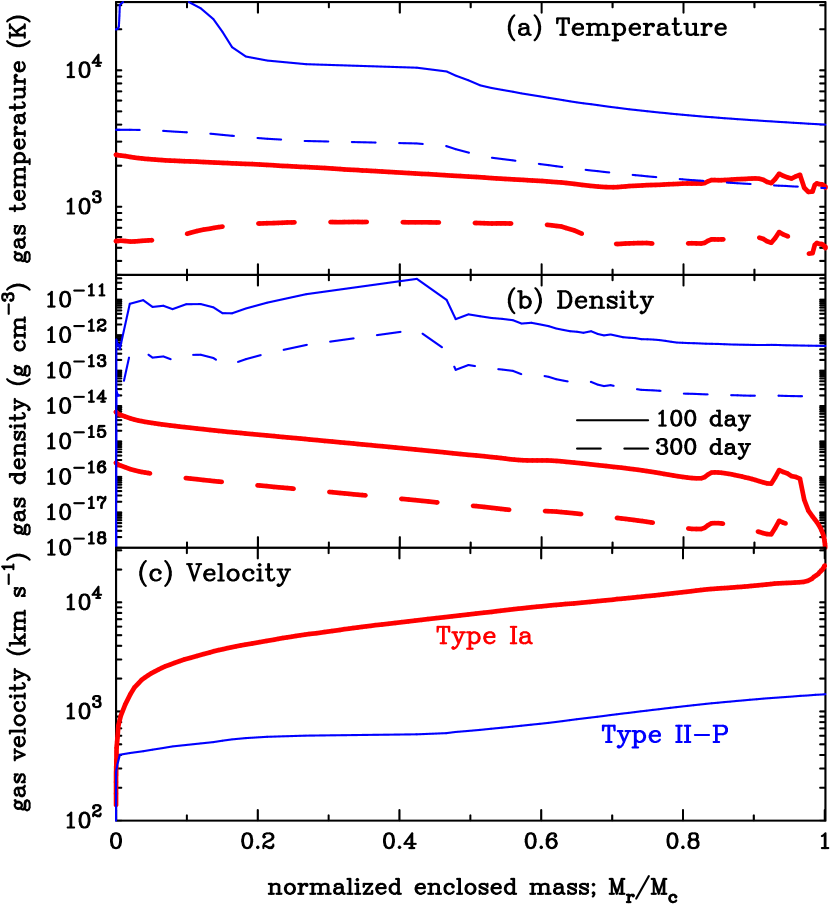
Figures 2(a) and 2(b) show the structures of the gas temperature and density in the ejecta of the W7 model, respectively, at 100 days (thick solid lines) and 300 days (thick dashed lines) after the explosion. Figure 2(c) displays the velocity distribution of the W7 model. For comparison, we also show those in the He core of the SN II-P model with an , an , and a massive H-envelope of (thin lines; Umeda & Nomoto 2002). As can be seen from Figure 2(c), the expansion velocity of the metal-rich ejecta is much higher in the SN Ia than in the SN II-P, despite the almost same explosion energy of both the SNe; in the SN Ia all of the explosion energy is deposited into the low-mass ejecta with no H-envelope, whereas in the SN II-P most of explosion energy is used to blow off the massive H-envelope. As a result, the gas density in the SN Ia is more than three orders of magnitude lower than that in the SN II-P. In addition, the gas temperature in the SN Ia decreases more quickly than that in the SN II-P and drops down to 2000 K at 100 days. This is because the lower gas density causes absorption of -ray in the ejecta to be less efficient and because the thermal energy produced at the explosion is quickly lost by the adiabatic expansion unlike SNe II-P.
2.2. Nucleation Rate
One of the main aims of this paper is to clarify how the size and mass of dust formed in the ejecta depend on the type of SNe. In order to achieve this goal, we apply a non-steady state nucleation and grain growth theory, which has been utilized for investigating the dust formation in various types of CCSNe in our previous studies (Nozawa et al. 2003, 2008, 2010). The theory enables us to estimate the size distribution and mass of newly formed dust, given the elemental composition and the time evolution of density and temperature of the gas. Here we present the formula for the nucleation rate, which will be useful for discussion in the later section. For comprehensive description of dust formation calculations, we refer the readers to Nozawa et al. (2003). We also note that there is another approach to evaluate the amount of dust formed in the SN ejecta, which follows the abundances of dust precursor molecules by solving a complex chemical reaction network (Cherchneff & Dwek 2009, 2010).
| dust species | key species | chemical reaction | K | ||
|---|---|---|---|---|---|
| model A | |||||
| (1) | MgSiO3(s) | Mg(g)/SiO(g) | Mg(g) + SiO(g) + 2O(g) MgSiO3(s) | 25.0129 | 72.0015 |
| (2) | Mg2SiO4(s) | Mg(g) | 2Mg(g) + SiO(g) + 3O(g) Mg2SiO4(s) | 18.6200 | 52.4336 |
| SiO(g) | 2Mg(g) + SiO(g) + 3O(g) Mg2SiO4(s) | 37.2400 | 104.8672 | ||
| (3) | SiO2(s) | SiO(g) | SiO(g) + O(g) SiO2(s) | 12.6028 | 38.1507 |
| model B | |||||
| (4) | MgSiO3(s) | Mg(g)/Si(g) | Mg(g) + Si(g) + 3O(g) MgSiO3(s) | 34.7214 | 87.7178 |
| (5) | Mg2SiO4(s) | Mg(g) | 2Mg(g) + Si(g) + 4O(g) Mg2SiO4(s) | 23.4742 | 60.2918 |
| Si(g) | 2Mg(g) + Si(g) + 4O(g) Mg2SiO4(s) | 46.9484 | 120.5836 | ||
| (6) | SiO2(s) | Si(g) | Si(g) + 2O(g) SiO2(s) | 22.3113 | 53.8670 |
Note. — The key species is defined as the gas species whose collisional frequency is the least among reactants. The subscripts (s) and (g) denote solid condensate and gas species, respectively. The Gibbs free energy for the formation of a condensate from reactants per molecule of the key species is approximated by , where the numerical values and are derived by least-squares fittings of the thermodynamics data (Chase et al. 1985) in the range of temperature of interests.
The nucleation rate, taking account of chemical reactions at condensation, is evaluated by introducing the concept of the key species defined as the least abundant gaseous species among the reactants. By assuming that the key species controls the kinetics of nucleation and grain growth (Kozasa & Hasegawa 1987; Hasegawa & Kozasa 1988) and taking into account the difference between the temperatures of gas and condensation nuclei (Kozasa et al. 1996), the steady-state nucleation rate for a given grain species is written as111There is a typographical error in Eq (3) for nucleation rate in Nozawa et al. (2003); should be replaced with as is seen in Eq (1).
| (1) |
where is the probability with which the key species stick onto the surface of grains, is the energy barrier for nucleation, is the Boltzmann constant, is the surface energy, is the gas temperature, is the temperature of the condensation nuclei, and and are, respectively, the volume and hypothetical radius of the condensate per molecule of the key species. The concentration and mass of the key species are represented as and , respectively. Note that a factor , which depends on the partial pressures of reactant and product gas species except for the key species (Chigai et al. 1999), is omitted from the equation since we set in the calculations (see Nozawa et al. 2003). The supersaturation ratio is calculated by
| (2) |
where is the Gibbs free energy for condensation of the th dust species from the reactants per molecule of the key species, and are the partial gas pressures of the reactants and products. The stoichiometric coefficients , which are normalized to the key species, are positive for a reactant and negative for a product.
In the following calculations, we assume , to be consistent with a treatment in our earlier studies; dust formation in the case where the temperature of the condensation nuclei is not equal to the gas temperature is examined in Section 4.2. We take 1 and 0.1 as the sticking probability, assuming that it is the same for all grain species; for 0.01, dust formation does not occur substantially for the SN model considered here. The Gibbs free energy for formation of a grain species is approximated as through the least-square fitting of the thermodynamics data (Chase et al. 1985). The formation of all possible condensates is calculated simultaneously. The grain species considered and the data needed for the dust formation calculations are given in Table 2 in Nozawa et al. (2003).
2.3. Formation of CO and SiO Molecules
Since the first detection in SN 1987A (Spyromilio et al. 1988; Aitken et al. 1988), formation of CO and SiO molecules has been observed in several CCSNe (Spyromilio & Leibundgut 1996; Spyromilio et al. 2001; Gerardy et al. 2000, 2002; Kotak et al. 2006, 2009; Hunter et al. 2009). Formation of these molecules prior to dust formation can affect the composition, size, and mass of dust grains that condense in the ejecta (e.g., Nozawa et al. 2003); carbon (oxygen) atoms bound in CO molecules are not available for formation of C-bearing (O-bearing) grains, and SiO molecules lock up silicon atoms available to form Si and SiC. On the other hand, SiO molecules, whose rapid depletion was observed concurrently with the onset of dust formation in SN 1987A (Roche et al. 1991) and SN 2004et (Kotak et al. 2009), are considered to be precursors of silicate grains such as MgSiO3, Mg2SiO4, and SiO2 (Kozasa et al. 1989) as represented by the reactions (1)–(3) in Table 1.
In the astronomical environments hospitable to dust formation such as in mass-loss winds of evolved late-type stars, it is usually assumed that formation of CO and SiO molecules is complete. However, in the ejecta of SNe, these molecules are destroyed by impacts with energetic electrons and/or charge transfer reactions with the ionized inert gas. For SN 1987A, the masses of CO and SiO molecules were estimated to be (Liu et al. 1992; Liu & Dalgarno 1995; Gearhart et al. 1999) and (Liu & Dalgarno 1994, 1996), respectively. These masses correspond to formation efficiencies less than a few percents, where the formation efficiency is defined as the mass fraction of carbon and silicon locked in CO and SiO molecules. The disruption of CO molecules may enable carbon grains to condense out of the oxygen-rich gas in the SN ejecta (Clayton et al. 1999, 2001; Deneault et al. 2006; Todini & Ferrara 2001; Bianchi & Schneider 2007).
In the ejecta of SNe Ia that produce much more 56Ni than typical CCSNe, destruction of CO and SiO molecules can be more effective as a result of more vigorous radioactivity (Liu 1997). Höflich et al. (1995) argued that CO and SiO molecules can form more or less in subluminous SNe Ia with (56Ni) but cannot form in normal SNe Ia with (56Ni) . Indeed, neither the fundamental nor overtone emissions of CO molecule have been detected in ordinary SNe Ia, although Taubenberger et al. (2010) has reported probable detection of CO emission at 85 day after the peak brightness in superluminous SN Ia 2009dc. We also note that possible formation of SiO molecule is supposed for SN Ia 2005df, but its formation efficiency should be extremely low ( 0.01 %, Gerardy et al. 2007).
In the present calculations, we consider two extreme cases for formation of CO and SiO molecules. One is the complete formation of CO and SiO molecules, in which case the lesser of carbon (silicon) and oxygen is locked up in CO (SiO) molecules and SiO molecules act as precursors of silicate grains. This is the assumption made by a series of our previous works. Although CO and SiO molecules can be the dominant coolants in SNe (Liu & Dalgarno 1995), we do not take into account the effects of cooling by these molecules on the thermal structure of the ejecta.222 The cooling by CO and SiO molecules causes rapid decreases in the gas temperatures in the C-O layer and the O-rich layer. This would lead to the earlier condensation of silicate and C grains and their larger average radii than those given in this paper. However, the temperature decrease by molecular cooling cannot cause the mass of these dust grains to increase appreciably in the case of , where most of the metals available for dust formation are incorporated into dust grains (see Section 3.1). We also note that if the ejecta were optically thick for CO and SiO emissions, the cooling could not operate effectively (Gearhart et al. 1999). The other case is no formation of CO and SiO molecules, where carbon, silicon, and oxygen take part in dust formation as free atoms. It should be mentioned here that even if SiO molecules cannot form in the ejecta, silicate grains may condense via the chemical reaction paths different from the reactions (1)–(3) given in Table 1. Here we calculate the formation of silicates by considering the reactions (4)–(6) in Table 1.
3. Results of Dust Formation Calculations
In this section, we present the results obtained from the models of calculations outlined in Section 2. In what follows, we refer to the cases with and without formation of CO and SiO molecules as the model A and model B, respectively, with the values of sticking probabilities attached in the model names. For example, the A1 represents the model taking complete CO and SiO formation with . For each of models considered in this paper, the mass of each dust species formed in the ejecta are summarized in Table 2. In the followings, we focus on the results in the most optimistic cases of for dust formation (i.e., the models A1 and B1), to make a direct comparison with our previous studies, where was assumed.
| dust species | A1 | A0.1 | B1 | B0.1 |
|---|---|---|---|---|
| C | ||||
| MgO | ||||
| MgSiO3 | ||||
| Mg2SiO4 | ||||
| SiO2 | ||||
| Al2O3 | ||||
| FeS | ||||
| Si | ||||
| Fe | ||||
| Ni | ||||
| Total |
Note. — The dust mass is given in units of . The models A1 and A0.1 are the cases where formation of CO and SiO molecules is assumed to be complete, with the sticking probabilities of 1 and 0.1, respectively. In the model B1 with 1 and the model B0.1 with 0.1, it is assumed that any molecule never forms in the ejecta.
3.1. Cases with Molecular Formation
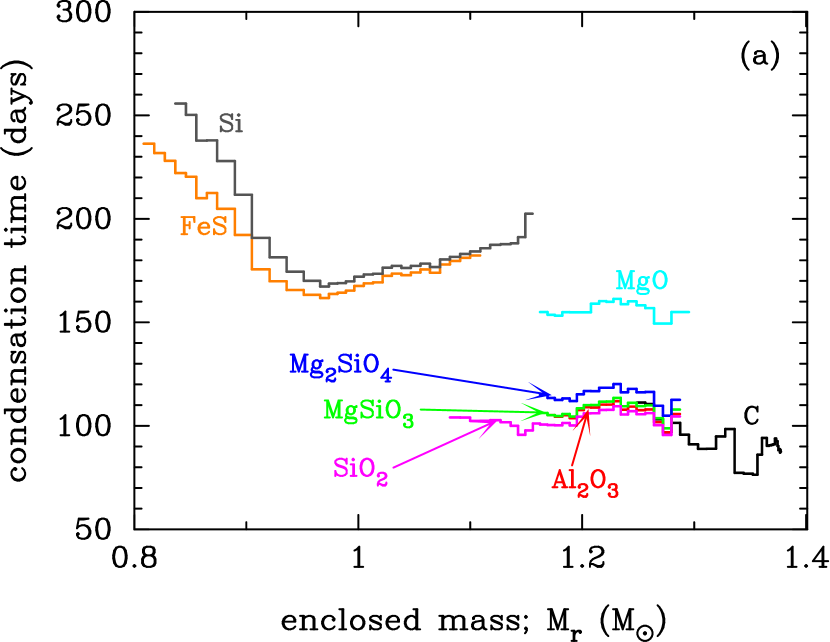
Figure 3(a) shows the condensation time of dust grains formed in the ejecta of SNe Ia for the model A1, where is defined as the time when the nucleation rate reaches the maximum (see Nozawa et al. 2003). In the outermost C–O layer, C grains are formed at 80–110 days from the remaining carbon atoms that are not locked in CO molecules. In the O-rich layer, Al2O3 grains first condense around 100 days, and silicate (Mg2SiO4, MgSiO3, SiO2) grains condense at 120–150 days via the reactions involving SiO molecules. Then MgO grains form at 150–160 days in the O-rich layer, and FeS and Si grains form at 160–250 days in the Si–S layer. Despite the presence of the extended Fe–Ni layer, Fe and Ni grains are not produced at 0.15–0.8 ; the gas density in this region becomes too low for them to nucleate before the gas cools down to their condensation temperatures ( 800 K). Fe and Ni grains can condense at 250–300 days only in the innermost region ( 0–0.15 ) with the highest gas density (see Figure 2), though their masses are very small (see below).
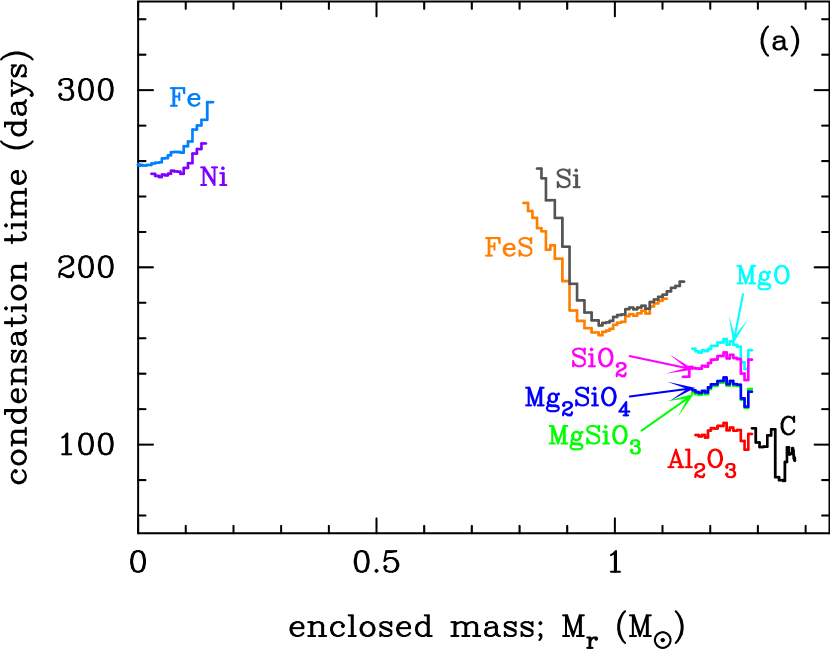
The above results indicate that a variety of dust grains can form in SNe Ia according to the elemental abundances in the different layers, given that the stratified elemental composition is retained with no mixing. The resulting composition of newly formed grains and the order of their condensation are almost the same as those in any types of CCSNe (Nozawa et al. 2003, 2008, 2010). This means that the condensation sequence of dust does not depend on the type of SNe, reflecting the fact that the elemental composition of the metal-rich gas in the ejecta is not greatly different among different types of SNe. However, the condensation times of dust in SNe Ia are much earlier ( 100–300 days) than those ( 300 days) in SNe II-P (Nozawa et al. 2003). Such early condensation of dust is caused by the rapid decrease of the gas temperature resulting from the low gas density in the ejecta (see Figure 2).
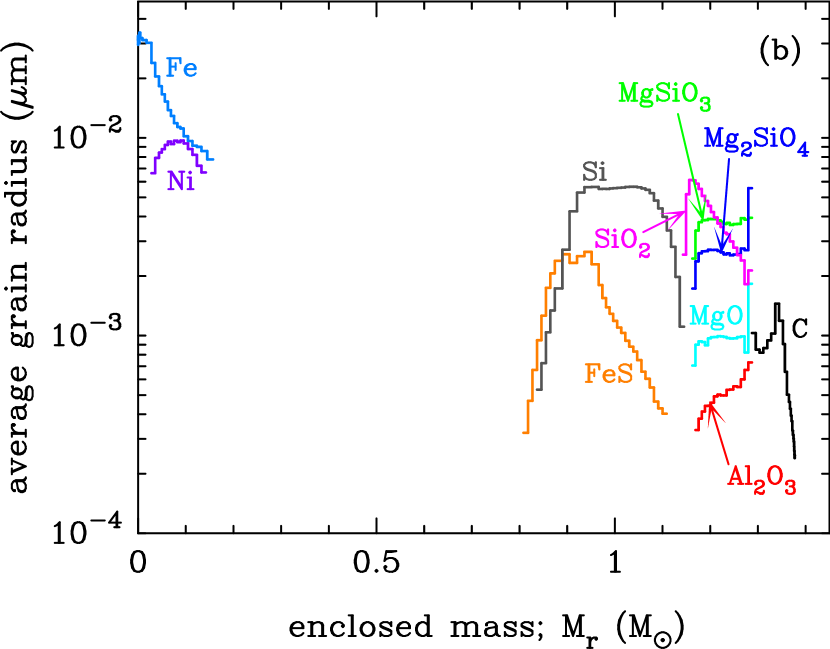
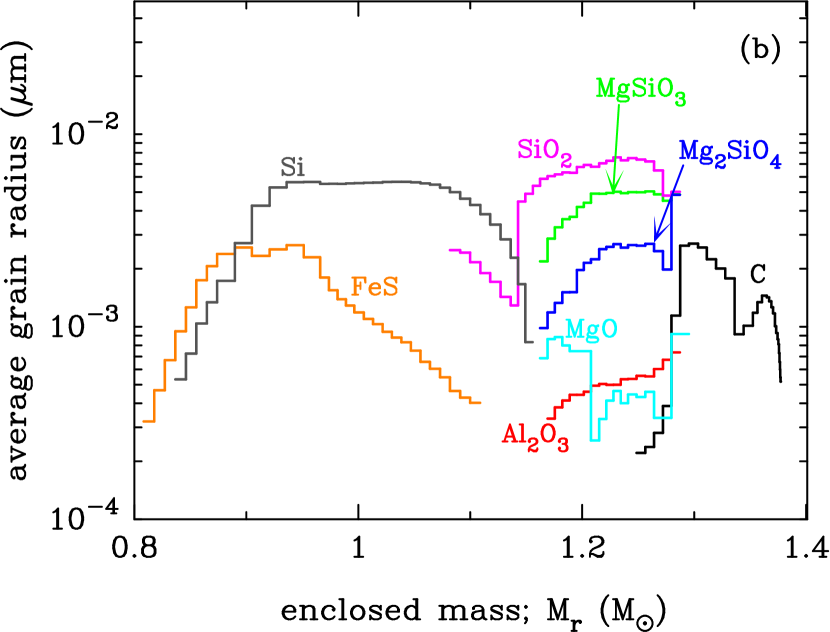
The low gas density in SNe Ia also leads to an important consequence for the size of dust formed in the ejecta. Figure 3(b) exhibits the average radii of newly formed grains as a function of enclosed mass. We can see that the average radii of all dust species except Fe and Ni grains are under 0.01 m, being considerably smaller than those ( m) in SNe II-P (Nozawa et al. 2003). As demonstrated by Nozawa et al. (2010), the condensation of dust grains in less dense gas demands a larger supercooling, and the resulting formation and growth of a huge number of condensation nuclei makes the average radius of grains small due to the conservation of mass of materials available for dust formation. On the other hand, in the gas with an even much lower density, formation of seed nuclei itself is depressed significantly. In this case, the final radius is determined by the competition between the collision timescale of the key species onto the grain surfaces and the expansion timescale of the gas. This is the case for Fe and Ni grains, which can acquire the average radii of m
It should be emphasized that the masses of Fe and Ni grains are quite low ( ) although their radii are relatively large. This indicates that SNe Ia cannot be major sources of Fe and Ni grains, contrary to the presupposition made in some studies. In the model A1, the total mass of newly formed dust is 0.116 and the main dust species in mass are Si (0.063 ), FeS (0.018 ), and SiO2 grains (0.015 ). The mass of silicate (Mg2SiO4, MgSiO3, SiO2) grains is 0.03 in total and occupies 25 % of the total dust mass. C grains are produced with . In the model A0.1 with , the total dust mass is and is dominated by C grains (see Table 2). The average grain radii are a factor of 5–10 smaller in the model A0.1 than in the model A1. However, the condensation times of dust grains for the model A0.1 are not significantly different from those for the model A1.
3.2. Cases with No Molecular Formation
Figures 4(a) and 4(b) show the condensation times and the average radii of newly formed grains in the model B1, where no molecular formation and are assumed. Since dust formation in the inner Fe–Ni layer ( 0.8 ) is not affected by formation of CO and SiO molecules, only shown the results in the region of 0.8–1.38 are in Figure 4. In the model B1 with no CO formation, nucleation and growth of C grains in the outermost C–O layer can advance in more carbon-rich gas. As a result, the average radii and the mass of C grains increase by a factor of 2–3 and 6.6, respectively, compared with those in the model A1. Furthermore, because of no formation of SiO molecules, more free silicon atoms are available for formation of Si grains at 1.10–1.15 , leading to a little higher mass of Si grains than in the model A1.
The difference of the results between the models A1 and B1 also appears in formation of silicate grains. In the model B1, Mg2SiO4, MgSiO3, and SiO2 grains can condense a few tens days earlier than those in the model A1. Moreover, the condensation time of SiO2 grains is earlier than those of Mg2SiO4 and MgSiO3, in contrast to the case in the model A1. These differences comes from the difference in the Gibbs free energies for their condensation; the reactions (4)–(6) in Table 1 provide the lower Gibbs free energies than the reactions (1)–(3). Since the lower Gibbs free energy allows the supersaturation ratio to rise above unity more rapidly (see Eq (2)) for a given temperature evolution of cooling gas, the earlier formation of silicate, especially SiO2 grains, is realized in the model B. The average radii and the masses are enhanced for SiO2 and MgSiO3, as a result of their formation in the denser gas (at earlier times). However, both the average radius and the mass are slightly reduced for Mg2SiO4, compared with those in the model A1; the earlier condensation of SiO2 and MgSiO3 significantly reduces Si atoms available for the later formation of Mg2SiO4. The total mass of silicate is 0.075 , which is 2.5 times higher than those in the model A1.
Our calculations demonstrate that SiC grains never condense in SNe Ia, regardless of formation of CO and SiO molecules. The main reason for this is that in the ejecta of W7 model there is no layer where carbon and silicon coexist abundantly. However, even if both the elements are abundant in some layer, as appeared in CCSNe, theoretical calculations (Nozawa et al. 2003; Cherchneff & Dwek 2009, 2010) do not predict the condensation of SiC grains with radii more than 0.1 m as discovered in presolar grains. Thus, it remains unexplained whether presolar SiC grains originated from SNe Ia (Clayton et al. 1997) or CCSNe (Amari et al. 1992; Nittler et al. 1996, see also Deneault et al. 2003; Deneault 2009).
In summary, formation of CO and SiO molecules, as well as the sticking probability, has substantial impacts on the mass of dust grains formed in SNe Ia; the total dust mass for the model B1 (B0.1) without molecular formation is 0.194 (0.026 ) and is much higher than 0.116 ( ) for the model A1 (A0.1) with molecular formation. In particular, the difference in dust mass is more than two orders of magnitude between the models of A0.1 and B0.1 for which the total dust masses are dominated by C grains. In the model B0.1 without CO formation, the number density of C atoms available for dust formation is about five times higher than in the model A0.1. Thus, even if , condensation of C grains can still proceed efficiently, and a considerable amount of C grains can form in the model B0.1.
On the other hand, in all of the models considered here, the condensation times of dust are significantly early ( 300 days), and the average grain radii are small ( 0.01 m). These conclusions are not influenced by CO and SiO formation and arise from the low density of the gas in the ejecta of SNe Ia with no H-envelope. Our preceding studies demonstrated that a tiny size of dust grains with m condense in envelope-stripped Type Ib SN 2006jc (Nozawa et al. 2008) and Type IIb SNe (Nozawa et al. 2010), while relatively large grains with m form in envelope-retaining SNe II-P (Nozawa et al. 2003). Thus, we conclude that the radius of dust formed in the ejecta depends on the type of SNe, and that smaller dust grains are produced as the envelope masses of SNe become lower.
4. Discussion
As shown in the last section, dust grains of –0.2 can form in the ejecta of SNe Ia for the sticking probabilities of 0.1–1. The formation of such an amount of dust grains may show some observational signatures such as a fading of optical luminosity and a rising of infrared luminosity. However, these events suggestive of dust formation have not been confirmed by any observation of ordinary SNe Ia. In this section, we calculate the opacity and thermal emission by the newly formed dust and apply the results to the observational constraints. Then we discuss the composition and mass of dust formed in the ejecta as well as the elemental composition of the outermost layer in SNe Ia.
4.1. Optical Depth by Newly Formed Dust
We begin with estimating the optical depths by dust formed in the ejecta. The optical depth as measured from the outermost radius of the ejecta is calculated as follows,
| (3) | |||||
where is the size distribution function of dust species per volume at a position , is the mass of a grain with a radius and a bulk density , and is the mass extinction coefficient. The maximum and minimum radii of dust ( and , respectively), as well as , are obtained from the dust formation calculations in Section 3. Here we assume that dust grains formed at a give position distribute homogeneously within the corresponding mesh. The bulk density of each dust species is taken from Table 2 in Nozawa et al. (2006), and the optical constants for calculating are taken from the references summarized in Section 4.1 in Nozawa et al. (2010).333The bulk density and the source of optical constants for Ni grains have not been given in Nozawa et al. (2006, 2010). We adopt g cm-3 as a bulk density of Ni grains, which is evaluated by using the hypothetical radius Å of the condensate (Nozawa et al. 2003). For the optical constants, we assume that the optical properties of Ni grains are the same as those of Fe grains. Since the mass of Ni grains formed in the ejecta is negligible, this assumption has no impact on the results in the rest of this paper. Note that the optical depths scale as for the free expansion of the ejecta.
The results of calculations show that the total optical depths at V band ( m) are 163 (279) at 300 days for the model A1 (B1); C, Si, FeS, and Fe grains are the major donors of the opacity with 22 (137), 78 (79), 14 (14), and 49 (49), respectively. At 300 days, silicate grains only have 0.01 (0.02) because of their low extinction efficiencies at m, while they provide large optical depths of 5.4 (11.7) at 10 m. Note that even for the model A0.1 (B0.1) with , the V-band optical depths by C grains reach 2.5 (93) at 200 days, which are large enough to affect the optical light curve of the SN. The calculation by Sugerman et al. (2006) suggested that the clumpy structure of the ejecta can make the opacity by dust smaller by about one order of magnitude than the homogeneous distribution with the same dust mass (see also Ercolano et al. 2007). However, even if we consider the effect of dust clump, the V-band opacities calculated here are still too high to be consistent with the observations. This indicates that the mass of dust formed in SNe Ia must be smaller than our calculations predict.
SNe Ia produce approximately ten times more 56Ni than normal CCSNe and thus may have stronger radiation fields in the ejecta. Moreover, dust formation in SNe Ia is realized within the first one year, during which energetic photons and electrons are likely to be abundant inside the ejecta. In such an environment, small clusters that are composed of several to a few tens atoms are heated up by the impacts with UV-optical photons and fast electrons, and their temperature could be higher than the temperature of the gas, depending on their optical properties. The heating of small clusters can lead to detachment of atoms from the clusters and thus can inhibit the formation of dust. In the next subsection, we evaluate the temperature of condensate nuclei, and examine how the formation process of dust can be affected by the effect of non-local thermal equilibrium between the nucleated dust and the gas.
4.2. Dust Formation in non-Local Thermal Equilibrium Condition
In the calculations of dust formation in Section 3, we assumed that the temperature of condensation nuclei is the same as the temperature of the gas . However, is not generally equal to , and the resulting temperature difference can influence the condensation process of dust (Kozasa et al. 1996). In particular, if in the cooling gas, the supersaturation ratio () increases more slowly than the case of the local thermal equilibrium with (see Eq (2)), which retards the formation of dust. Furthermore, the effects of the enhanced detachment of monomers from a heated small cluster can be seen in Equation (1) via the factors and .
The temperature of a condensate is determined by the balance between the heating and the cooling. In the ejecta of SNe, the possible heating processes of small clusters are absorption of UV-optical radiation and collisions with energetic electrons, while the cooling of dust takes place via thermal emission and collisions with cooler gaseous atoms. However, the energy transferred through collisions with the gas is found to be much lower than that through radiative processes. Thus, we neglect the heating and cooling by collisions with electrons and gaseous atoms. Also, for simplicity, we do not consider the effect of stochastic heating in evaluating the temperature of small clusters; in the SN ejecta with a relatively strong radiation field, the temperature of a stochastically heated grain distributes symmetrically around the equilibrium temperature (Nozawa et al. 2008), which therefore does not affect significantly the IR emission spectra calculated in the next subsection as well.
By balancing the heating by photon absorption and the cooling by thermal radiation of dust, the equilibrium temperature of dust at a given time and at a given position is calculated from the equation
| (4) |
where is the flux, is the Stefan-Boltzmann constant, and and are, respectively, the flux-mean and the Planck-mean of absorption coefficient ; here we assume that the optical properties of small clusters are the same as those of the small dust grains. The flux of the radiation field in the ejecta has been obtained from the radiative transfer calculation in deriving the time evolution of the gas temperature. In the SN model considered here, the flux at day 400 ranges from erg s-1 cm-2 to erg s-1 cm-2 over most parts of the ejecta. Note that the spectral energy distribution of the radiation field in the ejecta at late nebula phases have not been known very well both observationally and theoretically. In the calculations, we assume that the radiation field has a blackbody spectrum with a temperature K, not depending on position and time.
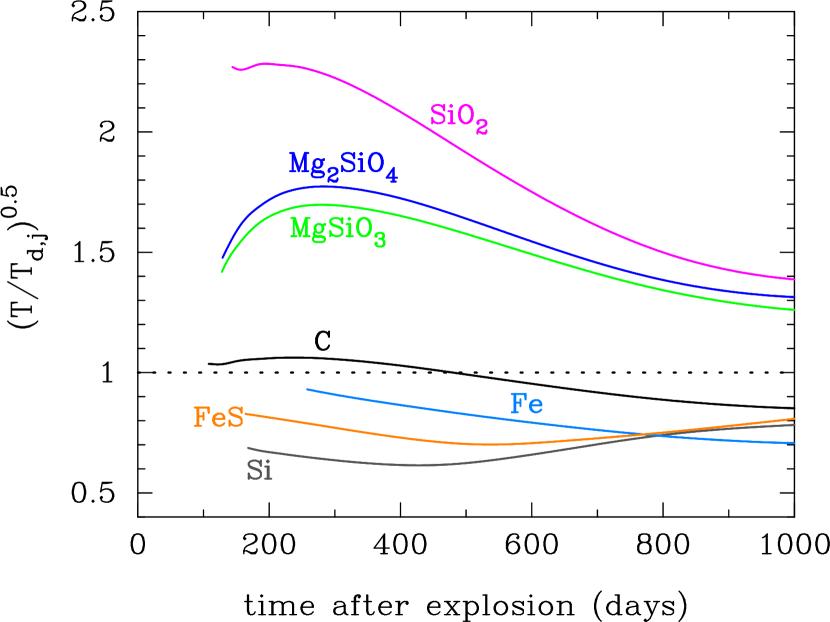
In Figure 5, we present the time evolutions of the square root of the ratio between the gas temperature and the dust temperature for the main grain species. Note that the calculated dust temperature is not sensitive to grain radius for the size range ( m) of dust formed in SNe Ia. The temperatures of MgSiO3, Mg2SiO4, and SiO2 grains have been lower than the gas temperature () since their formation and are as low as 90–150 K at 400 days. On the other hand, Fe, FeS, and Si grains hold 600 K, 720 K, and 1000 K at 400 days, respectively, and have kept higher temperatures than the gas (). The temperature of C grains becomes higher or lower than the gas temperature, depending on position and time.
Using the calculated time evolution of dust temperature and taking account of the effect of non-local thermal equilibrium, we performed the dust formation calculations for C, Fe, FeS, and Si grains with . As the results of calculations, the condensation of Fe, FeS, and Si grains is delayed by 50–350 days, and their condensation times are 300–400 day for Fe and FeS grains, and 450–500 days for Si grains. In such late times, the gas density is too low for dust grains to form efficiently, so the resulting grain masses are heavily reduced: for Fe grains, for FeS grains, and for Si grains in both the models A1 and B1. Thus, apart from Fe grains formed in the innermost ejecta, FeS and Si grains make a negligible contribution to the opacity () after 300 days. On the other hand, the mass of C grains, whose condensation times are 5–20 days later than those for the case of the local thermal equilibrium, decreases only by less than 10 % for all of the models considered in this paper. Namely, too high optical depth () endowed by C grains cannot be mitigated by the effects of the non-local thermal equilibrium.
It should be mentioned here that, using a kinetic approach of nucleation, Lazzati (2008) pointed out that the nucleation of small clusters with a temperature lower than that of the gas can proceed faster in the absence of a strong radiation field. However, to examine the stability of small clusters in the SN ejecta with a strong radiation field, the nanoscale effect such as thermal fluctuations and the finite energy of small clusters need to be treated properly. Such a computation is too time-consuming (Keith & Lazzati 2011) and is beyond the scope of this paper.
4.3. Thermal Emission from Newly Formed Dust
In this subsection, we assess the thermal emission spectra from dust formed in the ejecta by employing the equilibrium temperature of dust given in the last subsection. Then, we compare the results with the observed mid-IR SEDs and discuss the mass and composition of newly formed dust. The derived IR spectra will be also useful as a guide to the future IR observations of SNe Ia.
The flux densities of thermal emission from newly formed dust are calculated with Equations (2) and (3) in Nozawa et al. (2008), by taking account of the self-absorption of dust emission. In this calculation, we adopt the mass of each dust species resulting from the dust formation calculations under the non-local thermal equilibrium condition for the models A1 and B1 (hereafter the models A1-non and B1-non, respectively). The observational data are taken from the photometric results of SN at 200 days and 400 days by Gerardy et al. (2007), which may be the only mid-IR measurements of normal SNe Ia at late times. Gerardy et al. (2007) claimed that the observed mid-IR spectra are not due to thermal emission from dust but are dominated due to line emissions. Here, we regard the observed flux densities as the upper limits for thermal emission from dust. We take Mpc as a distance to SN 2005df (Hamuy 2003).
Figures 6(a) and 6(b) present the calculated total mid-IR SEDs at day 200 and day 400, respectively; the thin solid (dashed) lines are the thermal emission spectra in the case where the contribution of C grains is included for the model A1-non (B1-non). In both models and in both dates, the thermal emission from C grains formed in the inner part of the C–O layer, as well as from silicate grains in the inner ejecta, is mostly absorbed, and the total IR SEDs are dominated by that from C grains in the outermost part of the C–O layer. (As a result, the difference of the IR SEDs between the model A1-non and B1-non is small, even if the mass of C grains for the model B1-non is about one order of magnitude larger than for the model A1-non.) It should be noted that the calculated flux densities are a few orders of magnitude higher than the observed values; if C grains had actually condensed in SNe Ia 2005df, the IR observations would have detect their continuum emission. This outcome, as well as the very high optical depths, conflicts the observations, implying that the formation of C grains in SNe Ia should be extremely inefficient or unsuccessful.
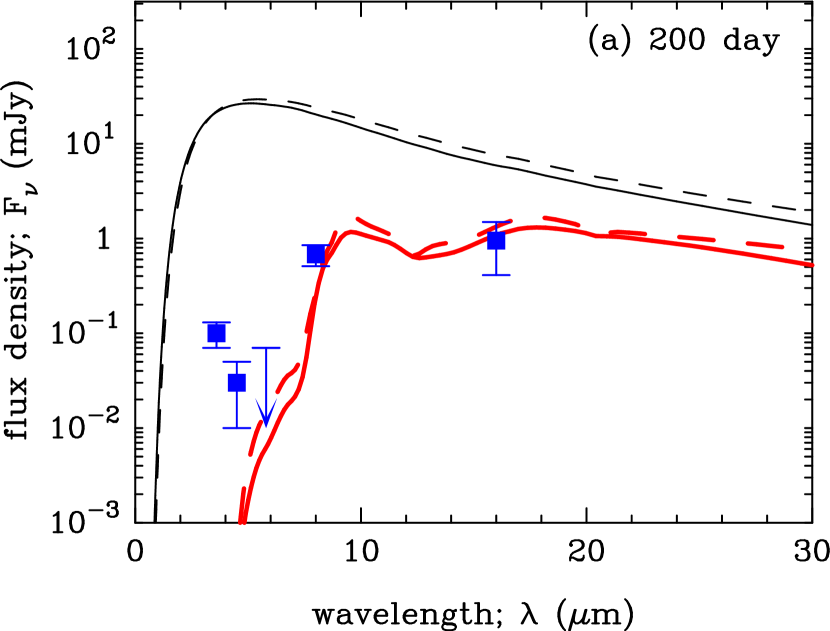
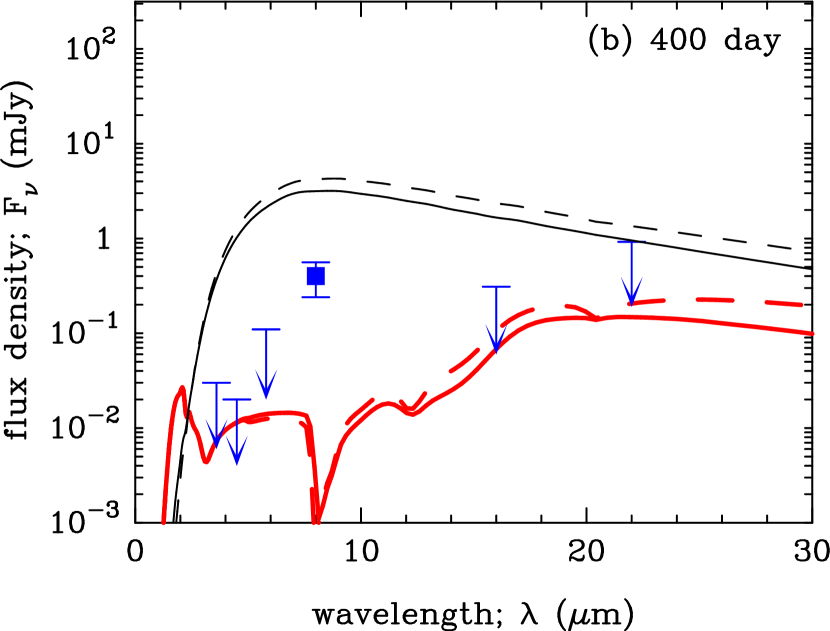
In order to get further insight into the composition and mass of dust formed in SNe Ia, we also calculated the mid-IR spectra in the case where the contribution of C grains is removed arbitrarily. The results are drawn by the thick lines in Figures 6(a) and 6(b). In the models A1-non (solid lines) and B1-non (dashed lines), the IR SEDs at 200 day are produced by silicate grains with the mass of 0.03 and 0.075 , respectively. At 400 days, in addition to the contribution of silicate grains at m, FeS grains of 4 contribute to the IR fluxes at m. As can be seen from these figures, the calculated SEDs do not contradict with the observational data at both day 200 and day 400. Therefore, from this comparison, we cannot impose any constraints on the composition and mass of grains species other than C grains. In other words, 0.03–0.075 of silicate grains can be allowed as a mass of dust formed in SNe Ia within the present observational constraints.
4.4. C grain formation and the Outermost C–O Layer of SNe Ia
The discussion in the last subsection indicates that the formation of appreciable amounts of C grains in SNe Ia is incompatible with the existing observational results. Thus, the condensation of C grains must be suppressed much more than the present calculations predict. In our model, one of the factors that produces massive C grains is relatively high sticking probabilities of ; if we take , neither C grains nor the other grains can condense substantially. Such low sticking probabilities are suggested for the formation of C grains in the peculiar Type Ib SN 2006jc; Nozawa et al. (2008) showed that is required for C grains to obtain the dust mass needed to reproduce the IR observations of SN 2006jc. They argued that in SN 2006jc C grains can form at very early times of 50 days, when energetic photons and electrons are expected to be abundant, so the low sticking probability may reflect the effective destruction of small clusters by collisions with photons and electrons. Given that the formation of C grains in SNe Ia can also occur at an early epoch of 100 days, it can be possible for precursor clusters of C grains to be destroyed significantly.
Another reason for the formation of a large quantity of C grains is the presence of massive (0.05 ) unburned carbon in the outer layer. In the W7 model adopted in this paper, the deflagration wave halts on the way, and the original composition of the WDs with a number ratio of C/O is retained in the outermost ejecta. However, whether the C/O ratio exceeds unity is not conclusive, and the composition of the outer layer of accreting WDs is unclear because of many uncertain processes such as the 12CO reaction rate, convective overshooting, dredge-up from the core, accretion rate from the companion star, and strength of He-shell flashes (e.g., Shen & Bildsten 2009; Y. Kamiya et al. in preparation); if the C/O number ratio is less than unity in the surface layer of the WD and if a majority of C atoms should be locked in CO molecules, C grains may be unable to form efficiently in the cooling ejecta. Thus, observations of CO molecules in SNe Ia can provide meaningful clues to the formation process of C grains as well as the pre-explosion composition of the WDs, although the existence of CO molecules has never been reported for normal SNe Ia to date.
On the other hand, the mass of carbon deduced from the observations is much smaller than in the W7 model. From the analyses of the spectra before the maximum of the light curves (Marion et al. 2006; Tanaka et al. 2008), the mass of carbon in normal SNe Ia is estimated to be at most 0.01 . If, as mentioned in these studies, the abundance of carbon is 10–100 times less than oxygen, the mass of newly formed C grains may be too low for observational signatures of dust formation to be detected. Therefore, from a point of view of dust formation, we assert that the composition of the outermost ejecta is very carbon-poor. Such a small carbon abundance might result from strong He-shell flashes in accreting high-mass WDs (Y. Kamiya et al. in preparation), or be the results of the delayed detonation which burns almost all carbon.
Apart from the outermost layer, the one-dimensional delayed detonation models predict the temperature and density structures and the elemental composition well similar to those in the one-dimensional deflagration models (Iwamoto et al. 1999). This implies that in the delayed detonation models the average radii and masses of newly formed grains except for C grains cannot significantly be different from those obtained in this paper. The remaining amount of unburned carbon in the delayed detonation models is smaller (0.005–0.03 ) than 0.0475 in the deflagration model W7, but it heavily depends on the still uncertain transition density at which the deflagration turns into the detonation. Thus, in order to investigate how the mass of newly formed C grains can be changed by the underlying explosion models, it will be necessary that comprehensive calculations of dust formation are performed for the delayed detonation models with different transition densities.
Here it would be worth mentioning dust formation in the extremely luminous SNe Ia. Recently, four over-luminous SNe Ia have been discovered and suggested to originate from the progenitors with super-Chandrasekhar masses: SN 2003fg (Howell et al. 2006), SN 2006gz (Hicken et al. 2007), SN 2007if (Scalzo et al. 2010; Yuan et al. 2010), and SN 2009dc (Yamanaka et al. 2009; Tanaka et al. 2010; Silverman et al. 2011). Interestingly, these bright SNe Ia show much stronger C lines in their spectra near the maximum brightness than any other normal SNe Ia. This implies that thick unburned C-rich layers are left in their outermost ejecta. Since the formation of C grains accompanies the presence of the C layer as shown in this paper, C grain may be able to condense in these super-Chandra SNe Ia. Indeed, Maeda et al. (2009) reported that SN 2006gz after one year is quite fainter than expected from the peak luminosity, suggesting that such a fading might be caused by dust formation. Taubenberger et al. (2010) also discovered an enhanced fading of the light curve around 200 days for SN 2009dc.
The super-Chandra SNe Ia have high ejecta masses and the low expansion velocities. Thus, the density of the ejecta is higher than those in normal SNe Ia, which may make dust formation more feasible. On the other hand, energy deposition from a large amount of 56Ni (1 ) produced in super-Chandra SNe Ia prevents the gas temperature from quickly decreasing down to the dust condensation temperature (2000 K), which may make the condensation of dust unfeasible. In order to clarify how these competing processes affect the condensation time and mass of dust, the formation of dust in super-Chandra SNe Ia should be explored both theoretically and observationally.
5. Injection of Newly Formed Dust into the ISM
The composition, size, and amount of dust grains injected from SNe into the ISM are determined by the conflicting processes between the formation of dust in the expanding SN ejecta and the subsequent destruction of the dust in the hot gas swept up by the reverse and forward shocks propagating within the SNRs (Nozawa et al. 2007, 2010; Bianchi & Schneider 2007; Nath et al. 2008; Silvia et al. 2010). In this section, in order to reveal the mass of dust ejected from SNe Ia, we investigate the evolution of dust in the shocked gas inside SNRs, applying the results of dust formation calculations.
The calculations of dust evolution in SNRs are based on the model by Nozawa et al. (2007, 2010). In the models, the transport and destruction of dust within SNRs are pursued simultaneously with the time evolution of the gas temperature and density in the spherical symmetry shocks; by treating dust grains as test particles, the deceleration by the gas drag and the erosion by sputtering are self-consistently calculated, according to the initial radius and the initial position of each dust species. The sputtering yield of each dust species is taken from Nozawa et al. (2006).
Note that the destruction efficiency of dust heavily depends on the ambient gas density as well as the initial grain radius. In the present calculations, we assume that the ISM around SNe Ia is uniform, and consider the hydrogen number density of 0.01, 0.1, and 1 cm-3 as the gas density in the ISM, whose gas composition is set as the solar abundance. As for the model of dust formed in the ejecta of SNe Ia, we adopt the results for the models A1 and B1 given in Section 3; the adoption of these models is intended to estimate the possible maximum mass of each dust species supplied into the ISM. Assuming that the ejecta interact with the ambient medium at 30 yr after the explosion, we follow the calculations up to a few yr.
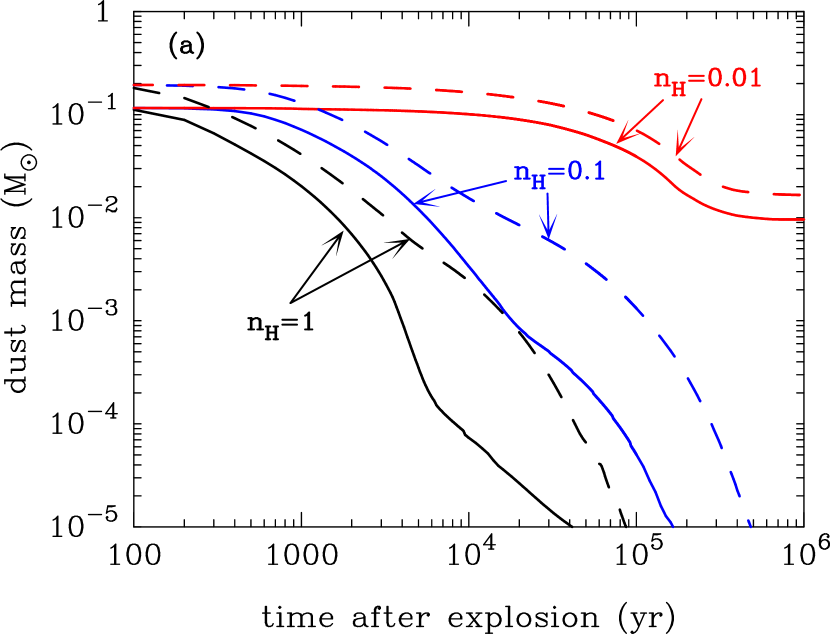
Figure 7(a) shows the time evolutions of the total mass of dust in SNRs for the models A1 (solid lines) and B1 (dashed line). We can see that for cm-3 the dust grains formed in the ejecta of SNe Ia are completely ( ) destroyed before 106 yr. Such effective destruction of dust arises from the following two reasons. (1) Since SNe Ia do not have H-envelope, the reverse shock can sweep up the dust formation region much earlier (500 yr) than in envelope-retaining SNe II-P (1000 yr). At such early times, the gas density in the shocked ejecta is high enough that dust grains are efficiently decelerated and eroded due to frequent collisions with the gaseous ions. (2) Since the radii of newly formed grains are small (0.01 m), they are quickly decelerated by the gas drag soon after encountering the reverse shock. Thus, these small grains are finally trapped in the postshock gas and are destroyed by thermal sputtering without being injected into the ISM.
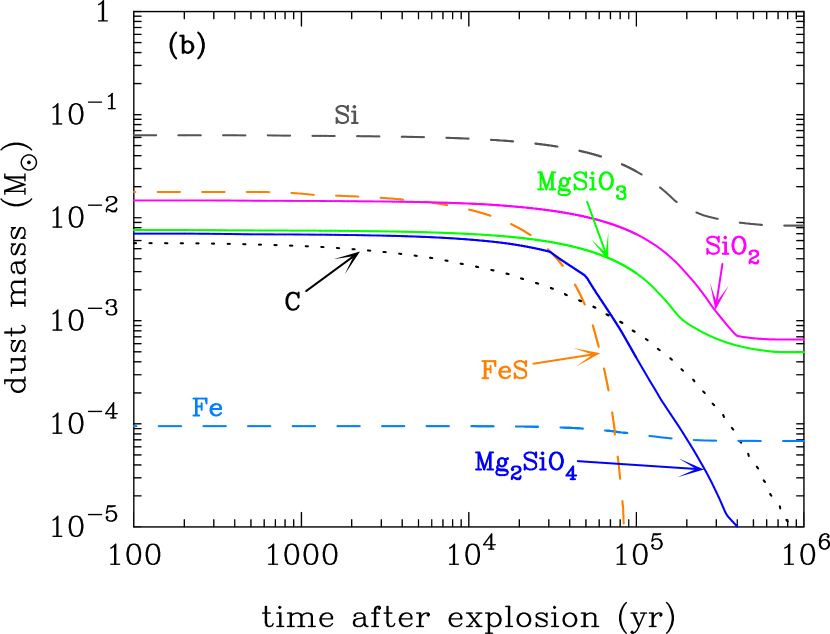
On the other hand, for the ISM density as low as cm-3, the deceleration and destruction of dust in the hot plasma are quite inefficient, and dust of (1-2) survive in the models of A1 and B1; C, FeS, and Mg2SiO4 grains with smaller average radii ( Å) are trapped in the shocked gas to be completely destroyed, whereas a fraction of Si, SiO2, MgSiO3, and Fe grains with larger average radii ( Å) are injected into the ISM. However, the total mass of surviving dust is dominated by Si grains (see Fig. 7(b) for the model A1), whose formation has been expected to be greatly suppressed by the effect of the non-local thermal equilibrium (see Section 4.2). Thus, neglecting the contribution of Si grains, we regard ( ) of silicate grains as a more realistic mass estimate of surviving dust for cm-3 in the model A1 (B1).444In the model B1, in addition to silicate grains of , C grains of can survive for cm-3. However, as discussed in Section 4, the formation of C grains is problematic, judging from the comparison with the observational constraints. Therefore, we do not include here the mass of C grains as an estimate of the total mass of surviving dust. These results indicate that, even if the ambient gas density is very low, the amount of dust ejected from SNe Ia into the ISM is considerably small. We also note that typical ISM densities around SNe Ia are estimated to be 1–5 cm-3 (e.g., Borkowski et al. 2006) and that the ambient density lower than cm-3 results in too extended SNRs whose sizes are incompatible with observed ones of nearby Type Ia SNRs (Badenes et al. 2007).
It should be mentioned that, as discussed in Nozawa et al. (2010), if SNRs expand non-spherically, a part of the newly formed grains may be able to evade the destruction and to be injected in the directions that do not strongly interact with the ambient medium. Recently, a variation of late-time nebular spectra of SNe Ia has been successfully explained by taking into account the global asymmetry in the innermost ejecta that is produced by deflagration developing from the off-center ignition (Maeda et al. 2010a, 2010b, see also Motohara et al. 2006). Aside from the global asymmetry issue, the deflagration flame is also expected to create a small-scale mixing structure (e.g., Röpke et al. 2007). In addition, given that SNe Ia are the end-products of the binary interaction, aspherical circumstellar medium might have been formed around the exploding WDs, which may result in the non-spherical evolution of SNRs. However, the analyses of X-ray morphology of young SNRs (Lopez et al. 2009, 2010) has showed that the remnants of SNe Ia do not seem to be far from spherical symmetry. Although the effect of degree of non-sphericity and small-scale structure on dust survival is uncertain, we conceive here that these effects are not enough to make SNe Ia dominant sources of interstellar dust.
6. Summary
We investigate the formation of dust in the ejecta of SNe Ia, adopting the carbon-deflagration W7 model. In our calculations, we apply the nucleation and grain growth theory, to compare with the results for dust formation in different types of CCSNe in our earlier studies. We find that for the sticking probability of 1, various grain species can condense in the stratified ejecta of SNe Ia, although Fe grains cannot form appreciably, contrary to the expectation. The composition of dust grains formed in SNe Ia reflects the elemental composition of the gas in the ejecta and is basically the same as those in any other CCSNe.
On the other hand, the condensation times of dust in SNe Ia are much earlier ( 100–300 days), and the average radius of newly formed dust are much smaller ( m) than those in SNe II-P. This is due to the low gas density in the ejecta of SNe Ia that do not have H-rich envelopes. We conclude that the radius of newly formed dust depends on the type of SNe and that smaller grains condense in SNe with less massive envelopes. The total mass of dust that can condense in the ejecta of SNe Ia is significantly affected by the sticking probability and the formation efficiency of CO and SiO molecules, ranging from to 0.2 for 0.1–1.
Furthermore, we estimate the temperature of small clusters and evaluate the effect of the non-local thermal equilibrium on the formation process of dust. We find that the non-local thermal equilibrium effect can suppress the condensation of FeS, Si, and Fe grains that are otherwise the main donors to the optical depths. We also calculate the IR emission spectra from the newly formed dust, which would be helpful in discussing the possibility of dust formation from the future observations of SNe Ia. On the other hand, from the present observational constraints, we notice that the formation of massive C grains is suppressed in SNe Ia. This implies that the nucleation of C grains fails due to the destruction by energetic photons and electrons, or that the outermost C-O layer of SNe Ia are burned by the delayed detonation wave, or that the pre-supernova C/O ratio is exceedingly small as a result of strong recurrent He-shell flashes.
Finally, we examine the survival of dust grains formed in the ejecta against their destruction in the SNRs. We find that, unless the gas density around SNe Ia is too low ( cm-3), the newly formed grains are almost completely destroyed in the shocked gas in the course of their injection into the ISM. Even if the asymmetric effect of explosion is taken into account, SNe Ia is likely to be poor producers of interstellar dust. However, SNe Ia are major production factories of heavy elements which will be available for the subsequent growth of the pre-existing grains through accretion onto their surface in the dense molecular clouds.
References
- Aitken et al. (1988) Aitken, D. K., Smith, C. H., James, S. D., Roche, P. F., Hyland, A. R., & McGregor, P. J. 1988, MNRAS, 231, 7
- Amari et al. (1992) Amari, S., Hoppe, P., Zinner, E., & Lewis, R. S. 1992, ApJ, 394, L43
- Aubourg et al. (2008) Aubourg, É., Tojeiro, R., Jimenez, R., Heavens, A., Strauss, M. A., & Spergel, D. N. 2008, A&A, 492, 631
- Badenes et al. (2006) Badenes, C., Borkowski, K., Hughes, J. P., Hwang, U., & Bravo, E. 2006, ApJ, 645, 1373
- Badenes et al. (2007) Badenes, C., Hughes, J. P., Bravo, E., & Langer, N. 2007, ApJ, 662, 472
- Bianchi & Schneider (2007) Bianchi, S., & Schneider, R. 2007, MNRAS, 378, 973
- Borkowski et al. (2006) Borkowski, K. J., et al., ApJ, 642, L141
- Brandt et al. (2010) Brandt, T. D., Tojeiro, R., Aubourg, É., Heavens, A., Jimenez, R., & Strauss, M. A. 2010, AJ, 140, 804
- Chase et al. (1985) Chase, M. W., Jr., Davies, C. A., Downey, J. R., Jr., Frurip, D. J., McDonald, R. A., & Syverud, A. N. 1985, JANAF Thermochemical Tables, 3rd ed. J. Phys. Chem. Ref. Data, 14, Suppl. 1
- Cherchneff & Dwek (2009) Cherchneff, I., & Dwek, E. 2009, ApJ, 703, 642
- Cherchneff & Dwek (2010) Cherchneff, I., & Dwek, E. 2010, ApJ, 713, 1
- Chigai et al. (1999) Chigai, T., Yamamoto, T., & Kozasa, T. 1999, ApJ, 510, 999
- Clayton et al. (1997) Clayton, D. D., Arnett, D., Kane, J., & Meyer, B. S. 1997, ApJ, 486, 824
- Clayton et al. (2001) Clayton, D. D., Deneault, E. A.-N., & Meyer, B. S. 2001, ApJ, 562, 480
- Clayton et al. (1999) Clayton, D. D., Liu, W., & Dalgarno, A. 1999, Science, 283, 1290
- Della Valle et al. (2005) Della Valle, M., Panagia, N., Padovani, P., Cappellaro, E., Mannucci, F., & Turatto, M. 2005, ApJ, 629, 750
- Deneault et al. (2003) Deneault, E. A.-N., Clayton, D. D., & Heger, A. 2003, ApJ, 594, 312
- Deneault et al. (2006) Deneault, E. A.-N., Clayton, D. D., & Meyer, B. S. 2006, ApJ, 638, 234
- Deneault et al. (2009) Deneault, E. A.-N. 2009, ApJ, 705, 1215
- Douvion et al. (2001) Douvion, T., Lagage, P. O., Cesarsky, C. J., & Dwek, E. 2001, A&A, 373, 281
- Dwek (1998) Dwek, E. 1998, ApJ, 501, 643
- Ercolano et al. (2007) Ercolano, B., Barlow, M. J., & Sugerman, B. E. K. 2007, MNRAS, 375, 753
- Gearhart et al. (1999) Gearhart, R. A., Wheeler, J. C., & Swartz, D. A. 1999, ApJ, 510, 944
- Gerardy et al. (2000) Gerardy, C. L., Fesen, R. A., Höflich, P., & Wheeler, J. C. 2000, AJ, 119, 2968
- Gerardy et al. (2002) Gerardy, C. L., Fesen, R. A., Nomoto, K., Maeda, K., Höflich, P., & Wheeler, J. C. 2002, PASJ, 54, 905
- Gerardy et al. (2007) Gerardy, C. L., et al. 2007, ApJ, 661, 995
- Hachisu et al. (2008a) Hachisu, I., Kato, M., & Nomoto, K. 2008a, ApJ, 679, 1390
- Hachisu et al. (2008b) Hachisu, I., Kato, M., & Nomoto, K. 2008b, ApJ, 683, L127
- Hamuy (2003) Hamuy, M., 2003, ApJ, 582, 905
- Hasegawa & Kozasa (1988) Hasegawa, H., & Kozasa, T. 1988, Prog. Theor. Phys. Suppl., 96, 107
- Hayato et al. (2010) Hayato, A., et al. 2010, ApJ, 725, 894
- Hicken et al. (2007) Hicken, M., Garnavich, P. M., Prieto, J. L., Blondin, D. L., Depoy, D. L., Kirshner, R. P., & Parrent, J. 2007, ApJ, 669, L17
- Höflich et al. (1995) Höflich, P., Khokhlov, A. M., & Wheeler, J. C. 1995, ApJ, 444, 831
- Howell et al (2006) Howell, D. A., et al. 2006, Nature, 443, 308
- Hunter et al (2009) Hunter, D. J., et al. 2009, A&A, 508, 371
- Ishihara et al. (2010) Ishihara, D., Kaneda, H., Furuzawa, A., Kunieda, H., Suzuki, T., Koo, B.-C., Lee, H.-G., Lee, J.-J., & Onaka, T. 2010, A&A, 521, L61
- Iwamoto et al. (1999) Iwamoto, K., Brachwitz, F., Nomoto, K., Kishimoto, N., Umeda, H., Hix, W. R., & Thielemann, F.-K. 1999, ApJS, 125, 439
- Iwamoto et al. (2000) Iwamoto, K., et al. 2000 ApJ, 534, 660
- Juarez et al. (2009) Juarez, Y., Maiolino, R., Mujica, R., Pedani, M., Marinoni, S., Nagao, T., Marconi, A., & Oliva, E. 2009, A&A, 494, L25
- Keith & Lazzati (2011) Keith, A. C., & Lazzati, D. 2011, MNRAS, 410, 685
- Khokhlov (1991a) Khokhlov, A. M., 1991a, A&A, 245, L25
- Khokhlov (1991a) Khokhlov, A. M., 1991b, A&A, 245, 114
- Kobayashi & Nomoto (2009) Kobayashi, C., & Nomoto, K. 2009, ApJ, 707, 1466
- Kobayashi et al. (1998) Kobayashi, C., Tsujimoto, T., Nomoto, K., Hachisu, I., & Kato, M. 1998, ApJ, 503, L155
- Kosenko et al. (2010) Kosenko, D., Helder, E. A., & Vink, J. 2010, A&A, 519, 11
- Kotak et al. (2006) Kotak, R., et al. 2006, ApJ, 651, L117
- Kotak et al. (2009) Kotak, R., et al. 2009, ApJ, 704, 306
- Kozasa & Hasegawa (1987) Kozasa, T., & Hasegawa, H. 1987, Prog. Theor. Phys., 77, 1402
- Kozasa et al. (1996) Kozasa, T., Dorschner, J., Henning, Th., & Stognienko, R. 1996, A&A, 307, 551
- Kozasa et al. (1989) Kozasa, T., Hasegawa, H., & Nomoto, K. 1989, ApJ, 344, 325
- Kozasa et al. (1991) Kozasa, T., Hasegawa, H., & Nomoto, K. 1991, A&A, 249, 474
- Kozasa et al. (2009) Kozasa, T., Nozawa, T., Tominaga, N., Umeda, H., Maeda, K., & Nomoto, K. in ASP Conf. Ser., Cosmic Dust - Near and Far, eds. Th. Henning, E. Grüm, & J. Steinacker (San Francisco, CA: ASP), 2009, p43
- Krause et al. (2008) Krause, O., Tanaka, M., Usuda, T., Hattori, T., Goto, M., Birkmann, S., & Nomoto, K. 2008, Nature, 456, 617
- Lazzati (2008) Lazzati, D. 2008, MNRAS, 384, 165
- Liu (1997) Liu, W. 1997, ApJ, 479, 907
- Liu & Dalgarno (1994) Liu, W., & Dalgarno, A. 1994, ApJ, 428, 769
- Liu & Dalgarno (1995) Liu, W., & Dalgarno, A. 1995, ApJ, 454, 472
- Liu & Dalgarno (1996) Liu, W., & Dalgarno, A. 1996, ApJ, 471, 780
- Liu et al. (1992) Liu, W., Dalgarno, A., & Lepp, S. 1992, ApJ, 396, 679
- Lopez et al. (2009) Lopez, L. A., Ramirez-Ruiz, E., Badenes, C., Huppenkothen, D., Jeltema, T. E., & Pooley, D. A. 2009, ApJ, 706, L106
- Lopez et al. (2010) Lopez, L. A., Ramirez-Ruiz, E., Huppenkothen, D., Badenes, C., & Pooley, D. A. 2010, ApJ, submitted (arXiv/1011.0731)
- Maeda et al. (2009) Maeda, K., Kawabata, K., Li, W., Tanaka, M., Mazzali, P. A., Hattori, T., Nomoto, K., & Filippenko, A. V. 2009, ApJ, 690, 1745
- Maeda et al. (2010a) Maeda, K., Taubenberger, S., Sollerman, J., Mazzali, P. A., Leloudas, G., Nomoto, K., & Motohara, K. 2010a, ApJ, 708, 1703
- Maeda et al. (2010b) Maeda, K., et al. 2010b, Nature, 466, 82
- Mannucci et al. (2005) Mannucci, F., Della Valle, M., Panagia, N., Cappellaro, E., Cresci, G., Maiolino, R., Petrosian, A., & Turatto, M. 2005, A&A, 433, 807
- Mannucci et al. (2006) Mannucci, F., Della Valle, M., & Panagia, N. 2006, MNRAS, 370, 773
- Maoz et al. (2010) Maoz, D., Sharon, K., & Gal-Yam, A. 2010, ApJ, 722, 1879
- Marion et al. (2006) Marion, G. H., Höflich, P., Wheeler, J. C., Robinson, E. L., Gerardy, C. L., & Vacca, W. D. 2006, 645, 1392
- Milne et al. (2001) Milne, P. A., The, L.-S., & Leising, M. D. 2001, ApJ, 559, 1019
- Matteucci et al. (2009) Matteucci, F., Spitoni, E., Recchi, S., & Valiante, R. 2009, A&A, 501, 531
- Mazzali et al. (2008) Mazzali, P. A., Sauer, D. N., Pastorello, A., Benetti, S., & Hillebrandt, W. 2008, MNRAS, 386, 1897
- Motohara et al. (2006) Motohara., A., et al. 2006, ApJ, 652, L101
- Nath et al. (2008) Nath, B. B., Laskar, T., & Shull, J. M. 2008, ApJ, 682, 1055
- Nittler et al. (1996) Nittler, L. R., Amari, S., Zinner, E., Woosley, S. E., & Lewis, R. S. ApJ, 1996, 462, L31
- Nomoto (1982) Nomoto, K., 1982, ApJ, 253, 798
- Nomoto et al. (1976) Nomoto, K., Sugimoto, D., & Neo, S. 1976, Ap&SS, 39, L37
- Nomoto et al. (1984a) Nomoto, K., Thielemann, F.-K., & Wheeler, J. C. 1984a, ApJ, 279, L23
- Nomoto et al. (1984b) Nomoto, K., Thielemann, F.-K., & Yokoi, K. 1984b, ApJ, 286, 644
- Nozawa et al. (2008) Nozawa, T., et al. 2008, ApJ, 684, 1343
- Nozawa et al. (2006) Nozawa, T., Kozasa, T., & Habe, A. 2006, ApJ, 648, 435
- Nozawa et al. (2007) Nozawa, T., Kozasa, T., Habe, A., Dwek, E., Umeda, H., Tominaga, N., Maeda, K., & Nomoto, K. 2007, ApJ, 666, 955
- Nozawa et al. (2010) Nozawa, T., Kozasa, T., Tominaga, N., Maeda, K., Umeda, H., Nomoto, K., & Krause, O. 2010, ApJ, 713, 356
- Nozawa et al. (2003) Nozawa, T., Kozasa, T., Umeda, H., Maeda, K., & Nomoto, K. 2003, ApJ, 598, 785
- Roche et al. (1991) Roche, P. F., Aitken, D. K., & Smith, C. H. 1991, MNRAS, 252, 39
- Röpke et al. (2007) Röpke, F. K., Hillebrandt, W., Schmidt, W., Niemeyer, J. C., Blinnikov, S. I., & Mazzali, P. A. 2007, ApJ, 668, 1132
- Scalzo et al. (2010) Scalzo, R. A., et al. 2010, ApJ, 713, 1073
- Scannapieco & Bildsten (2005) Scannapieco, E., & Bildsten, L. 2005, ApJ, 629, L85
- Shen & Bildsten (2009) Shen, K. J., & Bildsten, L. 2009, ApJ, 699, 1373
- Silverman et al. (2010) Silverman, J. M., Ganeshalingam, M., Li, W., Filippenko, A. V., Miller, A. A., & Poznanski, D. 2011, MNRAS, 410, 585
- Silvia et al. (2010) Silvia, D. W., Smith, B. D., & Shull, J. M. 2010, ApJ, 715, 1575
- Spyromilio et al. (1996) Spyromilio, J., & Leibundgut, B. 1996, MNRAS, 283, 89
- Spyromilio et al. (2001) Spyromilio, J., Leibundgut, B., & Gilmozzi, R. 2001, A&A, 376, 188
- Spyromilio et al. (1998) Spyromilio, J., Meikle, W. P. S., Learner, R. C. M., & Allen, D. A. 1988, Nature, 334, 327
- Stehle et al. (2005) Stehle, M., Mazzali, P. A., Benetti, S., & Hillebrandt, W. 2005, MNRAS, 360, 1231
- Sugerman et al. (2006) Sugerman, B. E. K., et al. 2006, Science, 313, 196
- Tanaka et al. (2010) Tanaka, M., et al. 2010, ApJ, 714, 1209
- Tanaka et al. (2008) Tanaka, M., Mazzali, P. A., Benetti, S., Nomoto, K., Elias-Rosa, N., Kotak, R., Pignata, G., Stanishev, V., & Hachinger, S. 2008, ApJ, 677, 448
- Tanaka et al. (2011) Tanaka, M., Mazzali, P. A., Stanishev, V., Maurer, I., Kerzendorf, W. E., & Nomoto, K. 2011, MNRAS, 410, 1725
- Taubenberger et al. (2010) Taubenberger, S., et al. 2010, MNRAS, accepted (arXiv/1011.5665)
- Thielemann et al. (1986) Thielemann, F.-K., Nomoto, K., & Yokoi, K. 1986, A&A, 158, 17
- Tielens (1998) Tielens, A. G. G. M. 1998, ApJ, 499, 267
- Timmes (1995) Timmes, F. X., Woosley, S. E., & Weaver, T. A. 1995, ApJS, 98, 617
- Todini & Ferrara (2001) Todini, P., & Ferrara, A. 2001, MNRAS, 325, 726
- Totani et al. (2008) Totani, T., Morokuma, T., Oda, T., Doi, M., & Yasuda, N. 2008, PASJ, 60, 1327
- Umeda & Nomoto (2002) Umeda, H., & Nomoto, K. 2002, ApJ, 565, 385
- Valiante et al. (2009) Valiante, R., Schneider, R., Bianchi, S., & Andersen, A. C. 2009, MNRAS, 397, 1661
- Yamanaka et al. (2009) Yamanaka, M., et al. 2009, ApJ, 707, L118
- Yuan et al. (2010) Yuan, F., et al. 2010, ApJ, 715, 1338