The excitation function for Li+HFLiF+H at collision energies below 80 meV
Abstract
We have measured the dependence of the relative integral cross section of the reaction Li+HFLiF+H on the collision energy using crossed molecular beams. By varying the intersection angle of the beams from 37o to 90o we covered the energy range 25 meVmeV. We observe a monotonous rise of the cross section with decreasing energy over the entire energy range indicating that a possible translational energy threshold to the reaction is significantly smaller than 25 meV. The steep rise is quantitatively recovered by a Langevin-type excitation function based on a vanishing threshold and a mean interaction potential energy where is the distance between the reactants. To date all threshold energies deduced from ab-initio potentials and zero-point vibrational energies are at variance with our results, however, our findings support recent quantum scattering calculations that predict significant product formation at collision energies far below these theoretical thresholds.
I Introduction
The rapid development of techniques for cooling, trapping and manipulating cold and ultracold molecules opens the opportunity of studying chemical reactivity in the low temperature regime Balakrishnan (2004); Krems (2008); Bell and Softley (2009); Hutson (2010). Cold reactive collisions are not only important limitations to stable trapping of molecules but also present fascinating aspects of their own interest. In the cold collision regime, reactions are governed by quantum dynamics involving tunneling and scattering resonances Krems (2008); Weck and Balakrishnan (2005). For our study of cold collision phenomena we have selected the title reaction due to both the availability of theoretical results and the applicability of a variety of experimental methods.
Attractive from the theoretical point of view is the small number of electrons together with three chemically very different but light atomic constituents that make the slightly exoergic (0.16 meV) reaction Li+HFLiF+H an ideal prototype system for developing methods to calculate reliable ab-initio potential energy surfaces (PESs) Balint-Kurti and Yardley (1977); Zeiri and Shapiro (1978); Shapiro and Zeiri (1979); Chen and Schaefer (1980); Carter and Murrell (1980); Palmieri and Laganà (1989); Parker et al. (1995); Aguado et al. (1997); Jasper et al. (2002); Bobbenkamp et al. (2005); Aguado et al. and to calculate quantum scattering phenomena Parker et al. (1995); Walker et al. (1981); Laganà et al. (1988); Baer et al. (1989); Laganà et al. (1991); Baer et al. (1994a, b); Balint-Kurti et al. (1993); Gögtas et al. (1996); Aguado et al. (1997); Parker et al. (1993); Lara et al. (1998); Laganà et al. (1993); Zhu et al. (1997); Laganà et al. (2000a, b); Höbel et al. (2004); Weck and Balakrishnan (2005); Zanchet et al. (2009). Particularly challenging for a quantitative prediction of observables is the low energy range near threshold where quantum effects dominate and a precise knowledge of the PES around the transition state is essential. Crucial for the assessment of the preciseness and reliability of the applied theoretical methods is the comparison of experimental and computational results. Very qualified for this purpose are certainly angular and velocity distributions of products Bobbenkamp et al. (2005); Höbel (2001) but also the dependence of the relative integral reaction cross section (IRCS) on the translational collision energy, , the excitation function Baer et al. (1994b); Lara et al. (1998); Laganà et al. (2000b); Qiu et al. (2006); Höbel et al. (2001). At low collision energies the excitation function bears direct information on the existence and size of a translational threshold that allows a sensitive examination of the shape of the PES near the transitions state and the height of a possible potential energy barrier.
An inspection of computational results shows that all PESs Balint-Kurti and Yardley (1977); Zeiri and Shapiro (1978); Shapiro and Zeiri (1979); Chen and Schaefer (1980); Carter and Murrell (1980); Palmieri and Laganà (1989); Parker et al. (1995); Aguado et al. (1997); Jasper et al. (2002); Bobbenkamp et al. (2005); Aguado et al. known to date feature a significant barrier at a bent transition state with substantial height. However including zero point energies of both the reactants and the transition state the semi-classical translational threshold energies deduced from these barrier heights turn out to be markedly smaller. For example, for the most frequently used recent PESs, the semi-classical thresholds and barriers amount to 27 and 182 meV Parker et al. (1995), 68 meV and 233 meV Aguado et al. (1997), 56 and 221 meV Bobbenkamp et al. (2005); Aguado et al. , respectively. Neglecting quantum scattering phenomena the semi-classical thresholds manifest the lowest collision energies required for product formation from ground state reactants. An observation of products at energies below these calculated thresholds could be a clue to marked quantum phenomena or to insufficient accuracy of the PESs or to a combination of both. Recently, it has been demonstrated in time-dependent wave packet scattering calculations Weck and Balakrishnan (2005); Zanchet et al. (2009) based on the PES of ref. Bobbenkamp et al. (2005); Aguado et al. that resonances play an important role for Li+HF. They lead to product formation at a significant rate at collision energies far below the semi-classical threshold.
One interesting experimental aspect of the title reaction is the availability of methods that allow to investigate scattering phenomena in a wide range of collision energies from hot (several 100 meV) to cold (20 meV) and ultra-cold ( meV). In an earlier experimental study we have measured the excitation function within the range 82 meV 376 meV Höbel et al. (2001) using molecular beams intersecting at a 90o angle. The energy was varied by applying the seeded beam technique. At energies above 120 meV the function turns out to be roughly constant but below it rises steeply with decreasing and assumes at the lowest energies the largest values within the entire range. Consequently, a threshold to reaction, if existing at all, has to be located below 82 meV.
In the present paper we report the results of another crossed beam study on the excitation function designed to lower the range of translational energy to 25 meV. Variation of the collision energy is achieved by varying the intersection angle of the beams (see below). We find that in the extended energy range the IRCS continues to rise monotonously with decreasing thus shifting the upper boundary of a threshold to below 25 meV.
It should be noted that a novel experimental setup using new techniques for preparing samples of cold atoms and molecules is about to be completed. It will allow to continue our search for the threshold of this process at energies below 1 meV.
II Experimental Methods
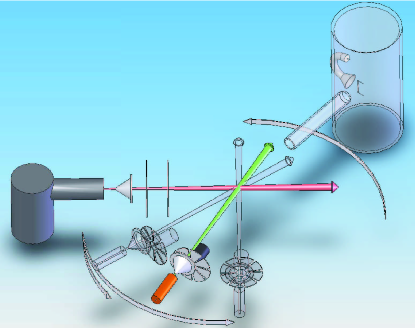
To achieve translational energies below 82 meV (the lowest energy accessible in ref. Höbel et al. (2001)) we abandon the usual 90o geometry and cross the beams at a variable intersection angle Buntin et al. (1987); Hsu et al. (1997); Naulin and Costes (1999). Fig. 1 shows a sketch of the molecular beams arrangement. It deviates from the one used in earlier experimental studies Höbel (2001); Höbel et al. (2001); Loesch and Stienkemeier (1993) only by the setup of the HF-beam. The nozzle is now mounted within a differentially pumped vacuum chamber (not shown) that can be rotated around the scattering volume. In this way the intersection angle of the two beams and thus also the mean relative velocity
| (1) |
and the translational collision energy
| (2) |
can be varied continuously. denotes the reduced mass of the colliding reactants and are their nominal velocity. Depending on , significantly smaller or larger collision energies can be achieved compared to the one obtained for the usual perpendicular intersection. In this study the two vacuum chambers housing the beam sources are designed such that can be varied in the range .
The experimental method and data acquisition follows closely the ones discussed in ref. Höbel et al. (2001). Briefly, the neat HF beam is created by a nozzle heated to around 500 K to avoid clustering. Stagnation pressure (250 mbar) and nozzle temperature are always kept constant. The elevated temperature leads to a mean rotational energy of 8.9 meV Höbel et al. (2001) and a population of the first vibrationally excited state of . The beam is chopped with a frequency of a few Hz using a tuning-fork like modulator or a chopper wheel at a duty cycle of 50% and the intensity is monitored by a quadrupole mass spectrometer detector equipped with an electron bombardment ion source. The Li beam is diluted with Ne and its intensity is measured by surface ionization on a hot rhenium (Re) ribbon. During an experimental run only the intersection angle is varied while the operational conditions of the beams are kept constant.
| Run | ||||
|---|---|---|---|---|
| A/B | 1530 | 221 | 1205 | 185 |
| C | 1750 | 290 | 1215 | 195 |
The velocity of both beams is determined by conventional time-of-flight (TOF) arrangements. The (density) velocity distributions, , are extracted from the measured TOF profiles by fitting the parameters of the expression
| (3) |
to the data. The parameters and of the various data sets are compiled in Table 1. The velocity spreads of the Li and HF beams result in an experimental relative uncertainty of the collision energy of about 25%.
The products created in the intersection volume of the beams are detected via surface ionization on a hot Re ribbon mounted in a separately pumped ultra high vacuum chamber (residual gas pressure below mbar). A channeltron converts the ions desorbing from the Re surface to electron pulses which are counted by a two channel scaler synchronized with the HF beam modulator. One scaler counts the signal and background, the other only the background pulses. The detected scattering intensity (signal) is then derived as difference of the two scaler contents. Angular distributions of the signal are obtained by rotating the main detector automatically around the intersection volume in the plane of the beams within a wide range of laboratory (LAB) scattering angles . Crucial for the data analysis (see below) is the knowledge of time-of-flight (TOF) distributions of scattered particles at various scattering angles. They are measured employing a fast spinning chopper wheel with 8 equally spaced slots (2 mm wide) mounted between the skimmer of the HF beam and the scattering volume (see Fig. 1). The length of the flight path is 254 mm.
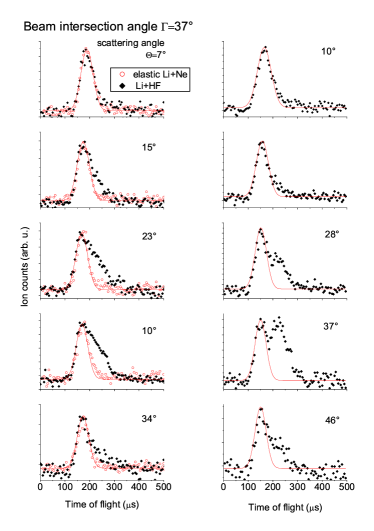
The surface ionization is not specific with respect to alkali atoms or alkali compounds and detects both species with roughly the same efficiency. Therefore, the detected scattering intensity is proportional to the sum of fluxes of both the elastically scattered Li atoms and the products LiF, . To separate both components we employ the TOF distributions; examples are displayed in Fig. 2 for and . All TOF profiles feature a peak at short flight times and a broad shoulder or even a second peak at longer times. At and higher Li velocities the peaks are always well separated Höbel et al. (2001).
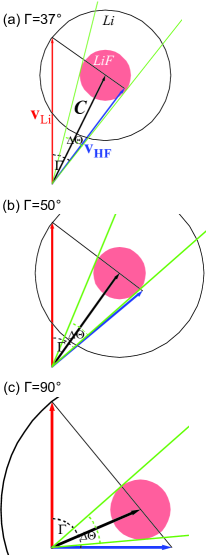
The collision kinematics are illustrated in Newton-diagrams (Fig. 3) relating the LAB and center-of-mass (CM) frame velocities of reactants and products for beam intersection angles , and . The light arrows represent the laboratory frame velocity vectors and of the reactants Li and HF which include the intersection angle . The radius of the outer circle around the tip of the centroid velocity vector corresponds to the velocity of the elastically scattered Li atoms in the CM system, the radius of the inner shaded circle represents the maximal product velocity. The light straight lines that are tangent to the inner circle indicate the range of scattering angles where reaction products LiF are expected to occur in addition to elastically scattered Li atoms. Elastically scattered Li atoms along have higher speeds than the LiF products and will therefore reach the detector at shorter flight times. Li atoms that are elastically scattered in the opposite direction in the CM frame have low speeds in the LAB frame and will spatially disperse on their way to the detector such that no significant contribution to the signal is expected.
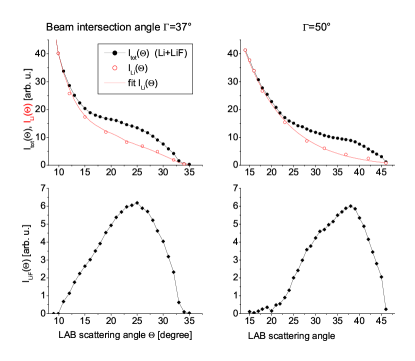
Thus, in Fig. 2 the peak at short flight times (fast particles) is attributed to elastically scattered Li atoms while the one at later times (slow particles) is associated with reaction products LiF. The solid line represents a numerically simulated TOF-distribution of elastically scattered Li atoms whose reliability was confirmed by a comparison with TOF profiles measured for the pure elastic system Li+Ne that features practically the same kinematics as Li+HF (open circles in Fig. 2). The elastic TOF profile is then fitted to the fast slope of the data. The area below this scaled elastic peak over the area below the entire TOF profile eventually provides the fraction of the detected scattering intensity associated with elastically scattered atoms. For a given this fraction has been determined at scattering angles for which TOF distributions are available and used to isolate the angular distribution of the elastic component from the detected scattering intensity . The result of this procedure is shown in Fig. 4 (upper panel). The open circles represent the angular distribution of the elastic component and the solid line is a best fit curve through these points. The difference between the detected scattering intensity and the elastic component eventually yields the angular distribution of the product flux (lower panel in Fig. 4). For more details see Höbel et al. (2001).
In principle the signal contribution identified with reactive scattering could also be generated by rotationally inelastic collisions. At inelastic collisions Li+HFLi+HF would yield Li atoms with similar CM speeds as the LiF products. At , Li atoms could be generated at speeds similar to those of LiF in inelastic collisions Li+HFLi+HF. Such selective rotation-changing collisions appear quite implausible, though, given the common scaling laws that predict a fast decay of the rotational inelastic collision cross section with increasing level spacing Raghavan et al. (1985).
III Results
The IRCS, , is proportional to the total flux of products generated in the scattering volume and defined by the expression
| (4) |
Here, and denote the number densities of the indicated beams at the intersection volume and the mean relative velocity, respectively. Deviating from our earlier study Höbel et al. (2001), we leave the operational conditions of the beam sources constant and vary only the intersection angle . Thus both densities and are constant, can be easily deduced from the most probable beam velocities (eq. 1), and an inspection of the intersection geometry shows that holds approximately.
The crucial quantity is not directly accessible in the present in-plane scattering experiment but can be deduced from the measured total in-plane product flux using the formal expression
| (5) |
Inserting eq. 5 into eq. 4 and suppressing all constant quantities we obtain the expression
| (6) |
relating the measured quantities and the relative integral reaction cross section. The ratio of fluxes in eqs. 5 and 6 corrects for the fraction of products that miss the detector; it can be readily deduced from the relative differential reaction cross section (DRCS) in the center-of-mass frame. In a previous study Höbel (2001) using perpendicularly intersecting beams we have measured the relative DRCS at 6 energies within the range 82 meV 376 meV and found that the ratio is constant with respect to the energy within an error margin of Höbel et al. (2001). Unfortunately, a comparable extensive investigation of DRCSs is not yet available for the present low energy range. However, a preliminary analysis of the product angular distributions measured at (24 meV) and 50o (45 meV) indicates that from 119 meV Höbel (2001) ( to 24 meV () a transition from the forward/backward to a preferred sideways type DRCS occurs. Taking this into account we find for all data sets that the product of factors left to the in-plane flux in eq. 6 is constant within the band width . In view of a forthcoming more sophisticated determination of the DRCS we suppress these small corrections and derive the relative IRCS from the data using the simplified relation
| (7) |
We have measured three sets of angular distributions A, B, and C at various intersection angles for the beam parameters given in Table 1. The constancy of the operational conditions was checked carefully by measuring a reference angular distribution repeatedly during one run. The intersection angles range from 37o to 90o (A,B) and 48 (C) corresponding to the energy range 25 meV 108 meV (A,B) and 50 meV 131 meV (C). For each angular distribution of a given set we measured between four and six TOF-profiles to separate elastic and reactive scattering.
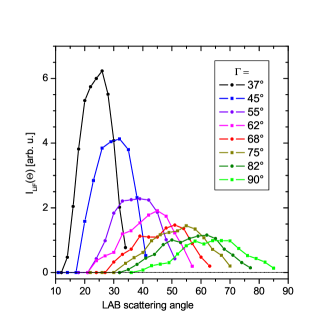
As an example we show in Fig. 5 the product angular distributions of set A. With decreasing the curves shift to smaller LAB angles according to the changing kinematics (Fig. 3) and their peak intensities rise dramatically. The total in-plane intensity or (eq. 7) is given by the sum over all product intensities multiplied by the Lab-angle increment (area below the curves),
| (8) |
| /meV | /degree | |||
|---|---|---|---|---|
| A | B | C | ||
| 25 | 37 | 83411 | 110104 | |
| 35 | 45 | 68510 | 93050 | |
| 48 | 55 | 45930 | 60628 | |
| 50 | 48 | 395200 | ||
| 59 | 62 | 39040 | 55431 | |
| 64 | 65 | 51909 | ||
| 69 | 68 | 31774 | 46050 | |
| 71 | 60 | 335300 | ||
| 80 | 65 | 289750 | ||
| 81 | 75 | 31774 | 48590 | |
| 86 | 68 | 253200 | ||
| 94 | 82 | 30517 | 44170 | |
| 100 | 75 | 238650 | ||
| 108 | 90 | 27465 | 39540 | |
| 114 | 82 | 239200 | ||
| 131 | 90 | 199300 |
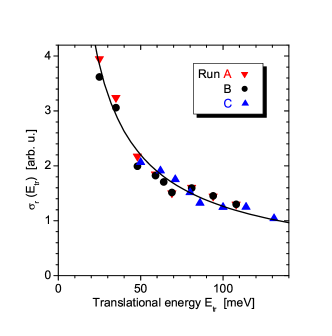
The results for set A are compiled in Table 2 together with those for B and C and displayed in Fig. 6 as a function of the collision energy. The data points are normalized such that they agree optimally within the overlapping energy range. Their statistical error is not included in Fig. 6 for clarity. It can be estimated from the scatter of the points and amounts to about essentially due to uncertainties occurring in the process of separating elastic and reactive scattering. The solid line through the data points represents the simple power law .
IV Discussion
A strong motivation for performing the present experiments was the search for an answer to the question raised in the earlier study Höbel et al. (2001): How does the excitation function continue below a collision energy of 82 meV? The previous results indicated two possibilities: either the excitation function assumes a maximum followed by a decline towards a threshold as one would expect for a reaction featuring a non-vanishing translational threshold energy or it continues to increase as expected for a reaction without threshold. The results of the present investigation strongly support the assumption that no threshold hinders the reaction of Li with HF. The excitation function continues to ascend monotonously at least down to 25 meV and is likely to continue this way ArS . Due to the elevated nozzle temperature of 500 K, required to suppress dimerisation, low rotational states of HF are populated with a mean rotational energy of 8.9 meV corresponding to a mean rotational quantum number of Höbel et al. (2001). Thus the indicated threshold energies refer on average to the reaction Li+HF (,=1.4). This internal energy may increase the threshold of the ground state reaction Li+HF(,) on average by the mean rotational energy.
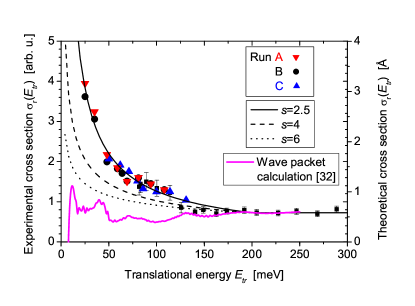
In Fig. 7 we have combined the results of the present and earlier experiments and obtain an excitation function that covers now a wide energy range of more than one order of magnitude from 25 meV to 376 meV. The curve can be subdivided into three sections: above 200 meV it is more or less constant, below 130 meV the function rises monotonously with decreasing , and in between it gradually changes the shape correspondingly. This behavior suggests the following classical reaction model.
(a) At energies meV a rigid sphere collision mechanism Qiu et al. (2006); Levine and Bernstein (1987) prevails where the reaction occurs with a constant, energy independent probability whenever the impact parameter is smaller than the maximal one . The resulting constant IRCS is then . The mechanism neglects long range forces and thus all trajectories of the approaching reagents are straight lines.
(b) Below 130 meV long range forces start getting important. The force curbs the trajectories of the colliding reagents toward the center of the force and thus collisions with impact parameters larger than may react. With decreasing energy the influence of the forces grows and thus the maximal impact parameter and the IRCS increase. Provided there is a vanishing threshold the IRCS continues to rise and eventually diverges classically for . Assuming that (i) the interaction potential energy is where is the distance between the reagents, and (ii) the reaction occurs with a constant probability whenever the reagents overcome the effective potential’s maximum, then the IRCS is described by the "Langevin" power law Qiu et al. (2006); Levine and Bernstein (1987). The best fit curve in Fig. 6 corresponds accordingly to an interaction potential . In Fig. 7 the result (solid line) is compared with curves referring to (dotted line) and (dashed line) for energies below 200 meV. The corresponding potentials describe the long range forces of an atom-molecule () and of an ion-molecule system (). Both curves feature the typical steep rise but are clearly at variance with our data. The best fit power indicates that in our low energy range the chemical forces near the hard sphere radius are responsible for the rise of the IRCS rather than the asymptotic long range forces with .
(c) Between 130 and 200 meV the transition between the hard sphere and the potential energy dominated mechanism occurs.
The prediction of this classical model is illustrated in Fig. 7 as solid line where we have omitted the transition region and matched directly the hard sphere and Langevin functions at 200 meV. The curve recovers the data nearly quantitatively over this wide energy range.
The above classical model suggests a vanishing threshold but the experimental results provide only an upper boundary and a small threshold may well be in agreement with our findings. According to classical mechanics such a translational energy threshold is tightly related to the height of the potential energy barrier separating reagents and products. Provided the approaching molecules are in their vibrational and rotational ground states (, ) the formation of products requires that the translational energy of the approaching particles exceeds . A non vanishing reaction threshold is then the consequence of an existing barrier.
Quantum mechanics relaxes the tight classical relation between threshold and barrier height. The colliding particles possess zero-point vibrational energy that varies during the approach adiabatically from the zero-point energy of the free molecule to the one of the triatomic aggregate at the barrier . Taking this into account, product formation for ground state molecules (,) is then allowed in a classical sense, if the sum of the collision and zero-point energy of the reagent molecule exceeds the sum of the potential and zero-point energy at the barrier. The resulting semi-classical threshold energy
| (9) |
includes in addition to the barrier height also the relevant zero-point energies and . However, in contrast to classical mechanics, eq. 9 constitutes no rigorous lower limit for the translational energy leading to product formation. Due to quantum phenomena such as tunneling and resonances products may be formed also at collision energies far below this semi-classical threshold (see below).
To date all PESs available for Li+HF predict a significant barrier height Balint-Kurti and Yardley (1977); Zeiri and Shapiro (1978); Shapiro and Zeiri (1979); Chen and Schaefer (1980); Carter and Murrell (1980); Palmieri and Laganà (1989); Parker et al. (1995); Aguado et al. (1997); Jasper et al. (2002); Bobbenkamp et al. (2005); Aguado et al. . Including the zero point energy of HF (256 meV) and of the transition state (95 meV depending on the geometric structure of the PES) the semi-classical threshold (eq. 9) for the most recent PESs amounts to 27 meV Parker et al. (1995), 56 meV Bobbenkamp et al. (2005); Aguado et al. and 68 meV Aguado et al. (1997). The present experiments provide as upper boundary for the threshold energy 25 meV and, considering the significant product flux observed for the Ar seeded Li experiment ArS , 17 meV. Furthermore, the excellent fit of the data predicted by a model based on a vanishing threshold suggests a threshold located at energies meV. Thus our results suggest that the experimental threshold energy lies markedly below the predicted semi-classical values. This discrepancy could be due to insufficient accuracy of the computational methods used to calculate the PESs or to quantum effects that promote reactions at energies far below the semi-classical threshold. The latter is supported by recent wave packet calculations based on the PES of Bobbenkamp et al. (2005); Aguado et al. that predict a threshold for the total reaction cross section at about 10 meV which is qualitatively reconcilable with our measurements Zanchet et al. (2009). The theoretical excitation function Zanchet et al. (2009) is displayed in Fig. 7. The curve exhibits only a slight modulation around the value Å as the translational energy is reduced down from meV to a threshold value of about 10 meV (see Fig. 7). The shape of the predicted excitation function departs significantly from the experimental one but the threshold energy is in accord with the present result. As the main source for product formation near threshold collisions with small (total angular momentum) have been identified. The reaction probabilities for exhibit a rich spectrum of oscillations and resonances as a function of energy Weck and Balakrishnan (2005); Zanchet et al. (2009) but these structures disappear if realistic IRCSs are calculated by summing over all .
V Conclusion
The benchmark reaction Li+HFLiF+H has been studied at translational energies down to 25 meV using a new crossed-beam apparatus with variable scattering angle between Li and HF beams. This arrangement allows to tune the translational energy while keeping the beam source conditions constant. The integral reactive scattering rate (excitation function) is deduced from angle-resolved scattering as well as from time-of-flight traces in comparison with purely elastic Li+Ne scattering. The resulting excitation function, which extends earlier measurements to lower energies, steeply rises as the collision energy falls below about 150 meV. This behavior is consistent with a barrier-less Langevin-type reactive process with -scaling of the atom-molecule interaction potential. Alternatively, an energy threshold below meV may be present as predicted by recent wave packet simulations Zanchet et al. (2009).
Future efforts to further reduce the collision energy for conclusively disclosing or ruling out the existence of a reaction threshold will demand more sophisticated experimental approaches. To this end, a magneto-optical trap for preparing an ultracold Li scattering target is currently being set up and will be combined with a source for slow and cold molecules based on a rotating nozzle and electrostatic guiding Strebel et al. (2010).
Acknowledgements.
Support from the Deutsche Forschungsgemeinschaft is gratefully acknowledged.References
- Balakrishnan (2004) N. Balakrishnan, J. Chem. Phys. 121, 5563 (2004).
- Krems (2008) R. V. Krems, Phys. Chem. Chem. Phys. 10, 4079 (2008).
- Bell and Softley (2009) M. T. Bell and T. P. Softley, Mol. Phys. 107, 99 (2009).
- Hutson (2010) J. Hutson, 327, 788 (2010).
- Weck and Balakrishnan (2005) P. F. Weck and N. Balakrishnan, J. Chem. Phys. 122, 154309 (2005).
- Balint-Kurti and Yardley (1977) G. Balint-Kurti and R. Yardley, Faraday Disc. Chem. Soc. 62, 77 (1977).
- Zeiri and Shapiro (1978) Y. Zeiri and M. Shapiro, Chem. Phys. 31, 217 (1978).
- Shapiro and Zeiri (1979) Y. Shapiro and Y. Zeiri, J. Chem. Phys. 70, 5264 (1979).
- Chen and Schaefer (1980) M. Chen and H. Schaefer, J. Chem. Phys. 72, 4376 (1980).
- Carter and Murrell (1980) S. Carter and J. Murrell, Mol. Phys. 41, 567 (1980).
- Palmieri and Laganà (1989) P. Palmieri and A. Laganà, J. Chem. Phys. 91, 7303 (1989).
- Parker et al. (1995) G. Parker, A. Laganà, and S. Crocchianti, J. Chem. Phys. 102, 1238 (1995).
- Aguado et al. (1997) A. Aguado, M. Paniagua, M. Lara, and O. Roncero, J. Chem. Phys. 107, 10085 (1997).
- Jasper et al. (2002) A. Jasper, M. Hack, D. Truhlar, and P. Piecuch, J. Chem. Phys. 116, 8353 (2002).
- Bobbenkamp et al. (2005) R. Bobbenkamp, A. Paladini, A. Russo, H. Loesch, M. Menéndez, E. V. F. Aoiz, and H.-J. Werner, J. Chem. Phys. 122, 244304 (2005).
- (16) A. Aguado, M. Paniagua, and H.-J. Werner.
- Walker et al. (1981) R. Walker, Y. Zeiri, and M. Shapiro, J. Chem. Phys. 74, 1763 (1981).
- Laganà et al. (1988) A. Laganà, E. García, and O. Gervasi, J. Chem. Phys. 89, 7238 (1988).
- Baer et al. (1989) M. Baer, E. García, A. Laganà, and O. Gervasi, Chem. Phys. Lett. 158, 362 (1989).
- Laganà et al. (1991) A. Laganà, X. Giméenez, E. García, and O. Gervasi, Chem. Phys. Lett. 176, 280 (1991).
- Baer et al. (1994a) M. Baer, H. Loesch, H.-J. Werner, and I. Last, Chem. Phys. Lett. 219, 372 (1994a).
- Baer et al. (1994b) M. Baer, I. Last, and H. Loesch, J. Chem. Phys. 101, 9648 (1994b).
- Balint-Kurti et al. (1993) G. Balint-Kurti, F. Gögtas, S. Mort, A. Offer, A. Laganà, and O. Gervasi, J. Chem. Phys. 99, 9567 (1993).
- Gögtas et al. (1996) F. Gögtas, G. Balint-Kurti, and A. Offer, J. Chem. Phys. 104, 7927 (1996).
- Parker et al. (1993) G. Parker, R. Pack, and A. Laganà, Chem. Phys. Lett. 202, 75 (1993).
- Lara et al. (1998) M. Lara, A. Aguado, O. Roncero, and M. Paniagua, J. Chem. Phys. 109, 9391 (1998).
- Laganà et al. (1993) A. Laganà, R. Pack, and G. Parker, J. Chem. Phys. 99, 2269 (1993).
- Zhu et al. (1997) W. Zhu, D. Wang, and J. Zhang, Theor. Chem. Acc. 96, 31 (1997).
- Laganà et al. (2000a) A. Laganà, A. Bolloni, and S. Crocchianti, Phys. Chem. Chem. Phys. 2, 535 (2000a).
- Laganà et al. (2000b) A. Laganà, A. Bolloni, S. Crocchianti, and G. Parker, Chem. Phys. Lett. 324, 466 (2000b).
- Höbel et al. (2004) O. Höbel, R. Bobbenkamp, A. Paladini, A. Russo, and H. Loesch, Chem. Phys. Lett. 6, 2168 (2004).
- Zanchet et al. (2009) A. Zanchet, O. Roncero, T. González-Lezana, A. Rodríguez-López, A. Aguado, C. Sanz-Sanz, and S. Gómez-Carrasco, J. Phys. Chem. A 113, 14488 (2009).
- Höbel (2001) O. Höbel, Ph.D. thesis, Universität Bielefeld (2001).
- Qiu et al. (2006) M. Qiu, Z. Ren, L. Che, D. Dai, S. A. Harich, X. Wang, X. Yang, C. Xu, D. Xie, M. Gustafsson, et al., Science 311, 1440 (2006).
- Höbel et al. (2001) O. Höbel, M. Menéndez, and H. Loesch, Phys. Chem. Chem. Phys. 3, 3633 (2001).
- Buntin et al. (1987) S. Buntin, C. Giese, and W. Gentry, J. Chem. Phys. 87, 1443 (1987).
- Hsu et al. (1997) Y. Hsu, J.-H. Wang, and K. Liu, J. Chem. Phys. 107, 2351 (1997).
- Naulin and Costes (1999) C. Naulin and M. Costes, Chem. Phys. Lett. 310, 231 (1999).
- Loesch and Stienkemeier (1993) H. Loesch and F. Stienkemeier, J. Chem. Phys. 98, 9570 (1993).
- Raghavan et al. (1985) K. Raghavan, S. K. Upadhyay, N. Sathyamurthy, and R. Ramaswamy, J. Chem. Phys. 83, 1573 (1985).
- (41) In an experiment with an Ar seeded Li-beam we find at and 17meV still a significant flux of products. However, we could not complete a full data set that overlaps with sets A and B.
- Levine and Bernstein (1987) R. Levine and R. Bernstein, Molecular Reaction Dynamics and Chemical Reactivity (Oxford University Press, New York, 1987).
- Strebel et al. (2010) M. Strebel, F. Stienkemeier, and M. Mudrich, Phys. Rev. A 81, 033409 (2010).