The Spitzer discovery of a galaxy with infrared emission solely due to AGN activity. ††thanks: based on observations obtained with Spitzer.
Abstract
Aims. We present an analysis of a galaxy (SAGE1CJ053634.78-722658.5) at a redshift of 0.14 of which the infrared (IR) emission is entirely dominated by emission associated with the active galactic nucleus.
Methods. We present the 537 m Spitzer/IRS spectrum and broad wavelength spectral energy distribution (SED) of SAGE1CJ053634.78-722658.5, an IR point-source detected by Spitzer/SAGE (Meixner et al 2006). The source was observed in the SAGE-Spec program (Kemper et al., 2010) and was included to determine the nature of sources with deviant IR colours. The spectrum shows a redshifted (=0.140.005) silicate emission feature with an exceptionally high feature-to-continuum ratio and weak polycyclic aromatic hydrocarbon (PAH) emission bands. We compare the source with models of emission from dusty tori around AGNs from Nenkova et al. (2008). We present a diagnostic diagram that will help to identify similar sources based on Spitzer/MIPS and Herschel/PACS photometry.
Results. The SED of SAGE1CJ053634.78-722658.5 is peculiar because it lacks far-IR emission due to cold dust and a clear stellar counterpart. We find that the SED and the IR spectrum can be understood as emission originating from the inner 10 pc around an accreting black hole. There is no need to invoke emission from the host galaxy, either from the stars or from the interstellar medium, although a possible early-type host galaxy cannot be excluded based on the SED analysis. The hot dust around the accretion disk gives rise to a continuum, which peaks at 4 m, whereas the strong silicate features may arise from optically thin emission of dusty clouds within 10 pc around the black hole. The weak PAH emission does not appear to be linked to star formation, as star formation templates strongly over-predict the measured far-IR flux levels.
Conclusions. The SED of SAGE1CJ053634.78-722658.5 is rare in the local universe but may be more common in the more distant universe. The conspicuous absence of host-galaxy IR emission places limits on the far-IR emission arising from the dusty torus alone.
Key Words.:
ISM: lines and bands — galaxies: active — galaxies: peculiar — quasars: individual (SAGE1CJ053634.78-722658.5) — infrared: galaxies1 Introduction
The Spitzer SAGE survey of the Large Magellanic Cloud (LMC; Meixner et al., 2006), hereafter referred to as SAGE-LMC has provided a deep infrared (IR) photometric survey of 7o7o covering the LMC in all Spitzer (Werner et al., 2004) Infrared Array Camera (IRAC; Fazio et al., 2004) and Multi-Band Imaging Photometer for Spitzer (MIPS; Rieke et al., 2004) photometric wavelengths. Combined with existing Two Micron All Sky Survey (2MASS; Skrutskie et al., 2006), the survey has yielded a catalogue of 6,000,000 point-sources. Most of these are either stars with an IR excess in the LMC, or foreground stars located in the Milky Way. There is also a significant population of background galaxies, uniformly distributed over the SAGE-LMC footprint (Whitney et al., 2008; Kozłowski & Kochanek, 2009). The SAGE-Spec program (Kemper et al., 2010) is a Spitzer spectroscopic follow-up survey designed to verify the initial SAGE-LMC classifications (Meixner et al., 2006; Blum et al., 2006; Whitney et al., 2008) and investigate the nature of sources that could not be identified based on their photometry. Here we report on a point-source, in the SAGE-LMC catalogue111http://irsa.ipac.caltech.edu/cgi-bin/Gator/nph-scan?submit=Select&projshort=SPITZER identified as SAGE1CJ053634.78-722658.5 (hereafter referred to as SAGE1CJ053634) at moderate redshift (=0.14) as derived from the observed wavelength of the polycyclic aromatic hydrocarbon (PAH) features, which is entirely dominated in its IR spectral energy distribution (SED) by warm dust (silicate) emission, rather than emission from star formation which is the case in nearly all other galaxies yet observed. Here, we show that the infrared emission is arising solely from dust heated by an active galactic nuclei (AGN), providing a unique opportunity to study the AGN infrared SED without the contaminating emission from the host galaxy.
2 Results
2.1 Observations
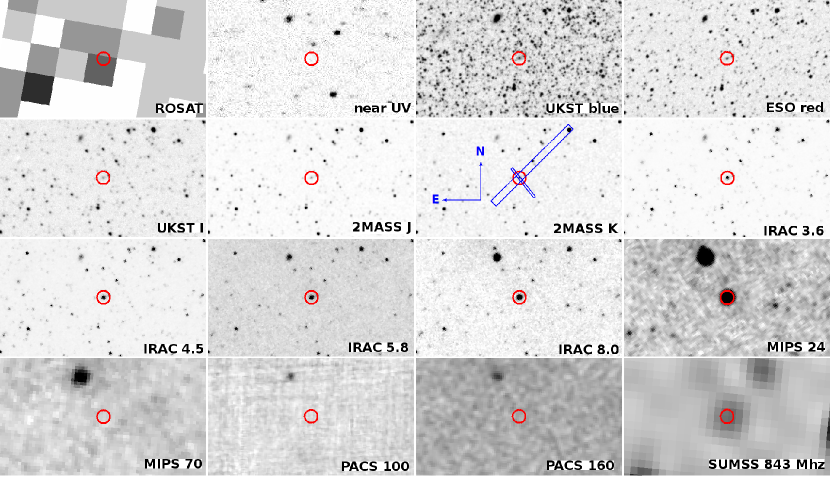
The mid-IR spectrum of SAGE1CJ053634 (=05:36:34.358, =72:26:57.50, J2000) is obtained using the InfraRed Spectrograph (IRS; Houck et al., 2004) on board the Spitzer Space Telescope (Werner et al., 2004). The observations and data reduction were performed in the standard way for point-sources, described by Kemper et al. (2010). The position of the slit is shown in the 2MASS-Ks panel of Fig. 1.
2.2 The mid-IR spectrum and SED
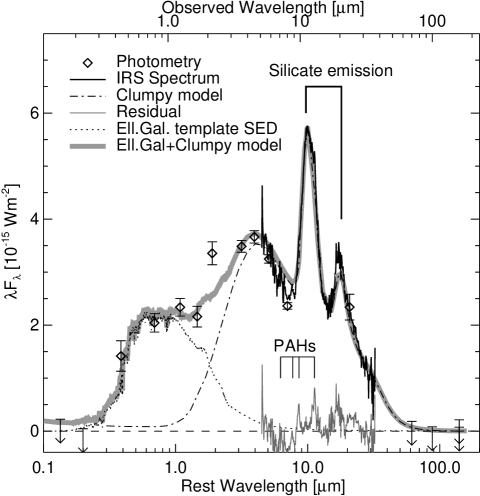
The global SED and the IRS spectrum of SAGE1CJ053634 are presented in Fig. 2, shifted to rest-wavelength. The photometry consists of IRAC and MIPS data from the SAGE-LMC project (Meixner et al., 2006), PACS data from the HERITAGE project (Meixner et al., 2010) and near-IR data from the 2MASS project (Skrutskie et al., 2006), supplemented by near-UV (GALEX222http://galex.stsci.edu; Martin et al., 2005), optical (SuperCosmosSkySurvey333http://www-wfau.roe.ac.uk/sss; Cioni et al., 2000; Lasker et al., 2008) and a radio measurement (Mauch et al., 2003; Filipović et al., 1995). Maps of the source and its surroundings are shown in Fig. 1.
The IRS spectrum (see Fig. 2) shows weak PAH features at the expected rest wavelengths of 6.23, 7.7, 8.6 and 11.25 m, from which a redshift of is derived. No convincing detections of atomic transitions are present. The most striking features in the IRS data are the very strong emission bands at 9.7 and 18 m, due to the SiO stretching and bending mode in silicates, respectively. In addition, there is a weak 11.25 m PAH emission band at the long wavelength extreme of the 9.7 m band. The SED (Fig. 2) is dominated by the mid-IR emission peaking around 4 m. There appears to be very little cooler material in the galaxy as this would show up as emission at longer wavelengths (50 m). In fact, the flux of the IRS spectrum is already declining at its longest wavelengths (30 m).
The radio flux densities are 40 and 13 mJy at 6.2 and 36 cm (Filipović et al., 1995; Mauch et al., 2003), respectively. The estimated value (ratio of 6 cm to 2500 Å flux density) is 200, making it a radio-loud source (e.g. Jiang et al., 2007). The measurement at 6.2 cm is done with a large beam which makes the association with this source uncertain. The flux density at 36 cm, which is clearly coincident with SAGE1CJ053634 (see Fig. 1) still implies a radio-loud source. There is also a possible coincidence with an X-ray source detected by ROSAT (Voges et al., 1999, see Fig. 1). The main observational characteristics of SAGE1CJ053634 are summarised in Table 1.
2.3 Nature of the source
The fact that the observed features in the spectrum are redshifted by the amount observed implies that the source is not located in the Milky Way or in the LMC. There are several indications that SAGE1CJ053634 is a quasar: the presence of radio emission and the possible association of an X-ray detection. Moreover, the IR SED exhibits the main characteristics of other quasars. First, the luminosity of L☉, inferred from the X-ray and IR emission, is within the typical range for quasars. Secondly, the emission bump around 4 m can be attributed to emission of the hottest dust in a clumpy torus near the accretion disk around the central black hole (e.g. Siebenmorgen & Efstathiou, 2005). This emission feature is the basis of the IRAC colour selection of active galaxies (Stern et al., 2005). Finally, the silicate emission is a characteristic of quasar sources (e.g. Siebenmorgen et al., 2005b; Hao et al., 2007b; Shi et al., 2006) depending on the viewing angle of the source (e.g. Shi et al., 2006), albeit not exclusive to quasars, as it is sometimes observed towards elliptical galaxies (e.g. Bressan et al., 2006). However, the ellipticals exhibit significantly weaker silicate emission and the energy distribution is dominated by the stellar emission of the evolved stars peaking around 1 m (see also Fig. 3).
2.4 Silicate emission
| Measurement | Value | Uncertainty | Unit | Remark |
|---|---|---|---|---|
| redshift | 0.14 | 0.005 | PAH bands | |
| dluminosity | 654 | 25 | Mpc | |
| - | 39 | mag | ||
| 10log(L | 9.6 | L☉ | ROSAT | |
| 10log(LFIR) | 10.0 | L☉ | 40-150 m | |
| 10log(LIR) | 10.8 | L☉ | 8-1000 m | |
| far-UV | 10 | (3) | Jy | GALEX |
| near-UV | 3 | (3) | Jy | GALEX |
| B | 18.514 | 0.13 | mag | SuperCOSMOS |
| Gunn-i | 16.819 | 0.092 | mag | DENIS |
| J | 15.688 | 0.077 | mag | 2MASS |
| H | 14.993 | 0.098 | mag | 2MASS |
| Ks | 13.743 | 0.070 | mag | 2MASS |
| IRAC 3.6 | 3.67 | 0.11 | mJy | Spitzer |
| IRAC 4.5 | 4.82 | 0.15 | mJy | Spitzer |
| IRAC 5.8 | 5.51 | 0.13 | mJy | Spitzer |
| IRAC 8.0 | 5.53 | 0.14 | mJy | Spitzer |
| MIPS 24 | 16.2 | 1.7 | mJy | Spitzer |
| MIPS 70 | 4 | (3) | mJy | Spitzer |
| PACS 100 | 3 | (3) | mJy | Herschel |
| MIPS 160 | 10 | (3) | mJy | Spitzer |
| PACS 160 | 4 | (3) | mJy | Herschel |
| 4.75 GHz | 40 | mJy | Parkes | |
| 843 MHz | 13.8 | 1.3 | mJy | SUMSS |
Two dust components can be distinguished in the spectrum. First, the featureless emission component present in the SED, peaking at 4 m (see Fig. 2), is due to optically thick dust emission from the accretion disk, corresponding to a dust temperature of 1500 K. Second, the silicate emission bands at 10 and 18 m due to emission of warm silicate grains.
We construct a very simple model to derive the main traits of the observed energy distribution. The silicate emission feature is modelled using optical properties of oxygen-rich glassy silicates (Ossenkopf et al., 1992, Set 2 in their Table 2 ). We assume a single temperature and optically thin emission which makes the predicted spectrum the convolution of the absorption cross-section and the Planck function of the corresponding temperature. The resulting silicate emission is added to the optically thick continuum due to warm dust in the accretion disk, represented in this case by a constant 5.5 mJy spectrum. For a silicate temperature of 260 K – consistent with the range found for other quasars (e.g. Hao et al., 2005) – the simulated spectrum reproduces the observed strengths of the 9.7 and 18 m features.

The silicate emission is believed to arise from clouds of dust near the central regions. The temperature of the silicate grains constrains the distance at which these clouds are located. The models as presented by Schweitzer et al. (2008) shows that clouds around 510 pc away from the black hole show silicate temperatures as found in the IRS spectrum of SAGE1CJ053634. Schweitzer et al. (2008) have modelled a sample of silicate emission quasars. Their results show that the silicate feature-to-continuum ratio depends mostly on the cloud distance to the black hole and less on the solid angle covered by clouds.
We compare the observations with the CLUMPY models of Nenkova et al. (2008), which consist of an accreting black hole surrounded by a torus that contains clouds of dust. We only show the emission of the torus without the direct contribution from the AGN. The observed emission from the AGN depends on the source inclination angle for which we have no constraints. The calculated SEDs explain the full IR emission of SAGE1CJ053634 well (see Fig. 2) and we need not invoke additional host galaxy emission to understand the observed mid-IR to sub-mm SED. There is room for some emission from a population of old stars in the rest frame optical range. The narrow PAH bands can be identified more readily in the residual spectrum obtained by subtracting the best fit model from the IRS spectrum. There are a few broad structures in the residual, in particular the model over-predicts the flux levels near 8 m and under-predicts the flux levels near 20 m. These may reflect a slight mismatch in the actual temperature distribution or silicate composition compared to what is assumed in the CLUMPY model. The Ks band photometry is not well reproduced which may also indicate that the warmest dust component shines brighter than what is assumed in the model.
The Nenkova et al. (2008) model contains many free parameters, in particular those concerning the geometrical setup of the system, that are ill-constrained. However, there are a few parameters that can be determined. The main conclusions that can be drawn from the comparison with the CLUMPY models are that the optical depth through each individual cloud has to be moderate (), that the clouds have to be located within a narrow distance range around the black hole (0.15 pc) and that the mean number of clouds along any line of sight has to be limited (6). Those criteria reflect the necessity to have warm, optically thin emission at mid-IR wavelengths and little cold dust. Note that the original CLUMPY models included a mistake (Nenkova et al., 2010) which affected the relative scaling of the contributions of the direct AGN emission compared to the torus emission. Since we are comparing with the torus emission alone, our results are not affected.
Using a redshift of and the following cosmological parameters, H0=71, =0.27, we find a luminosity distance of 654 Mpc. We derive a silicate dust mass of 1 300 M⊙, for the 260 K component, assuming optically thin emission, using the optical properties from Ossenkopf et al. (1992, Set 2 in their Table 2 ). For a gas-to-dust mass ratio of 100 this warm dust translates to a gas mass of 1-2 105 M⊙. This should be considered a lower limit to the mass of the warm medium that gives rise to the silicate emission since the actual gas-to-dust mass ratio could be much higher, in particular if dust is being destroyed by the harsh radiation field originating from the accretion disk onto the black hole. However dust residing inside clouds may be effectively shielded from destruction (Elvis et al., 2002).
The shape of the SED, in particular the absence of MIPS 70, PACS 100 and 160 m detections, constrains the amount of dust with temperatures below 250 K that can be present. We find upper limits (3) of 4, 3 and 4 mJy at 70, 100 and 160 m (61, 96 and 140 m rest wavelength), respectively. These limits imply that the total amount of silicate dust with temperatures between 100 and 250 K cannot exceed 105 M⊙. The constraints set by the far-IR upper limits on the presence of cooler dust are not as stringent; we find that the maximum mass of silicate grains with temperatures between 30 and 100 K cannot exceed 4 106 M⊙.
3 Discussion
Silicate emission is diagnostic of the medium around the central accretion region of active galactic nuclei (AGN). The presence of silicate emission and the deduced grain temperatures have been interpreted either in terms of a clumpy medium in the torus around the black hole or in terms of clouds in the narrow line region (Siebenmorgen et al., 2005a). Both of these scenarios have been proposed to explain the relatively low temperature of the silicate grains derived from the IR feature ratio (300 K). These scenarios provide a way to have the silicate emission arise at a larger distance from the accreting black hole than the inner disk. Dust present at the inner wall of the accretion torus would be at much higher temperatures than is observed. The sublimation temperature of silicates is 1 000 K (e.g. Pollack et al., 1994), consistent with the hot dust 4-m peak in the observed SED of SAGE1CJ053634.
Within a sample of 200 AGN and Ultra Luminous InfraRed Galaxies, Hao et al. (2007a) find the strength of the 10 m silicate emission feature relative to the continuum to range between 1 and 1.5 for quasars. There is one outlier: PG 1351+640 with a ratio index of 2.1. SAGE1CJ053634, on the other hand, has a ratio of 3.6. Thus we conclude that SAGE1CJ053634 is an extreme case of a population of quasars with prominent silicate emission. The strong emission feature is due to optically thin emission of relatively warm silicate grains. The feature-to-continuum ratio is a function of the relative amount of silicates that contribute to the optically thin emission with respect to other components and the temperature of this material. Other components here can refer to non-silicate grains, e.g. carbonaceous grains, if present, that will give rise to a smooth continuum, material in the optically thick accretion disk, but also to cooler silicate grains, which will tend to diminish the contrast with the continuum, if they cause self-absorption at 10 m. Therefore, the exceptional strength of the 10 m emission feature may be in part the result of a lack of cooler silicate grains, which cause self-absorption in other sources.
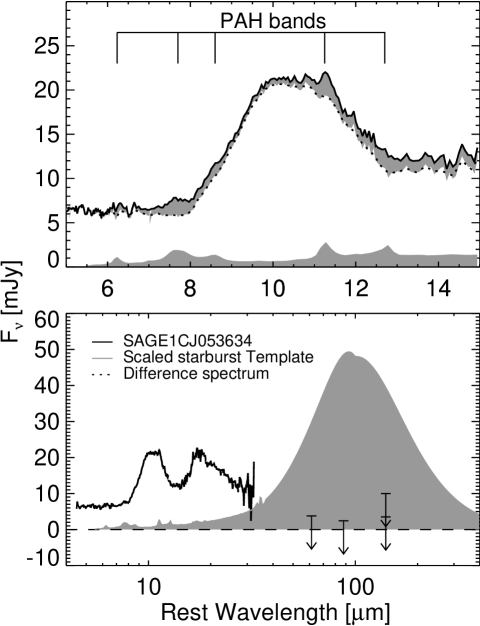
SAGE1CJ053634 also stands out in the lack of far-IR emission. The source remains undetected at 70, 100 and 160 m (see Fig. 1) and the IRS spectrum is dropping at wavelengths longer than the 18 m Si-O bending resonance. Almost all of the mid-IR spectra of quasars presented by Netzer et al. (2007) show a flat or even rising far-IR slope (in Fν, see also Fig. 3). The only noticeably exception is PG 1626+554, which is the only source in their study that does not require any cold dust component to fit the IRS spectrum. We compare the IRS spectra of SAGE1CJ053634, PG 1351+640 and PG 1626+554 in Fig. 3. This comparison shows the exceptional energy distribution of SAGE1CJ053634. The mid-IR spectrum flux level is comparable to the other sources but those at other wavelengths are much lower than the comparison sources, which are by themselves already very extreme sources. We are not aware of any observationally based SED templates (e.g. Elvis et al., 1994; Netzer et al., 2007; Assef et al., 2008) of AGN+galaxy that do not over-predict the 70, 100 and 160 m fluxes when scaled to the mid-IR of SAGE1CJ053634. In those templates the emission other than the mid-IR is dominated by contributions from the host galaxy, either in the form of stellar photospheric emission (optical) or cooler dust (far-IR).
Thus the IR emission of SAGE1CJ053634 is fully due to emission related to the accretion onto the central black hole and the associated torus. The two sources we chose for comparison (PG 1351+640 and PG 1626+554) are not typical sources but already represent the previously known extreme cases in terms of feature-to-continuum and lack of cold dust. There is a puzzling discrepancy between the Infrared Astronomy Satellite (IRAS) photometry of PG 1626+554 and its IRS spectrum. The IRAS photometry is systematically higher than would be expected based on the IRS spectrum (see Fig. 3) which could be indicative of associated IR emission which has been missed by the IRS spectroscopy.
Recently, Mullaney et al. (2011) subtracted the host-galaxy contribution from the observed 6-100 m IR SEDs of a sample of local galaxies hosting an AGN to derive the IR emission intrinsic to the AGN. When we compare the observed SED of SAGE1CJ053634 with the intrinsic SEDs presented in Mullaney et al. (2010) we find a very good agreement. This reinforces our interpretation that the IR regime of this source is dominated by AGN activity.
We conclude that SAGE1CJ053634 is a source of which the emission is dominated by contributions from the inner 10 pc. The SED puts strong limits on the host galaxy emission.
Deep optical images are instrumental in determining the nature and
presence of the host galaxy. If there is a host galaxy, it is most
likely a red elliptical galaxy, since there are no signs of star
formation. Indeed, there seems to be some extended emission in the
image of the ESO-red444from http://www-wfau.roe.ac.uk/sss plate. The source is marginally
resolved. In the corresponding catalogue4 the source is classified
as having little resemblance to a stellar source (point-source).
Comparing the full-width-at-half-max (FWHM) of the source to some
stellar sources in the same field we find that SAGE1CJ053634 is elongated
and its FWHM along the elongation is 1.4 times a typical
stellar FWHM. In Fig. 2 we show the SED template of an
elliptical galaxy (template Ell2) taken from The SWIRE Template
Library555from http://www.iasf-milano.inaf.it/polletta/
templates/swire_templates.html.
We scaled the template to avoid surpassing the observed photometry in
the near-IR, which is probably an over-estimation of the actual
contribution We conclude that the possible contribution of a host
elliptical to the total luminosity is small (30%).
3.1 The origin of the PAH bands
The presence of PAH emission bands, albeit faint, may originate from star formation in the ISM of the host. This is an assumption which is often made when decomposing the IR SED into an AGN and a star formation component.
We have investigated this possibility by comparing the observed PAH emission with the starburst galaxy templates of Mullaney et al. (2011). These templates were derived by mean averaging similar SEDs from groups of galaxies that cover the full range of IR colours of starburst and Luminous InfraRed galaxies in the local Universe. The template spectrum agrees quite well with the observed PAHs spectrum of SAGE1CJ053634 (see Fig. 4). However, the starburst template over-predicts the upper limits of the far-IR emission by more than a factor of 5. We conclude that the faint PAH emission of SAGE1CJ053634 is not linked directly to star formation.
An alternative explanation could be that the PAH features arise from the host elliptical galaxy (e.g. Kaneda et al., 2005). Several local ellipticals exhibit PAH features with exceptional band ratios, the 11.3 m band being strong compared to the other bands, which has been interpreted as these PAH features originating in a post starburst phase from matter condensed in shells around evolved carbon stars (Vega et al., 2010). This possibility is interesting since it would naturally explain the lack of far-IR emission. Is should be stressed that those local ellipticals which exhibit strong PAH features have active star formation and the corresponding strong far-IR emission.
Because the PAH features in the IRS spectrum of SAGE1CJ053634 are weak and perched on top of very strong silicate emission features, it is not possible to measure reliably the band ratios. We have further investigated the possible origins of the PAHs from a post starburst in the host red elliptical by comparing with NGC 708. This source exhibits the strong 11.3 m feature on a weak continuum (Kaneda et al., 2008). We have scaled the observed mid-IR IRS spectrum to the overall IRAS photometry. This assumes that the nuclear IRS spectrum is representative of the entire host. We have subsequently scaled the overall NGC 708 SED to not surpass the optical photometry of SAGE1CJ053634. In this way we obtain a maximum template SED of the possible host galaxy. We find that in this scaled template SED the strength of the 11.3 m band is 50 % of that observed in SAGE1CJ053634. We conclude that the PAHs we observe in SAGE1CJ053634 may have an origin in the host galaxy, without being directly linked to star formation.
4 SAGE1CJ053634 as a sub-class: IR selection criteria
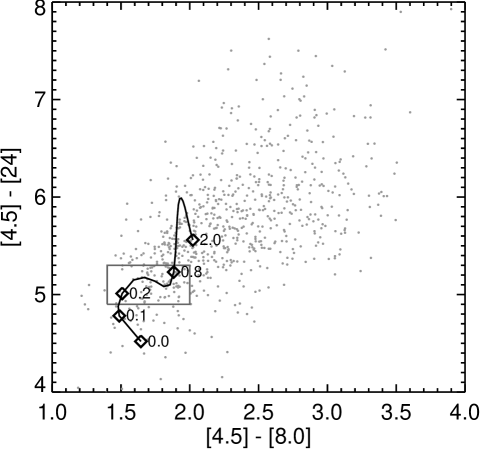
It is interesting to try to estimate how rare objects like SAGE1CJ053634 are. We use the photometric catalogue of SAGE-LMC to search for sources with similar SEDs. We focus on the sources observed off the main body of the LMC (Whitney et al., 2008). This choice is to avoid confusion with sources in the LMC, i.e. to ensure that the sources with IR excess are background galaxies. The total number of sources with [4.5]–[8.0] colour redder than stars (1) is 1 100. Of these, 735 are also detected at 24 m and are shown in Fig. 5 as grey dots. We have constructed a smooth template SED based on the existing photometry and the IRS spectrum. The smoothed version has been obtained by interpolating the photometry on a finer wavelength grid and extrapolating the SED through the 3 upper limits at far-IR wavelengths. We simulate the photometry as a function of redshift by convolving the template with the filter profiles. We show the synthetic colours in Fig. 5, where the Spitzer [4.5]–[8.0] and [4.5]–[24] colours best trace the characteristic shape of the SED. However these colours are still not very efficient in detecting the most striking features of this particular quasar, i.e. the strong silicate 10 m emission and the lack of cold dust. Taking into account also the magnitudes and the near IR colours we find 69 sources with colours similar to SAGE1CJ053634. All of these sources are located in the grey box in Fig. 5. There are no sources matching this SED at low redshifts (0.15), i.e. very bright. Beyond 0.8 this kind of source would be too faint to be detected in all of the bands in SAGE-LMC but could be detected in deep-field surveys. Many, if not most, of these sources may be more normal AGN hosting galaxies. Indeed Kozłowski & Kochanek (2009) find 5 000 candidate AGN sources behind the LMC in the SAGE-LMC catalogue. These authors use primarily the IRAC colours, which trace the hot emission from the accretion disk and SAGE1CJ053634 is included in their candidate list, albeit with somewhat atypical colours. We conclude that sources like SAGE1CJ053634 are relatively rare in the local universe (0.15) but that there is a possible population farther away. This population could be as large as 10% (69/735) of the IRAC detected sources. Taking into account the fact that mostly type I sources display the silicate band in emission and that at these redshifts there are similar numbers of type I and type II AGNs, this fraction further decreases to 5%.
The fact that sources like SAGE1CJ053634 are perhaps less rare in the distant universe than at low redshift may reflect the diminishing star formation activity trend with the age of the Universe. If SAGE1CJ053634 represents a galaxy at the end of its AGN activity when the star formation has already ceased – as indicated by its very low far-IR luminosity – then such galaxies are expected to be more common in the more distant Universe, up to redshifts approaching the typical formation epoch of massive early-type galaxies around –3. However, IR spectroscopy is essential for discriminating between this kind of extreme silicate emitters and more regular active galaxies.
We also present a diagram which may be useful to discover similar objects using the many Herschel surveys that are ongoing (Fig. 6). Since the extreme AGN activity is most prominently visible in the mid-IR, the near-IR to mid-IR colour of such sources is very red while the mid-IR to far-IR colour is extremely blue. Figure 6 clearly shows that selecting sources with a [MIPS 24]–[PACS 100] colour below 3 would be very efficient in selecting further candidate objects.
5 Conclusions

We have presented the SED and SAGE-Spec Spitzer/IRS spectrum from 537 m of SAGE1CJ053634, an IR point-source detected by Spitzer/SAGE-LMC. The spectrum shows a redshifted (=0.14) silicate emission feature with an exceptional feature-to-continuum ratio and weak PAH emission bands, which may arise from the host galaxy. We have constructed the energy distribution from the UV to radio wavelength. The energy distribution is peculiar because it lacks a clear stellar counterpart and far-IR emission. We find that the entire IR energy distribution and the IR spectrum can be understood as emission originating from the inner active region around an accreting black hole. The hot dust near the accretion disk gives rise to the optically thick continuum, which peaks at 4 m and is roughly constant in Fν for the IRS wavelength range. The strong silicate features, on the other hand, may arise from optically thin emission of dusty clouds within 10 pc around the black hole. As such SAGE1CJ053634 can serve as a template of the emission from the AGN in other galaxies. Extreme sources dominated by silicate emission such as SAGE1CJ053634 are rare in the local universe, but are perhaps more common at earlier epochs. We have presented colour-colour criteria as tools to search for candidate sources like those based on Spitzer as well as for Herschel data.
Acknowledgements.
This research has made use of NASA’s Astrophysics Data System Bibliographic Services, the VizieR catalogue access tool, CDS, Strasbourg, France, the NASA/ IPAC Infrared Science Archive, which is operated by the Jet Propulsion Laboratory, California Institute of Technology, under contract with the National Aeronautics and Space Administration and the ROSAT Data Archive of the Max-Planck-Institut für extraterrestrische Physik (MPE) at Garching, Germany. SH would like to thank N. Jetha and S. Temporin for interesting and very instructive discussions about active galaxies. The authors thank Neal Jackson and Ian Browne for careful reading of an earlier version of the manuscript.References
- Assef et al. (2008) Assef, R. J., Kochanek, C. S., Brodwin, M., et al. 2008, ApJ, 676, 286
- Blum et al. (2006) Blum, R. D., Mould, J. R., Olsen, K. A., et al. 2006, AJ, 132, 2034
- Bressan et al. (2006) Bressan, A., Panuzzo, P., Buson, L., et al. 2006, ApJ, 639, L55
- Cioni et al. (2000) Cioni, M.-R., Loup, C., Habing, H. J., et al. 2000, A&AS, 144, 235
- Elvis et al. (2002) Elvis, M., Marengo, M., & Karovska, M. 2002, ApJ, 567, L107
- Elvis et al. (1994) Elvis, M., Wilkes, B. J., McDowell, J. C., et al. 1994, ApJS, 95, 1
- Fazio et al. (2004) Fazio, G. G., Hora, J. L., Allen, L. E., et al. 2004, ApJS, 154, 10
- Filipović et al. (1995) Filipović, M. D., Haynes, R. F., White, G. L., et al. 1995, A&AS, 111, 311
- Hao et al. (2005) Hao, L., Spoon, H. W. W., Sloan, G. C., et al. 2005, ApJ, 625, L75
- Hao et al. (2007a) Hao, L., Weedman, D. W., Spoon, H. W. W., et al. 2007a, ApJ, 655, L77
- Hao et al. (2007b) Hao, L., Weedman, D. W., Spoon, H. W. W., et al. 2007b, in Astronomical Society of the Pacific Conference Series, Vol. 373, The Central Engine of Active Galactic Nuclei, ed. L. C. Ho & J.-W. Wang, 574
- Houck et al. (2004) Houck, J. R., Roellig, T. L., van Cleve, J., et al. 2004, ApJS, 154, 18
- Jiang et al. (2007) Jiang, L., Fan, X., Ivezić, Ž., et al. 2007, ApJ, 656, 680
- Kaneda et al. (2005) Kaneda, H., Onaka, T., & Sakon, I. 2005, ApJ, 632, L83
- Kaneda et al. (2008) Kaneda, H., Onaka, T., Sakon, I., et al. 2008, ApJ, 684, 270
- Kemper et al. (2010) Kemper, F., Woods, P. M., Antoniou, V., et al. 2010, PASP, 122, 683
- Kozłowski & Kochanek (2009) Kozłowski, S. & Kochanek, C. S. 2009, ApJ, 701, 508
- Lasker et al. (2008) Lasker, B. M., Lattanzi, M. G., McLean, B. J., et al. 2008, AJ, 136, 735
- Martin et al. (2005) Martin, D. C., Fanson, J., Schiminovich, D., et al. 2005, ApJ, 619, L1
- Mauch et al. (2003) Mauch, T., Murphy, T., Buttery, H. J., et al. 2003, MNRAS, 342, 1117
- Meixner et al. (2010) Meixner, M., Galliano, F., Hony, S., et al. 2010, A&A, 518, L71
- Meixner et al. (2006) Meixner, M., Gordon, K. D., Indebetouw, R., et al. 2006, AJ, 132, 2268
- Mullaney et al. (2011) Mullaney, J. R., Alexander, D. M., Goulding, A. D., & Hickox, R. C. 2011, ArXiv e-prints
- Mullaney et al. (2010) Mullaney, J. R., Alexander, D. M., Huynh, M., Goulding, A. D., & Frayer, D. 2010, MNRAS, 401, 995
- Nenkova et al. (2008) Nenkova, M., Sirocky, M. M., Nikutta, R., Ivezić, Ž., & Elitzur, M. 2008, ApJ, 685, 160
- Nenkova et al. (2010) Nenkova, M., Sirocky, M. M., Nikutta, R., Ivezić, Ž., & Elitzur, M. 2010, ApJ, 723, 1827
- Netzer et al. (2007) Netzer, H., Lutz, D., Schweitzer, M., et al. 2007, ApJ, 666, 806
- Ossenkopf et al. (1992) Ossenkopf, V., Henning, T., & Mathis, J. S. 1992, A&A, 261, 567
- Pollack et al. (1994) Pollack, J. B., Hollenbach, D., Beckwith, S., et al. 1994, ApJ, 421, 615
- Rieke et al. (2004) Rieke, G. H., Young, E. T., Engelbracht, C. W., et al. 2004, ApJS, 154, 25
- Sanders et al. (2003) Sanders, D. B., Mazzarella, J. M., Kim, D., Surace, J. A., & Soifer, B. T. 2003, AJ, 126, 1607
- Schweitzer et al. (2008) Schweitzer, M., Groves, B., Netzer, H., et al. 2008, ApJ, 679, 101
- Shi et al. (2006) Shi, Y., Rieke, G. H., Hines, D. C., et al. 2006, ApJ, 653, 127
- Siebenmorgen & Efstathiou (2005) Siebenmorgen, R. & Efstathiou, A. 2005, in American Institute of Physics Conference Series, Vol. 761, The Spectral Energy Distributions of Gas-Rich Galaxies: Confronting Models with Data, ed. C. C. Popescu & R. J. Tuffs, 245
- Siebenmorgen et al. (2005a) Siebenmorgen, R., Haas, M., Kruegel, E., & Schulz, B. 2005a, Astronomische Nachrichten, 326, 556
- Siebenmorgen et al. (2005b) Siebenmorgen, R., Haas, M., Krügel, E., & Schulz, B. 2005b, A&A, 436, L5
- Skrutskie et al. (2006) Skrutskie, M. F., Cutri, R. M., Stiening, R., et al. 2006, AJ, 131, 1163
- Stern et al. (2005) Stern, D., Eisenhardt, P., Gorjian, V., et al. 2005, ApJ, 631, 163
- Vega et al. (2010) Vega, O., Bressan, A., Panuzzo, P., et al. 2010, ApJ, 721, 1090
- Voges et al. (1999) Voges, W., Aschenbach, B., Boller, T., et al. 1999, A&A, 349, 389
- Werner et al. (2004) Werner, M. W., Roellig, T. L., Low, F. J., et al. 2004, ApJS, 154, 1
- Whitney et al. (2008) Whitney, B. A., Sewiło, M., Indebetouw, R., et al. 2008, AJ, 136, 18