Flaring Patterns in Blazars
Abstract
Blazars radiate from relativistic jets launched by a supermassive black hole along our line of sight; the subclass of FSRQs exhibits broad emission lines, a telltale sign of a gas-rich environment and high accretion rate, contrary to the other subclass of the BL Lacertae objects. We show that this dichotomy of the sources in physical properties is enhanced in their flaring activity. The BL Lac flares yielded spectral evidence of being driven by further acceleration of highly relativistic electrons in the jet. Here we discuss spectral fits of multi- data concerning strong flares of the two flat spectrum radio quasars 3C 454.3 and 3C 279 recently detected in rays by the AGILE and Fermi satellites. We find that optimal spectral fits are provided by external Compton radiation enhanced by increasing production of thermal seed photons by growing accretion. We find such flares to trace patterns on the jet power - electron energy plane that diverge from those followed by flaring BL Lacs, and discuss why these occur.
Subject headings:
galaxies: active — radiation mechanisms: non-thermal — galaxies: BL Lacertae object — quasars: general — quasars: individual (3C 454.3, 3C 279)1. Introduction
Blazars radiate from narrow, relativistic jets that blaze on us when closely aligned with our line of sight. The jets are launched by a central supermassive black hole (SMBH, masses ) with bulk Lorentz factors up to several tens, and yield beamed non-thermal radiations with observed fluxes and frequencies enhanced by aberration and Doppler effects of Special Relativity (Begelman et al., 1984; Königl, 1986; Urry & Padovani, 1995).
The subclass of the BL Lac objects show few signs of radiation from an accretion disk, and weak or intermittent if any emission lines; such conditions indicate little surrounding gas, and low current accretion rates on the order of in Eddington units (e.g., Ghisellini et al., 2009). Their spectra are well represented as a smooth spectral energy distribution (SED) , featuring two peaks: one in the range of radio - soft X-ray frequencies, due to synchrotron emission by highly relativistic electrons inside the jet; and another at hard X-ray or -ray energies, due to inverse Compton upscattering by the same electrons of the seed photons provided by the synchrotron emission itself (synchrotron self-Compton radiation, SSC; Jones et al. 1974; Marscher & Gear 1985; Maraschi et al. 1992).
The other blazar subclass is constituted by the Flat Spectrum Radio Quasars (FSRQs); besides the non-thermal peaks, they also feature the strong broad emission lines and high Big Blue Bump typical of quasars (e.g., Peterson, 1997), which yield evidence of plenty surrounding gas associated to high current accretion rates with . Such an accretion provides seed photons from outside the jets, that drive an additional contribution to the non-thermal radiations by the external Compton scattering (EC; see Dermer & Schlickeiser, 1993; Sikora et al., 1994). These EC contributions often dominate the -ray outputs of FSRQs (Maraschi et al., 2001).
Both source types exhibit intermittent episodes of major brightening on timescales of days or even shorter, with substantial flux surges (“flares”) particularly at -ray energies, as recently observed for 3C 454.3 by AGILE-GRID (Pacciani et al., 2010) and for 3C 279 by Fermi-LAT (Abdo et al., 2010).
Here we examine how the flares of the two subclasses differ, and relate their differences to specific physical processes in the sources. Flares in BL Lacs have already been studied in Paggi et al. (2009a) and related to current acceleration of the emitting electrons; so in this paper we focus on flaring activity of FSRQs.
2. Radiation: FSRQs versus BL Lacs
The SEDs of all blazars include a basic SSC process. The synchrotron component is produced since the jets contain a magnetic field , highly relativistic electrons with random Lorentz factors up to , in addition to non-relativistic protons with a common density within a comoving size ; all flow toward the observer with bulk Lorentz factors (see Böttcher 2007; also Celotti & Ghisellini 2008). Interacting with seed photons emitted inside or outside the jet, the same electrons also radiate by inverse Compton in the SSC or EC process, respectively.
2.1. Spectra from SSC
We will mainly adopt for the electron energy distributions curved, log-parabolic shapes; adding to their value as fitting tools for the associated spectral energy distributions, they are theoretically based as discussed in detail in Sect. 4.
In fact, our electron distributions will have the form
| (1) |
Here is the electron injection Lorentz factor and is a constant contribution to the slope. On a log-log plot, such distributions appear as parabolic humps with curvature (Massaro et al., 2004); the parameters may vary during flares. The energetic content of such an electron population is best expressed in terms of the rms adimensional energy ; this turns out to also provide the peak position for the function , that will enable us to compare BL Lacs and FSRQs energetics on a similar footing.
On the other hand, the SSC spectra radiated by such distributions are themselves curved (Massaro et al., 2004; Tramacere et al., 2007, and references therein), and their SEDs are effectively represented by the log-parabolic shapes
| (2) |
Here the spectral curvature is marked by , and the peak frequency and flux ; the two SED peaks closely yield the total flux in each component. For the synchrotron component one has a peak frequency , a peak flux , and the spectral curvature . For the IC component one has a peak frequency , a peak flux and the spectral curvature , in the Thomson regime.
2.2. Spectra from EC
In the FSRQs in particular, the higher energy component usually features substantially larger fluxes with respect to the synchrotron component, at variance with the yield of the SSC process in conditions of photon energy density not exceeding the magnetic one.. This is often interpreted in terms of an additional EC component originated from seed photons emitted outside the jet, specifically by the broad line region (BLR) or by the inner accretion disk (Dermer et al., 1992; Sikora et al., 1994; Böttcher & Dermer, 2002).
The disk emission is widely modeled as a sum of annular concentric surfaces radiating locally as a black body; their temperatures follow along the radius the profile (see Frank et al., 2002),
| (3) |
where , is the accretion rate and is the radius of the last stable orbit. The integrated emission has a peak flux at a peak frequency . The BLR instead comprises a number of “clouds” intercepting some of the radiation from the disk at distances , with ionization parameter values (see Peterson, 1997).
These narrow spectra of external photons interact with the electrons in the jet to yield EC radiation, with a SED again following shapes as represented by Eq. 2. For the photons coming from the disk to reach the emitting region at a height scale , the EC radiation has a peak flux , a peak frequency , and the spectral curvature close to the electron distribution curvature. For photons coming from the BLR we have a peak flux , a peak frequency , while the spectral curvature is again .
We recall that the observed frequencies are enhanced by the beaming factor , while the fluxes are boosted by , with for small viewing angles (Begelman et al., 1984). As mentioned above, the EC flux is further multiplied by factors depending on the scattering geometry for the disk and the BLR photons, respectively (Dermer & Schlickeiser, 2002; Ghisellini & Tavecchio, 2009).
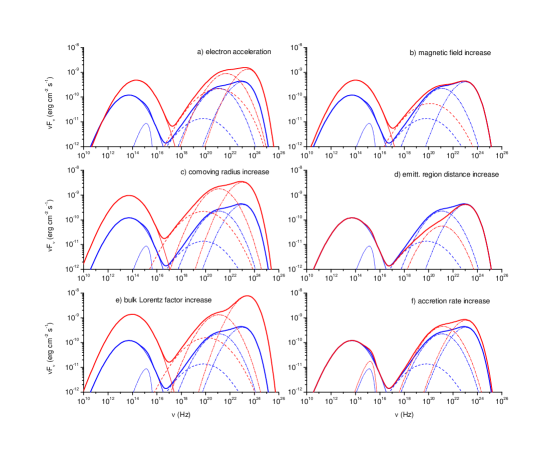
Examples of these emissions and contributions to the SEDs are numerically computed and illustrated in Fig. 1, for both the low and high states of a typical FSRQ with , , , , and , and . These will be used in Sect. 3.1 as a guide to focus the main flare drivers, preliminary to our detailed fits in Fig. 2.
3. Flares of 3C 454.3 and 3C 279
The dominant process driving the blazar flares can be tested from the observed spectral changes compared with the templates provided by Fig. 1.
3.1. Spectral variations
In several flaring BL Lacs the SEDs have been observed to increase both their peak heights and positions (see Paggi et al., 2009a); in particular, the synchrotron peak considerably shifting up in frequency constitutes clear evidence of electron acceleration.
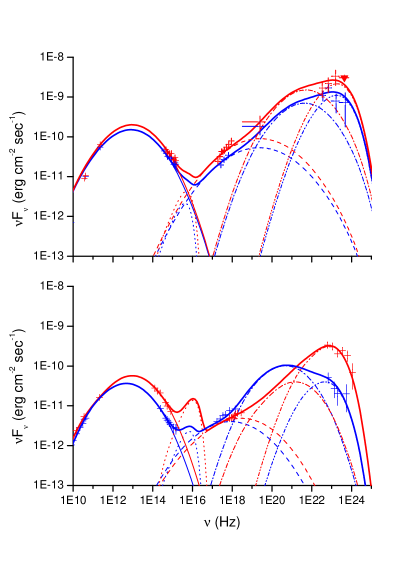
On the other hand, in several FSRQs the dominant and growing second spectral peak, along with the nearly stable synchrotron frequency, favor the EC process driven by increasing seed photon flux. This is shown in Fig. 1-f, in comparison with the alternatives presented in Fig. 1-a, b, c, d, e. Correspondingly, our fits to the specific SEDs of 3C 454.3 and 3C 279 are presented in Fig. 2, with model parameters given in Table 1. Notice the larger particle densities found in FSRQs than in BL Lacs (Paggi et al., 2009b), consistent with different matter contents in the surroundings of the two source kinds.
We stress that for both sources the fits require considerably larger values of in the flares, with limited variations of the other parameters; for 3C 279, however, the low X rays in the high state imply also a larger distance of the emitting region. Source transparency to pair production process via - interaction is assured by the optical depths and for GeV, in the high state of 3C 454.3 and 3C 279, respectively.
So the large flares of the FSRQs 3C 454.3 and 3C 279 appear to be dominated by thermal seed photons increasing their fluxes much more than the frequencies, as expected from the increasing accretion rates discussed in Sect. 2.1. To wit, the EC flux grows strongly in rays while in the IR-optical bands little or no increase occurs for the synchrotron peak frequency (see Fig 2).
On the other hand, the modest rise of the observed X-ray fluxes during flares constrains any increase of ; so increasing seed photons apparently dominate the -ray surges.
3.2. Jet Power
To further probe the physical processes driving a flare, an important quantity is provided by the overall energetics. The total jet power is comprised of the radiative component , and of the kinetic powers in electrons and protons , with a subdominant magnetic component (Celotti & Ghisellini, 2008; Paggi et al., 2009b).
Here is the flux observed at the luminosity distance111In the following, we adopt the standard flat cosmology with and (see Dunkley et al., 2009). , and and are the electron and proton masses. One “cold” proton per electron is assumed, so for the FSRQs with average electron energies the proton component to the energetics is considerable and hardly variable; this steadily feeds the energetics of the radio lobes (Celotti et al., 2001).
3.3. Flare evolutions
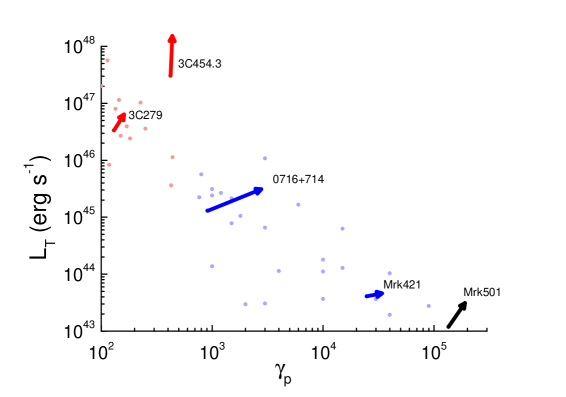
Our main aim here is constituted by flares of bright blazars; their historical conditions are effectively represented in the - plane (see Fig.3), where they appear to be strung on average along a “bright blazar strip” (see Cavaliere & D’Elia, 2002; Böttcher & Dermer, 2002; Ghisellini et al., 2002). The BL Lac sources reside in the right-hand region, around the line where the crossing time matches the radiative cooling time related to the energy density in the magnetic or radiation field, to yield . On the other hand, the FSRQs lie in the left-hand region, around the line where the cooling time is matched by the acceleration time related to the effective electric field (see Cavaliere & D’Elia 2002, Ghisellini et al. 2009), to yield . The lower/left corner of the plane is populated by weaker sources out of our present scope (see Padovani et al., 2003).
We see from Fig. 3 that on this plane major flares in our database move in directions different from the slope of the bright blazar strip, into regions where the sources have higher luminosities and total powers and faster cooling. In particular, the FSRQs move vertically, whereas luminous BL Lacs (e.g., S50716+714 and Mrk421) move in a substantially slanted direction (Paggi et al., 2009b). We interpret these patterns in terms of source structure changing as follows.
The flares of gas-poor BL Lacs are mainly driven by increasing causing stronger synchrotron radiation. Cooling is faster, but still can be balanced by shorter crossing times through a smaller source size (like is the case for jets with inner structure, see Tavecchio & Ghisellini 2008, Giannios et al. 2009), to yield and in terms of the electron number . Eventually, the source power may exceed the yield from the feeble current accretion; so it has to live on the alternative reservoir constituted by the the rotational energy of the SMBH, that was accumulated during previous massive accretion episodes, and is now tapped via the General Relativistic mechanism proposed by Blanford & Znajek in 1977. This implies ; weaker and more massive sources like Mrk501 are not affected by such a constraint (see also discussion by Paggi et al., 2009b).
On the other hand, the flares of the luminous FSRQs are not so constrained in view of their high current accretion; the sources increase their luminosity , and in entering the fast cooling region are assisted by acceleration from increasing with luminosity to yield (see Cavaliere & Morrison, 1980). Note that holds after the discussion in Sect. 3.2, implying on the - plane relatively short excursions even during substantial radiative flares; we have extended the relative arrows in Fig. 3 to highlight their directions, the relevant information in the present context.
Thus in our synoptic view of Fig. 3 a relation is apparent between the source location and the flaring patterns of blazars on the - plane.
4. Discussion and conclusions
Before concluding, we discuss why such a relation is not biased by our choice of log-parabolic shapes for the electron energy distributions and related SEDs given in Eqs. 1 and 2. We note that cooling (particularly in conditions of bright EC radiation) will erode them at high energies from their basic shapes. Actually, numerical simulations including synchrotron-type cooling have shown that these distributions retain an approximately log-parabolic shape around their peaks, with somewhat sharpened curvatures (Massaro et al., 2006, in particular their Fig. 4).
| Source | ||||||||||
|---|---|---|---|---|---|---|---|---|---|---|
| 3C 454.3 (low state) | ||||||||||
| 3C 454.3 (high state) | ||||||||||
| 3C 279 (low state) | ||||||||||
| 3C 279 (high state) |
The view is widened on using a Fokker-Planck equation that includes accelerations and slow cooling of an initial mono-energetic electron injection, as first proposed by Kardashev (1962) and recently computed in detail by Paggi et al. (2009a, and the refs. therein). Analytical solutions obtain in the form of a power series in the ratio of the acceleration to the cooling time defined in Sect. 3.3. The latter reads in cgs units; on using the values of obtained from our fits, this is found to be small out to for realistic values of the effective accelerating fields , in terms of the natural scale . Then the zeroth order solution is the log-parabola, while the first order correction steepens the energy distribution at the high end , mimicking a somewhat sharpened curvature that affects the SEDs at frequencies well beyond their peaks.
All that said, it is to be stressed that out to photon energies exceeding GeV emitted by electrons with , broken power laws for the energy distribution (as adopted, e.g., by Donnarumma et al. 2009, Vittorini et al. 2009) yield closely similar shapes for the SEDs around their peaks; even less sensitive is the hump of also given by the integral in Sect. 2.1 that contributes the most to the energetics. We conclude that the different flare spectra observed in the two blazar subclasses: BL Lacs and FSRQs, intrinsically relate to their different physical properties during pre-flare conditions, i.e., to dearth or plenty of gas surrounding the central SMBH.
In fact, we have studied in Sect. 3 how this physical dichotomy is reflected in the flaring activity. We find that during the flares the BL Lac and the FSRQ follow different patterns, indeed diverging ones on the - plane.
We focused on the pattern derived from recent multi- observations of the two FSRQs, 3C 279 and 3C 454.3. We find these flares to run closely vertical on the - plane to be driven mainly by an increasing flux of the external photons, under further growth of the already substantial accretion rates. Meanwhile the electron energies hardly increase, being constrained by the shortening cooling times in the denser radiative field.
These sources add to three BL Lacs that we previously studied (S50716+714, Mrk421 and Mrk501) and complete our picture. We interpret their flares in terms of increasing under further acceleration, to yield patterns slanted toward the axis; an effect reinforced by saturation of the power due to the limited output extractable from a rotating SMBH via the Blanford-Znajek mechanism (Vittorini et al., 2009; Paggi et al., 2009b).
So we propose the following pattern for the blazar flares analyzed here: flaring spectral changes relate to the pre-flare positions of BL Lacs and FSRQs on the - plane, specifically, to their respective branch of the bright blazar strip; this is because the constraints that set such positions are retained or reinforced during the flares. To wit: bright sources lying in the upper branch of the strip flare up almost vertically as expected from the cooling constraint to , while sources in the lower right branch move almost horizontally when luminous, as expected from the BZ constraint to output given their BH masses .
Such a picture may be tested on more sources with Fermi and multi-wavelength data; in particular, it will be fruitful to study any interlopers between gas-rich powerful FSRQs and gas-poor BL Lacs (that is, lower-luminosity FSRQs and the LBLs, low-peaked BL Lacs) during their flares on the - plane in search of any divide or smooth rotation between these patterns. This may be the case for the BL Lac sources PKS 0537-441, AO 0235+164 and PKS 0426-380; with their weak broad lines and with (see Ghisellini et al., 2009) they may constitute transitional objects between FSRQs and BL Lacs. Further investigation of such objects will help understanding their nature and their stance in the above picture.
References
- Abdo et al. (2010) Abdo, A., A., Ackermann, M., Ajello, M., et al. 2010, Nat, 463, 919
- Böttcher & Dermer (2002) Böttcher, M. & Dermer, C., D. 2007, 2002, ApJ, 564, 86
- Böttcher (2007) Böttcher, M. 2007, Ap&SS, 309, 95
- Begelman et al. (1984) Begelman, M., C., Blandford, R., D. & Rees, M., J. 1984, RvMP, 56, 255
- Blandford & Znajek (1977) Blandford, R., D., & Znajek, R., L. 1977, MNRAS, 179, 433
- Cavaliere & Morrison (1980) Cavaliere, A., & Morrison, P. 1980, ApJ, 238, 63
- Cavaliere & D’Elia (2002) Cavaliere, A., & D’Elia, V. 2002, ApJ, 571, 226
- Celotti et al. (2001) Celotti, A., Ghisellini, G. & Chiaberge, M. 2001, MNRAS, 321, 1
- Celotti & Ghisellini (2008) Celotti, A. & Ghisellini, G. 2008, MNRAS, 385, 283
- Dermer et al. (1992) Dermer, C., D., Schlickeiser, R. & Mastichiadis, A. 1992, A&A, 256, L27
- Dermer & Schlickeiser (1993) Dermer, C., D. & Schlickeiser, R. 1993, ApJ, 416, 458
- Dermer & Schlickeiser (2002) Dermer, C., D. & Schlickeiser, R. 2002, ApJ, 575, 667
- Donnarumma et al. (2009) Donnarumma, I., Pucella, G., Vittorini, V., et al. 2009, ApJ, 691, L13
- Dunkley et al. (2009) Dunkley, J., Komatsu, E., Nolta, M., R., et al. 2009, ApJS, 180, 306
- Frank et al. (2002) Frank, J., King A., & Raine D. 2002, Accretion Power in Astrophysics, Cambridge, Cambridge University Press
- Ghisellini et al. (2002) Ghisellini, G., Celotti, A., & Costamante, L. 2002, A&A, 386, 833
- Ghisellini et al. (2009) Ghisellini, G., Maraschi, L., Tavecchio, F. 2009, MNRAS, 396L, 105
- Ghisellini & Tavecchio (2009) Ghisellini, G. & Tavecchio, F. 2009, MNRAS, 397, 985
- Giannios et al. (2009) Giannios, D., Uzdensky, D., A., & Begelman, M., C. 2009, MNRAS, 395, 29
- González-Nuevo et al. (2010) González-Nuevo, J., De Zotti, G., Andreani, P., et al. 2010, A&A, 518, L38
- Jones et al. (1974) Jones, T., W., O’Dell, S., L., & Stein, W., A. 1974, ApJ, 188, 353
- Kardashev (1962) Kardashev, N., S. 1962, SvA, 6, 317
- Königl (1986) Königl, A. 1986, NYASA, 470, 88
- Landau et al. (1986) Landau, R., Golisch, B., Jones, T., et al. 1986, ApJ, 308, 78
- Maraschi et al. (1992) Maraschi, L., Ghisellini, G., & Celotti, A. 1992, ApJ, 397, L5
- Maraschi et al. (2001) Maraschi, L., & Tavecchio, F. 2001, ASPC, 227, 40M
- Marscher & Gear (1985) Marscher, A., P., & Gear, W. K. 1985, ApJ, 298, 114
- Massaro et al. (2004) Massaro, E., Perri, M., Giommi, P., et al. 2004, A&A, 413, 489
- Massaro et al. (2006) Massaro, E., Tramacere, A., Perri, M., et al. 2006, A&A, 448, 861
- Massaro et al. (2008) Massaro, F., Tramacere, A., Cavaliere, A., et al. 2008, A&A, 478, 395
- Pacciani et al. (2010) Pacciani, L., Vittorini, V., Tavani, M., et al. 2010, ApJ, 716, 170
- Paggi et al. (2009a) Paggi, A., Massaro, F., Vittorini, V., et al. 2009a, A&A, 504, 821
- Paggi et al. (2009b) Paggi, A., Cavaliere, A., Vittorini, V., et al. 2009b, A&A, 508L, 31
- Padovani et al. (2003) Padovani, P., Perlman, E., S., Landt, H., et al. 2003, ApJ, 588, 128
- Peterson (1997) Peterson, B., M. 1997, An Introduction to Active Galactic Nuclei, Cambridge, Cambridge University Press
- Sikora et al. (1994) Sikora, M., Begelman, M., C., & Rees, M. J. 1994, ApJ, 421, 123
- Tramacere et al. (2007) Tramacere, A., Massaro, F., & Cavaliere, A. 2007, A&A, 466, 521
- Tavecchio & Ghisellini (2008) Tavecchio, F., & Ghisellini, G. 2008, MNRAS, 385, 98
- Urry & Padovani (1995) Urry, C., M., Padovani, P. 1995, PASP, 107, 803
- Vittorini et al. (2009) Vittorini, V., Tavani, M., Paggi, A., et al. 2009, ApJ, 706, 1433