This line only printed with reprint option
Influence of B - site Disorder in (B = Fe, Ru, Al and Ga) Manganites
Abstract
We have investigated the influence of B - site doping on the crystal and magnetic structure in (B = Fe, Ru, Al and Ga) compounds using neutron diffraction, small angle neutron scattering, magnetization and resistivity techniques. The B - site doped samples are isostructural and possess an orthorhombic structure in Pnma space group at 300K. A structural transition from orthorhombic to monoclinic is found to precede the magnetic transition to CE - type antiferromagnetic state in few of these samples. On doping with Fe, charge and orbitally ordered CE - type antiferromagnetic state is suppressed, followed by the growth in ferromagnetic insulating phase in compounds. At higher Fe doping in , the ferromagnetic state is also suppressed and no evidence of long range magnetic ordering is observed. In Ru doped samples , the ferromagnetic metallic state is favored at and and no significant change in and as a function of Ru doping is found. In contrast, with non magnetic Al substitution for , the charge ordered CE - type antiferromagnetic state coexists with the ferromagnetic metallic phase. With further increase in Al doping , both CE - type antiferromagnetic and ferromagnetic phases are gradually suppressed. This behavior is accompanied by the evolution of A - type antiferromagnetic insulating state. Eventually, at higher Al doping , this phase is also suppressed and signature of spin glass like transition are evident in M(T). Likewise, substitution with Ga is observed to induce similar effects as described for Al doped samples. The presence of short ranged ferromagnetic ordering has been further explored using small angle neutron scattering measurements in few of the selected samples.
1 Introduction
Perovskite manganites (R: trivalent rare earth ion and A: divalent alkaline earth ions, Ca, Ba and Sr) have been widely studied due to the presence of variety of phenomena, viz. colossal magnetoresistance, charge, orbital, and spin ordering and phase separation behavior. In particular, the nature of charge, orbital and spin ordering is strongly influenced by various perturbations such as, disorder effects at the rare earth (A - site) and transition metal (B - site) site, hydrostatic pressure, magnetic and electric field, and by varying the particle size [1, 2, 3, 4, 5].
Several experimental and theoretical studies have been devoted toward the investigations of substitutional disorder effects in charge ordered manganites. Generally, two sources of substitutional disorder have been described in charge ordered manganites: A - site and B - site disorder. The magnetic and transport properties in several systems are observed to be systematically influenced by structural distortions and lattice disorder associated with the average A - site ionic radii and variance due to size mismatch between the A - site cations [6, 7, 9, 8, 10]. The B - site substitution, as against A - site, induces disorder directly in the Mn - O network, leading to much stronger impact on the magnetic and transport properties. The high sensitivity of charge and orbitally ordered antiferromagnetic state to B - site disorder has been studied in several half doped manganites [5, 11, 12, 13]. These studies show that a few percent of Mn - site doping brings about drastic changes in magnetic and transport properties, without significantly influencing the crystal structure. The B - site dopants such as Cr, Ru, Ni, or Co in low bandwidth (R = Nd, Pr, and Sm) manganites are able to suppress the robust charge ordered state and effectively induce ferromagnetic tendencies [14, 15, 16, 17, 18, 19, 20, 21, 22, 23, 24, 25, 26, 27, 28, 29, 30, 31]. Among these, Ru doping is found to rapidly suppress the antiferromagnetic phase and stabilize the long range ordered ferromagnetic metallic phase. Hebert et al. [14] have shown that the elements with or configuration and those without orbitals does not induce ferromagnetism, whereas those with electrons cause suppression of antiferromagnetic phase at the expense of ferromagnetic state. However, ions despite having electronic configuration is shown to belong to the former category, displaying no evidence of ferromagnetic state in sample. In contrast, the magnetization and transport studies on intermediate bandwidth compounds show the favoring of ferromagnetic phase for x < 0.05, while for higher Fe doping the ferromagnetic transition temperature decreases, leading the system towards spin glass like state [32, 33, 34, 35]. Recent investigations show that the systems with non magnetic dopants ( or ) such as in , (M = Al and Ga) [36, 37, 38, 39], and , may also favor ferromagnetic tendencies [40]. Contrastively, in Ga substituted system, the gradual emergence of charge ordered phase at the expense of ferromagnetic phase is observed [41]. In [38] and [39] series, the contrasting magnetic behavior with Al and Ga doping is ascribed to preferential substitution of with and with ions due to their similar ionic radii. Most of these studies carried out using magnetization and transport techniques highlight the transition from charge ordered insulating to ferromagnetic metallic state. The phase separation behavior as a result of low doping, which has been addressed in some of the theoretical studies is not clear from these studies.
The neutron diffraction studies in [42] and [27] samples have shown the absence of ferromagnetic state on non magnetic doping of Al ions. Recently, studies on Co and Ti substituted samples indicate the importance of strain due to the coexistence of two disimilarly distorted phases, below the charge ordering temperature [23, 43, 44, 45]. These two phases present different level of distortions and strains; the fraction of magnetic phase with large distortion reduces while one with smaller distortion increases. Neutron diffraction study in compound reveals the suppression of orthorhombic to charge and orbitally ordered monoclinic structural transition upon doping with Cr or Ni and favors ferromagnetic phase [46].
The role of B - site substitution on the charge and spin structure in half doped manganites have also been theoretically investigated [47, 48, 49, 50]. The phase separation behavior observed in these B - site doped compounds has been attributed to density or defect together with density driven. These studies also show that the non - magnetic dopants too favor the stabilization of ferromagnetic state. This behavior is ascribed to lattice defects and carrier density. The destabilization of charge and orbitally ordered CE - type antiferromagnetic state is followed by the evolution of ferromagnetic metallic, ferromagnetic clusters with or without the C - type antiferromagnetic or a spin glass like phases. Though the previously reported studies have established the destabilization of charge and orbitally ordered state by non magnetic and magnetic dopants, very few neutron diffraction studies exist, which reproduces the theoretically postulated magnetic structures.
In the present work, we have investigated the influence of B - site disorder on crystal and magnetic structure in system primarily using neutron diffraction and small angle neutron scattering techniques. The compound undergoes successive ferromagnetic metallic transition at and CE - type antiferromagnetic insulating transition at [51, 52]. We have studied the polycrystalline (B = Fe, Ru, Al, and Ga) compounds. The choice of dopants is due to the contrasting magnetic ground states these are expected to induce. The destabilization of charge and orbitally ordered antiferromagnetic state against B - site disorder is observed. Depending on dopants, these are found to induce long range ordered ferromagnetic metallic or insulating state, short range ordered ferromagnetic phase with or without coexisting antiferromagnetic phases. In compounds with magnetic doping of Fe and Ru, no signature of magnetic phase coexistence behavior is found. Interestingly, we have found that non-magnetic substitution (Al or Ga) in compound leads to a coexistence of CE - type state and ferromagnetic ordering for and favor A - type antiferromagnetic structure in samples. For higher Al and Ga concentration the system evolves into a magnetically disordered state. This behavior is as against the magnetic dopants where the evolution of A-type antiferromagnetic phase is not found. In this study, we also do not observe C - type antiferromagnetic structure following the melting of CE - type state shown in the theoretically proposed phase diagram [47].
2 Experimental method
The polycrystalline samples were synthesized by conventional solid-state reaction method. The starting materials , , , , , , and were mixed in proper stoichiometric ratio and fired at 1250 for 48 hrs. Samples were then repeatedly ground and heat treated at 1400 for 48 hrs. Finally, samples were pelletized and sintered at 1450 for 48 hrs. Initial values of cell parameters and phase identification of all the samples at 300K were obtained from X-ray powder diffraction pattern recorded on a Rigaku diffractometer, rotating anode type using Cu K radiation. Neutron diffraction patterns were recorded on a multi PSD based powder diffractometer ( = 1.249 and 1.2443Å) at Dhruva reactor, Bhabha Atomic Research Centre, Mumbai, at selected temperatures between 5 and 300K, in the angular range. The powdered samples were packed in a cylindrical Vanadium container and attached to the cold finger of a closed cycle Helium refrigerator. Rietveld refinement of the diffraction patterns were performed using FULLPROF program [53]. The magnetization measurements were carried out using SQUID (Quantum design, USA) / or VSM magnetometer (oxford instruments). Standard four point probe technique was used to measure the dc resistivity between 3 and 300K. Small angle neutron scattering (SANS) measurements and as a function of temperature between 15 and 300K in the Q range were carried out on the SANS - II instrument at the Swiss Spallation Neutron Source, Paul Scherrer Institute, Switzerland [54].
3 Results and discussion
3.1 Crystal Structure
All the B - site doped compounds studied here in the series (B = Fe , Ru , Al , and Ga ) are isostructural, possessing orthorhombic structure (space group Pnma) at 300K. These compounds crystallize in orthorhombic symmetry characterized by [55, 56]. The refinement of x - ray diffraction patterns at 300K reveal that volume as a function of doping (x) with B = Fe, Ru, Al, and Ga do not change appreciably and show any systematic behavior. This could be due to small concentration of dopants and very small difference in the value of ionic radii between Mn ions and the dopants [57].
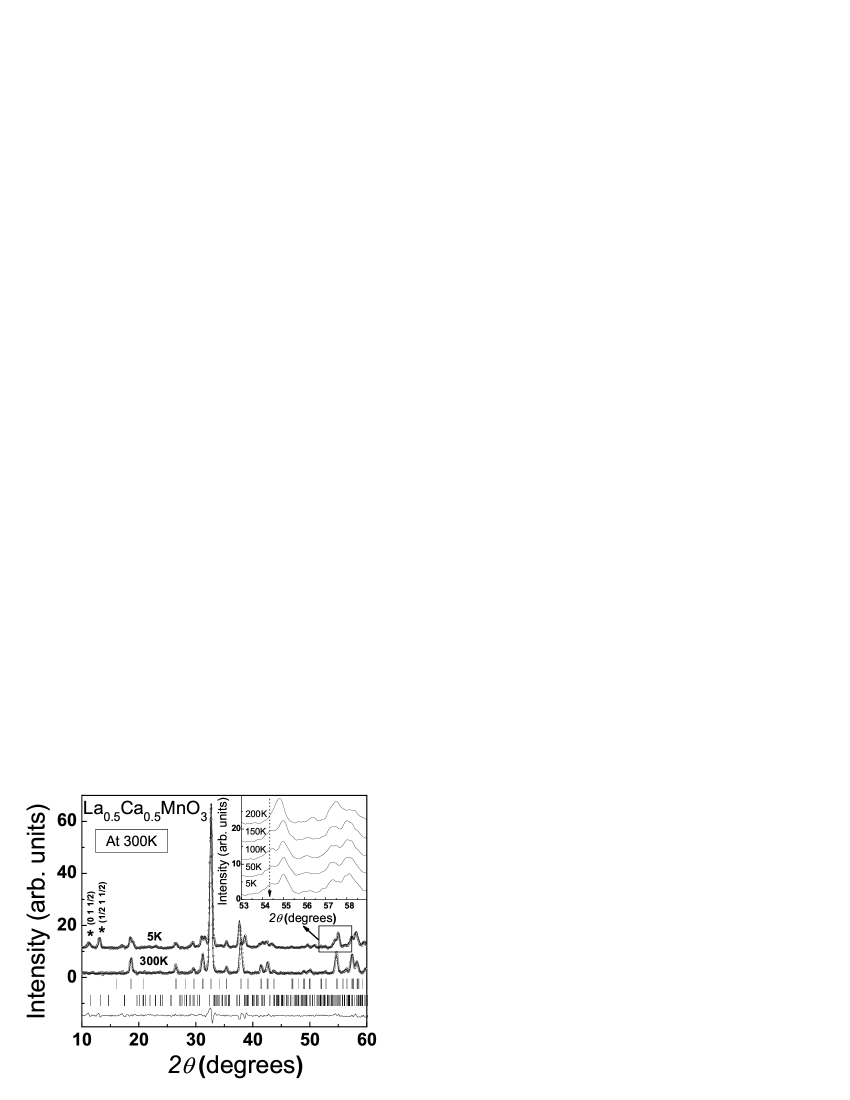
Figure 1 shows the neutron diffraction pattern of (x = 0) compound. On lowering of temperature below the charge ordering temperature, (on heating), structural transition to a lower symmetry monoclinic structure in space group is found, as has been reported earlier in similar systems exhibiting the charge ordering behavior [51]. A signature of this in the form of splitting of nuclear Bragg reflections (0 0 4) (4 0 0) (2 4 2) in Pnma space group to (0 0 8) (4 4 2) and ( 4 2) in space group is observed below . The patterns displayed in the inset to figure 1 shows the structural transformation of orthorhombic phase in Pnma space group to charge and orbitally ordered monoclinic phase in space group. In space group, and ions occupy two distinct sites, in accordance with charge order scenario proposed in the Goodenough model [58]. Nevertheless, the Goodenough model has been challenged by experiments, which have presented evidence for charge disproportion in several half doped manganites. Studies reveal that this ionic picture proposed in Goodenough model of and ions may not be true and Zener polaron model [59, 60] has been proposed, in which all the Mn sites become equivalent with a valence of +3.5. Herrero-Martin et al. have probed the local structure around Mn ions in charge ordered systems using resonant scattering of synchrotron x-ray beam and show the presence of fractional charge segregation [61]. This disagreement between the two models is still not settled in literature. We find, in the absence of high resolution data, similar values of and R-factors on fitting the diffraction data in both Pnma and space groups. Additionally, lowering of symmetry to space group requires the refinement of 29 positional parameters as against 7 in Pnma space group. This reduces the reliability of obtained positional parameters. Therefore, the low temperature crystal structure is refined in Pnma space group, which yields an average structure. Similar refinement of neutron diffraction pattern has been performed in compound, which is in agreement with Radaelli et al. [51]. The obtained values of structural parameters are in agreement with the previously reported studies on compound [51].
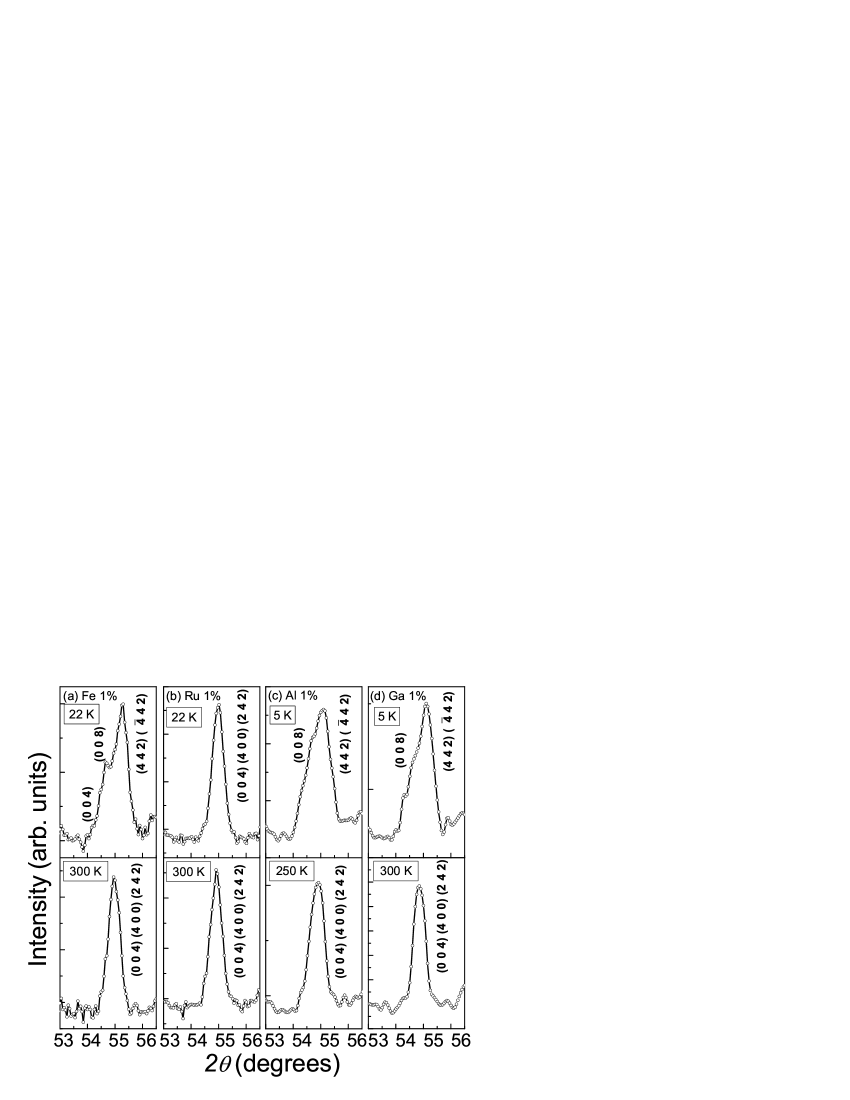
For comparison the selected portion of neutron powder diffraction patterns between for (B = Fe, Ru, Al, and Ga) samples is shown in figure 2. In (Fe 1% doping) sample the orthorhombic to monoclinic structural transition (figure 2(a)), similar to x = 0 compound is observed. In samples with higher Fe doping , this splitting is suppressed. This indicates the suppression of charge and orbital ordering with increasing Fe doping. In contrast, the similar doping concentration of Ru (1%) is found to suppress the monoclinic structural transformation and the orthorhombic structure in Pnma space group is retained down to the lowest temperature of 22K, as shown in figure 2(b). On substitution with Al and Ga , the signature of structural transformation from orthorhombic to charge and orbitally ordered monoclinic structure is observed, as shown in figure 2(c) and (d). On increasing the doping level in samples, the signature for the presence of monoclinic structure gradually disappears. This behavior is similar to that observed in Ni and Cr doped compounds by Martinelli et al. using neutron diffraction technique[46].

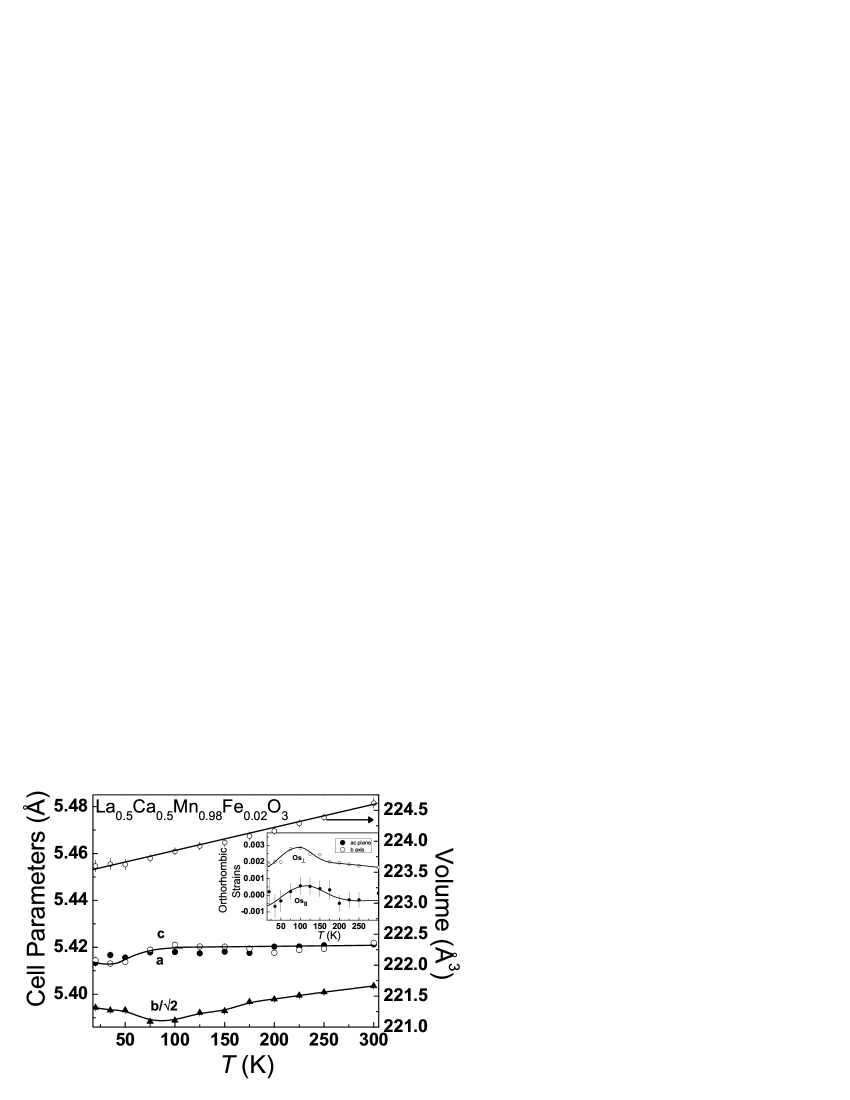
The cell parameters as a function of temperature in 1% Fe doped sample is shown in figure 3. On reducing the temperature below 300K, lattice parameters exhibit an anomalous behavior, while volume displays nearly linear temperature dependence. The lattice parameter b shows a drastic decrease while a and c expand on lowering of temperature. As a consequence, in neutron diffraction pattern the (2 0 2) and (0 4 0) nuclear Bragg reflections which were merged at 300K, exhibit splitting while cooling below in 1% Fe doped compound. This anomalous behavior is associated with ordering of orbitals in the a-c plane, which is in agreement with other similar charge ordered systems [51]. The temperature at which orbital ordering occurs is found to coincide with the charge ordering temperature. The charge ordering transition is the temperature below which the resistivity shows a steep rise. The transition to charge and orbitally ordered state is accompanied with an increase of strain in the a-c plane, as evidenced in compound [52]. Also, Ahn et al. have reported the importance of uniform strain in stabilization of the charge ordered phase [62]. To describe the orthorhombic strains, Meneghini et al. defined distortions in the ac plane and along the b axis [63]. The charge and orbital ordering transition is accompanied with a sharp increase in the orthorhombic strain parameters, and [52]. In 1% Fe doped compound, on lowering of temperature to 225K, both and increase and become nearly constant below 100K, as shown in the inset to figure 3. The strain increases below and therefore, favors the stabilization of charge ordered phase. Figure 4 shows the variation of cell parameters as a function of temperature for 2% Fe doped compound. In contrast to 1% Fe doped sample, here the cell parameters a, b and c decrease on lowering of temperature. However, below 100K, an anomalous behavior is observed. A minimum in b is found at 100K, which coincides with the onset of ferromagnetic transition temperature . This plausibly indicates that the onset of ferromagnetic ordering is accompanied by the reorientation of orbitals. The temperature dependence of lattice parameters in 4% Fe doped samples exhibit similar decrease on lowering of temperature and minimum in lattice parameter b at 125K, coinciding with . Similar temperature dependence of lattice parameters, with a minimum in b close to , has been reported previously in neutron diffraction studies on , for B = Ni and Cr doped systems [46]. The orthorhombic strains and , for 2% (shown in the inset to figure 4) and 4% Fe doped samples, exhibit a maximum close to ferromagnetic transition temperature of 100 and 125K, respectively. Such a behavior may indicate that with the onset of long range ordered ferromagnetic phase below , orthorhombic strains in the lattice are reduced, accompanied with suppression of charge and orbital ordering. At higher Fe doping in with , the cell parameters exhibit nearly linear reduction while cooling. As a consequence, no significant change in and is observed.
In with samples, the cell parameters as a function of temperature display behavior similar to that described for 2% Fe doped sample. A minimum in lattice parameter b is observed at , coinciding with the ferromagnetic transition temperature. In accompaniment, the and show a maximum at temperature close to . On increasing the Ru doping in (Ru 5% doping) sample, no anomalous behavior in lattice parameters as a function of temperature is observed and display almost linear reduction on lowering of temperature below 300K. Consequently, the orthorhombic strain parameters exhibit no significant change as a function of temperature.
With Al doping in compounds, the temperature evolution of cell parameters exhibit behavior typical of charge and orbital ordering, as observed in sample (figure 3). The variation of orthorhombic strain parameters show an increase below the charge and orbital ordering temperature. This indicates the ordering of orbitals in the ac plane is accompanied with an increase in strain [51, 52]. Additionally, in the 3% Al doped sample, broad minimum in lattice parameter b accompanied by a maximum in orthorhombic strains close to ferromagnetic transition temperature is observed. In contrast with Fe and Ru substituted compounds, the signature of charge and orbital ordering in Al doped systems are retained up to much higher doping level with x = 0.07. However, the transition temperature of the charge and orbital ordering continuously reduces with increasing Al doping. Finally, in samples, charge and orbitally ordered state is fully suppressed. Similarly, with Ga doping of 1%, the signature of charge and orbital ordering is evident in the temperature dependence of cell parameters. At 3% Ga doping, minimum in lattice parameters is seen at . This behavior is similar to 2 - 4% Fe and 1 - 3% Ru doped samples. At higher Ga substitution, charge and orbitally ordered state is fully suppressed.
Therefore, doping with magnetic ions (Fe and Ru) causes suppression of charge and orbital ordering much more rapidly than with non magnetic dopants (Al and Ga). In samples exhibiting ferromagnetic ordering, anomalous behavior of cell parameters is observed, which coincides with the onset of ferromagnetic transition. These results indicate that with induced disorder at B - site the homogeneous strain field is collapsed into an inhomogeneous one, which is accompanied by the gradual suppression of charge ordered phase. Theoretical studies have shown that long range homogeneous strain plays a crucial role in stabilization of charge and orbitally ordered state in half doped manganites [64]. Experimentally, the presence of phase coexistence behavior in manganites is correlated with different lattice strains, wherein their interplay with temperature lead to stabilization of one phase at the expense of the other [23, 43, 44, 45]. Structurally, more distorted phase would favor insulating state, whereas the less distorted one would exhibit ferromagnetic metallic behavior.
3.2 Magnetization and Transport Behavior
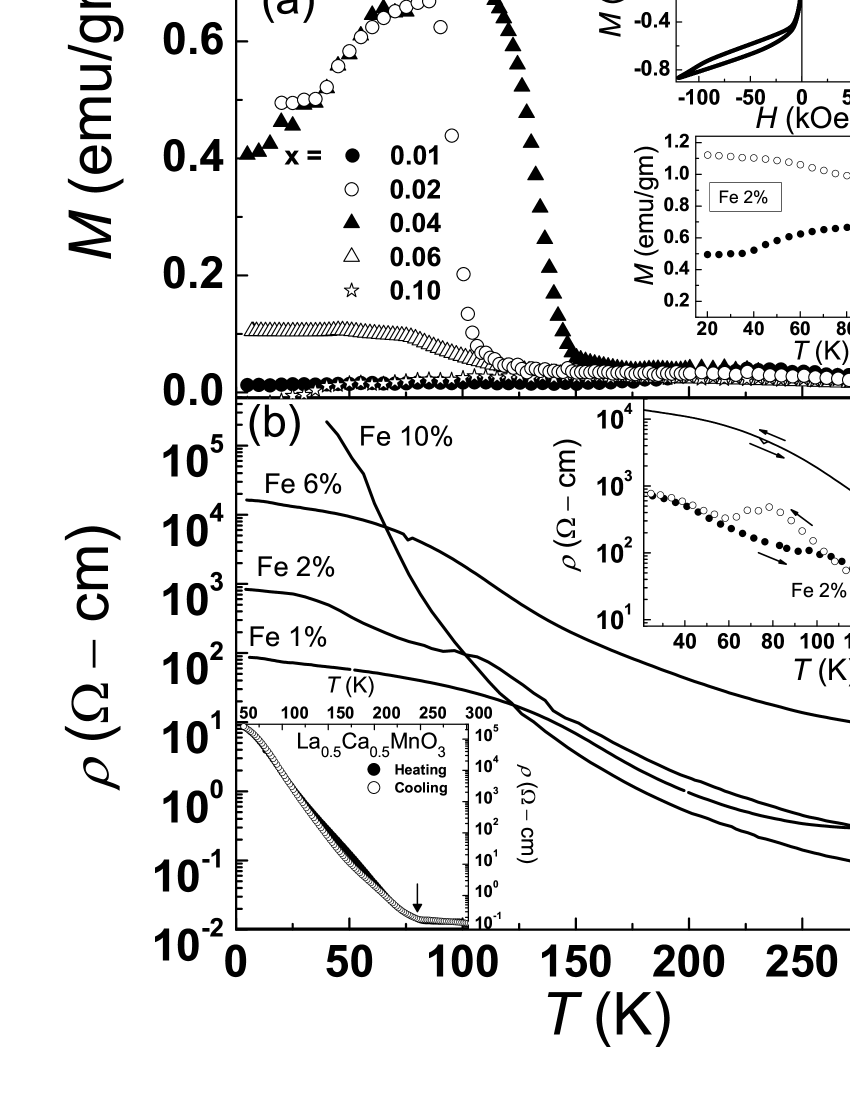
The temperature dependence of magnetization, M(T), measured under zero field cooled (ZFC) and field cooled (FC) conditions for samples, is shown in figure 5(a). The 1% Fe doped sample undergoes multiple magnetic transitions as a function of temperature, displaying behavior similar to x = 0 compound [52]. On lowering of temperature at , a hump in magnetization is observed (not visible on the present scale in figure 5(a)). This coincides with the onset of charge ordered insulating state and , as observed for x = 0 compound [52]. On further reducing the temperature, another broad hump in magnetization is observed at , which is identified with an antiferromagnetic transition temperature obtained from neutron diffraction study. The variation of magnetization with field, M(H), of 1% Fe doped sample at T = 10K is shown in the inset to figure 5(a). In the region , coexistence of ferromagnetic clusters in the charge and orbitally ordered antiferromagnetic matrix is evident from the narrow hysteresis loop in M(H) behavior. However, the moment value is considerably lower than the expected value. In addition, anomalous behavior in the form of virgin curve lying outside the envelope curve and a step like behavior in virgin curve is visible in M(H) data. Previous reports on the high resolution neutron diffraction studies in the presence of magnetic field show that the steps in M(H) of charge ordered systems with CE-type antiferromagnetic structure is accompanied by a change in the cell parameters [65, 66]. In Ga substituted compound, magnetic field as high as 6T is observed to favor ferromagnetic phase, without significantly influencing the CE-type antiferromagnetic state. A similar description based on martensitic like scenario on the strain accommodation in phase separated manganites has been proposed to explain the step like behavior in M(H) [66, 67]. At higher Fe doping in with , the magnetic nature appears to be modified. On cooling below 300K, the M(T) exhibits an increase below the respective ordering temperatures and display no significant change thereafter, which indicates the onset of ferromagnetic state. The ferromagnetic transition temperature, , for 2%, 4%, and 6% Fe doped samples are 100, 150 and 75K, respectively. In these Fe doped samples, a large bifurcation between the ZFC and FC curves arises below 50K, as shown in the inset (ii) to figure 5(a) for 2% Fe doped sample, indicating the coexistence of ferromagnetic and spin glass phase. The presence of spin glass phase in B - site substituted compounds has been brought out in some of the recent theoretical studies [50]. The ferromagnetic behavior is progressively suppressed with increase in Fe doping and in 10% Fe doped sample, no evidence of long range magnetic ordering is observed. This is also confirmed by neutron diffraction measurements described later. However, extremely narrow hysteresis loop evident in M(H) suggests the presence of short range ferromagnetic ordering.
The variation of resistivity with temperature, , in samples is shown in figure 5(b). The resistivity data were collected during heating and cooling cycles. In these samples, the temperature dependence of resistivity exhibits an insulating behavior over the entire measured temperature range between 5 to 300K. In comparison to compound ( shown in the inset (ii) to figure 5(b)), in Fe doped samples with , reduction in resistivity at 5K by nearly two orders of magnitude is found. Besides, with Fe doping the point of inflection below which the exhibits a steep rise is absent. This indicates the suppression of charge ordering in these samples, which is in agreement with the suppression of structural transition from orthorhombic phase in Pnma space group to monoclinic phase in space group observed in the low temperature neutron diffraction study. Additionally, a broad hump accompanied with a thermal hysteresis between heating and cooling cycle, is evident near and is shown in the inset (i) to figure 5(b). The gradual suppression of the anomalous behavior and reduction in the width of thermal hysteresis with increasing Fe doping is also evident in this figure. The thermal hysteresis behavior in , observed in phase separated manganites, has been explained to arise from the formation of metal clusters and their size distribution across the metal insulator transition [68].

The magnetization data, M(T), of samples is shown in figure 6(a). As a function of Ru doping, the increase in M(T) at 200K indicates an onset of ferromagnetic ordering. The broad nature of transition indicates an inhomogeneous nature of ferromagnetic state. The M(H) data, for 1% Ru doped sample is shown in the inset to figure 6(a). This figure is representative of the Ru doped samples with . The signature of a typical ferromagnetic behavior is evident in M(H) curve. At low field, magnetization M shows a sharp rise and saturates thereafter. The saturation value of magnetization is close to the expected value of In figure 6(b), temperature dependence of resistivity, , of Ru doped samples is displayed. With Ru doping of 1% the charge ordered insulating state is destabilized and insulator to metal transition is induced at . Similar behavior in is observed for Ru doped sample with x = 0.05. No significant change in and as a function of Ru doping is observed. Similar behavior has been recently reported in Ru doped compounds, attributed to the coexistence and competing nature of double exchange and superexchange interactions [69, 70]. Also, it is observed that there is a large difference between and in Ru substituted samples; . The observed difference indicates the percolative nature of ferromagnetic regions.
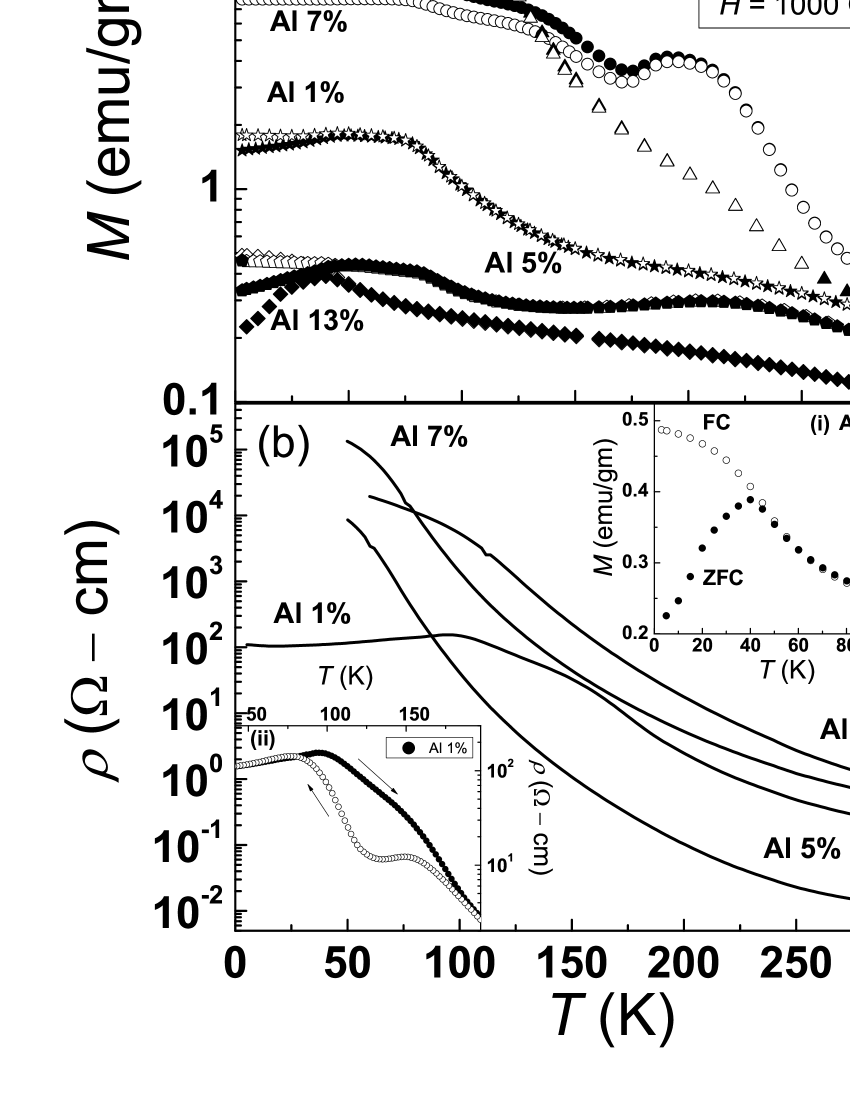
In figure 7(a) the magnetization as a function of temperature in samples is displayed. In the 1% Al doped sample, a shallow hump in M(T) at is observed. The SANS study described later show the onset of short range ordered ferromagnetic correlations below 200K. On further lowering of temperature the magnetization saturates below 75K. From the magnetization studies transition to an antiferromagnetic state is not clear. Neutron diffraction study on 1% Al doped sample show evidence of antiferromagnetic ordering with . The resulting competing nature of the ferromagnetic and antiferromagnetic interactions describes the magnetization behavior. The value of magnetization at 5K increases with increase in Al concentration, exhibiting a maximum for 3% Al doping, and decreases subsequently for higher Al doping. In 3% Al doped sample transition to a ferromagnetic state occurs at and from neutron diffraction study we learn the presence of antiferromagnetic phase below . In with compounds, similar behavior of transition to antiferromagnetic and ferromagnetic states are observed. The nature of antiferromagnetic ordering in these compounds obtained from neutron diffraction measurements is discussed below. Likewise, in Al doped samples with , M(T)increases below 100K and a maximum at 50K is observed. At 50K, M(T) displays a drop accompanied by bifurcation in FC and ZFC curves, as shown in the inset (i) to figure 7(b) in 13% Al doped sample. Such a behavior has been reported in other charge ordered manganites and is ascribed to transition to a spin glass like state [71, 72]. Both randomness and frustration of spins are necessary to produce a spin glass state. The competing antiferromagnetic and ferromagnetic interactions could lead to such frustrations in the system, leading to a growth of spin glass or clusters glass state. The nature of spin glass phases in manganites is still a topic of discussion [72, 73]. The resistivity data, , of Al doped samples in is displayed in figure 7(b). In with samples, while cooling from 300K insulator to metal transition, accompanied by thermal hysteresis (inset (ii) to figure 7(b)), is observed at . The origin of thermal hysteresis is similar to that described in the case of Fe doped samples. In higher Al doped compounds with , temperature dependence of resistivity again shows an insulating behavior over the entire measured temperature range between 50 and 300K. Below 50K resistivity is too high to be measurable. Also, thermal hysteresis between heating and cooling cycle is diminished.
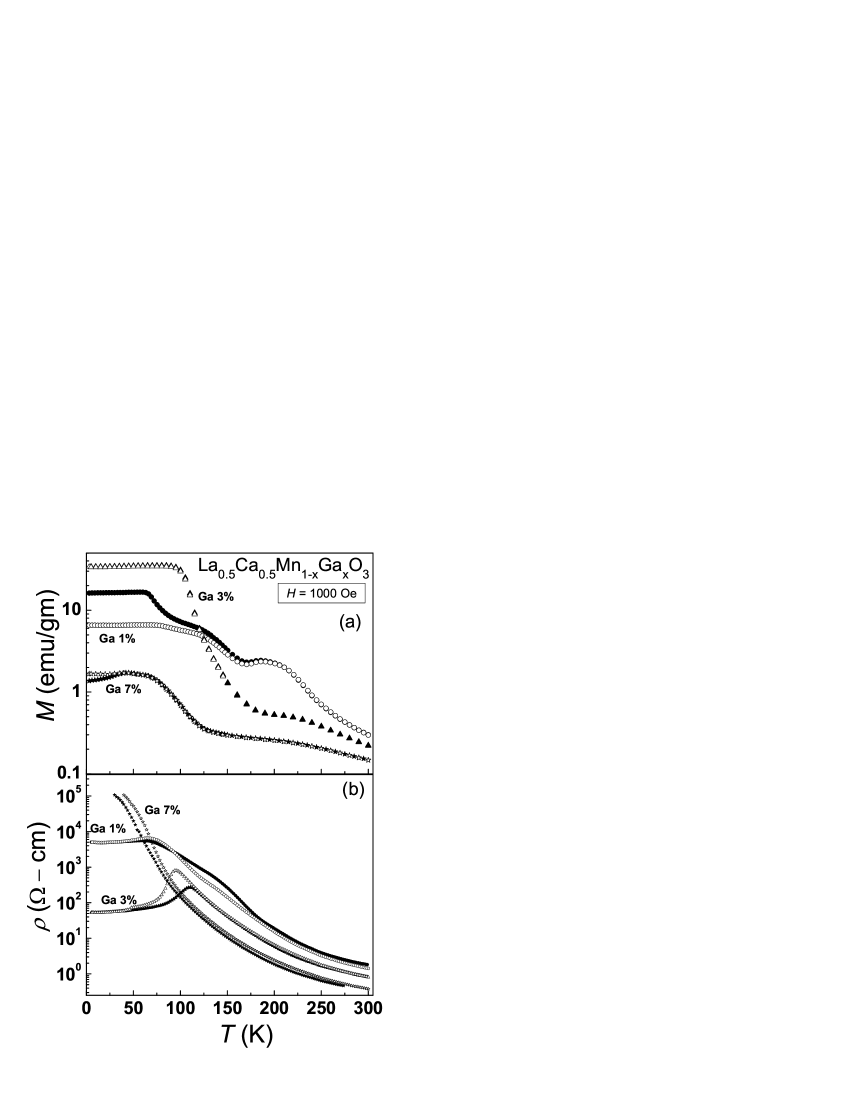
In , the M(T) shown in figure 8(a), displays behavior similar to Al doped samples. In 1% Ga doped sample, the transition correlated with charge and orbitally ordered state at and the magnetic transitions at (obtained from neutron diffraction study) and are observed. At 3% Ga doping, the ferromagnetic transition is evident at , with no bifurcation in ZFC and FC curves. At higher Ga doping of 7%, sharp increase in magnetization occurs below , exhibiting a maximum at . Below , the sharp drop in magnetization is accompanied with a bifurcation between ZFC and FC curve. Also, the typical features of metamagnetic transition and phase coexistence are evident in the M(H) curves of Ga doped samples. With Ga doping in , resistivity as a function of temperature display behavior similar to Al doped sample, as observed in figure 8(b). The Ga doped samples undergo insulator to metal transition at , while the x = 0.07 sample remains insulating down to 50K. Both Al and Ga doping exhibits similar magnetic behavior, though based on their ionic radii they are expected to selectively substitute and ions, respectively.
3.3 Magnetic Structure
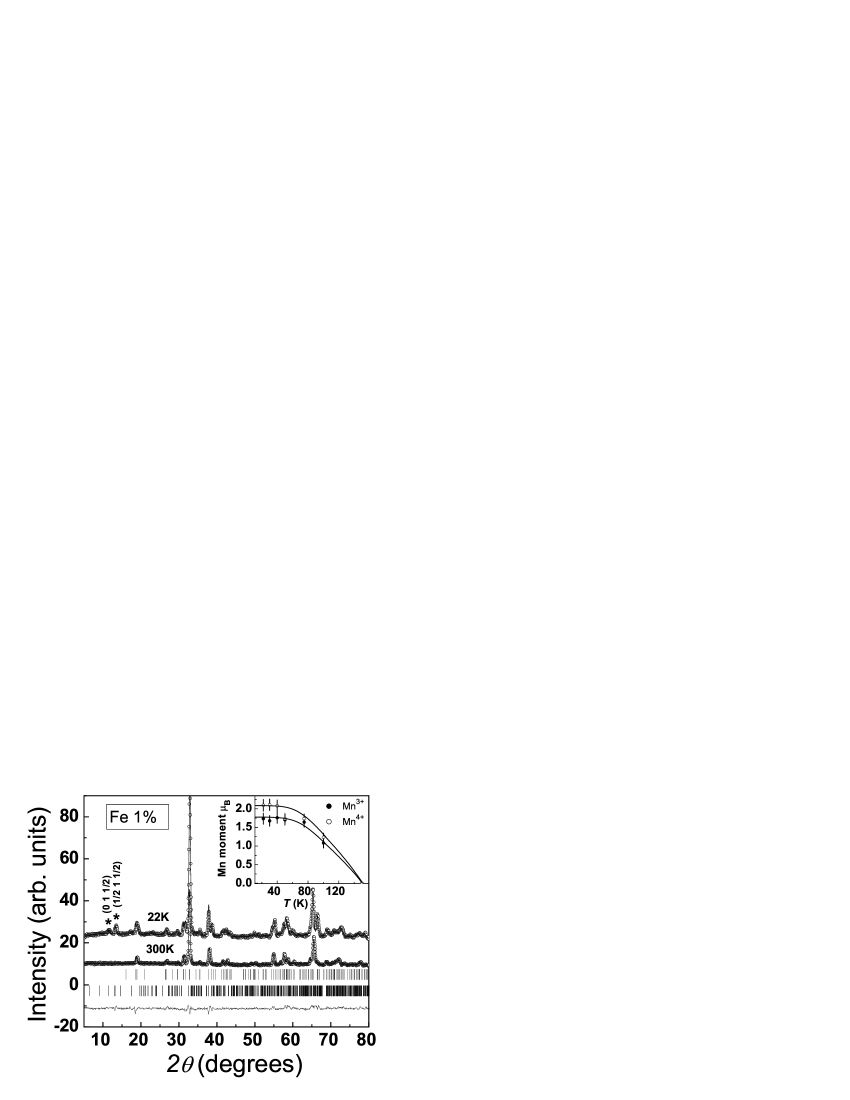
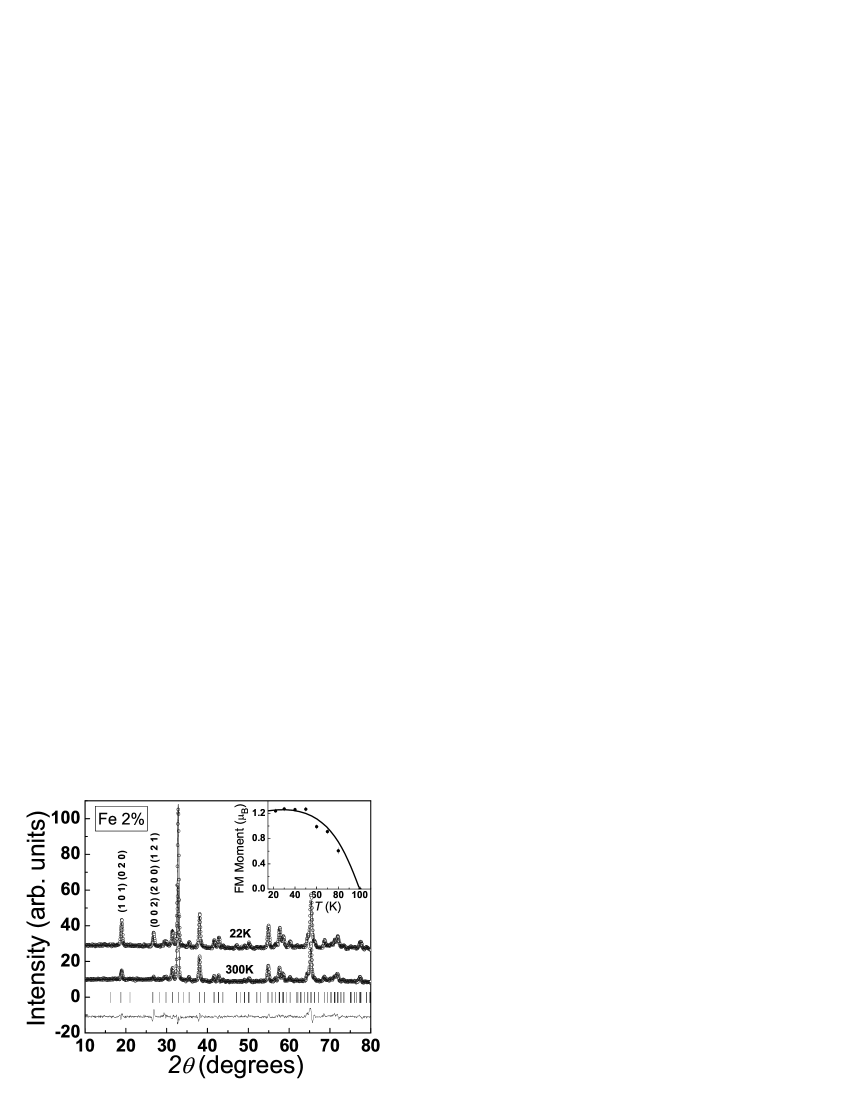
The neutron diffraction pattern in the angular range of (Fe 1% doping) sample at 300 and 22K is shown in figure 9. This neutron diffraction pattern is a representative of the samples displaying CE - type antiferromagnetic spin structure at low temperatures. In 1% Fe doped sample, on lowering of temperature, below the antiferromagnetic ordering temperature superlattice reflections are observed similar to that of compound (figure 1). This suggests the antiferromagnetic nature of the sample below the transition temperature . The superlattice reflections are marked with an asterisks (*) symbol in figure 9. Particularly, strong reflections (0, 1, ½) and (½, 1, ½) are shown and these characterize the onset of CE - type antiferromagnetic ordering [51]. These superlattice reflections are indexed on a cell in the space group . In CE - type antiferromagnetic spin structure the and ions occupy two distinct sites and are associated with propagation vector (0, 0, ½) and (½, 0, ½), respectively. The CE - type model used for refinement describes the low temperature phase as one - dimensional zig - zag chains with ferromagnetically aligned spins in the ac plane, while the interchain coupling is antiferromagnetic. This is the checker board pattern and the model was first proposed by Wollan and Kohler [74]. The temperature dependence of Mn site moment for and ions in 1% Fe doped compound is shown in the inset to figure 9. In 1% Fe doped compound is deduced from the temperature dependence of the refined Mn site magnetic moment. The Rietveld refinement of the neutron diffraction pattern at 22K indicates that the magnetic moment for and sites are predominantly oriented along either a or c axis and their values are 1.9(2) and 2.1(1) , respectively. These values are lower in comparison to the values obtained in the case of x = 0 sample as, 2.8(3) and 2.6(3) and that reported by Radaelli et al. [51] for and sites, respectively. The lowering of both the site moment indicates that is distributed randomly over both the sites. is a non JT ion like . However, unlike , the number of electrons increase with Fe doping. Our observation are again different from the incommensuration of observed in the case of doping [46]. From the present neutron diffraction data no significant change in and magnetic R - factor is observed on changing the orientation of spins between a and c axis. Therefore, the spins were constrained to be orientated along a axis. Similarly, the x and z axis component of magnetic moment of ions could not be refined separately and therefore the orientation was constrained to be along a axis. Additionally, no enhancement in intensity of low angle fundamental Bragg reflections was visible, which indicates the absence of ferromagnetic ordering observable from the present neutron diffraction experiment. This is further corroborated by SANS data where no signature of ferromagnetism is observed. In figure 10, the neutron diffraction pattern of 2% Fe doped sample at 22 and 300K is shown. With as little as 2% Fe doping, the CE-type antiferromagnetic state is completely suppressed, indicated by the absence of superlattice reflections at 22K. In addition, significant enhancement in intensity of low angle nuclear fundamental reflections at 22K is observed. The nuclear reflections (1 0 1) (0 2 0) and (2 0 0) (0 0 2) (1 2 1) show the maximum enhancement in intensity. Similar behavior is observed in samples with . This is a clear indication of long range ferromagnetic ordering in these samples. The ferromagnetic phase is fitted in orthorhombic structure in Pnma space group. The ferromagnetic ordering temperatures for 2, 4 and 6% Fe doped samples are 100, 150 and 75K, respectively, in concurrence with magnetization studies. The inset to figure 10 shows the refined magnetic moment as a function of temperature in 2% Fe doped sample with . At 22K, the refinement of diffraction pattern of 2% Fe doped sample yields the moment value as , in agreement with the M(H) data. The observed magnetic moment is much lower than the expected value of . On further increasing the Fe doping to 10% no evidence for the presence of long range magnetic ordering is observed from neutron diffraction study. However, the signature for the presence of short range ordered ferromagnetic phase is evident in M(H) study.
The neutron diffraction pattern of compounds display characteristics similar to compound (figure 10). The temperature dependent neutron diffraction study on these samples show a progressive rise in intensity of the low angle fundamental reflections below . Additionally, no signature of antiferromagnetic ordering, in form of evolution of superlattice reflections, are observed. The ferromagnetic phase at low temperature is refined in orthorhombic structure in Pnma space group, as described for the 2% Fe doped compound. The refined ferromagnetic moment at 22K for 1% and 5% Ru doped samples are 2.64(5) and 3.19(6) , respectively and are in agreement with the M(H) study.
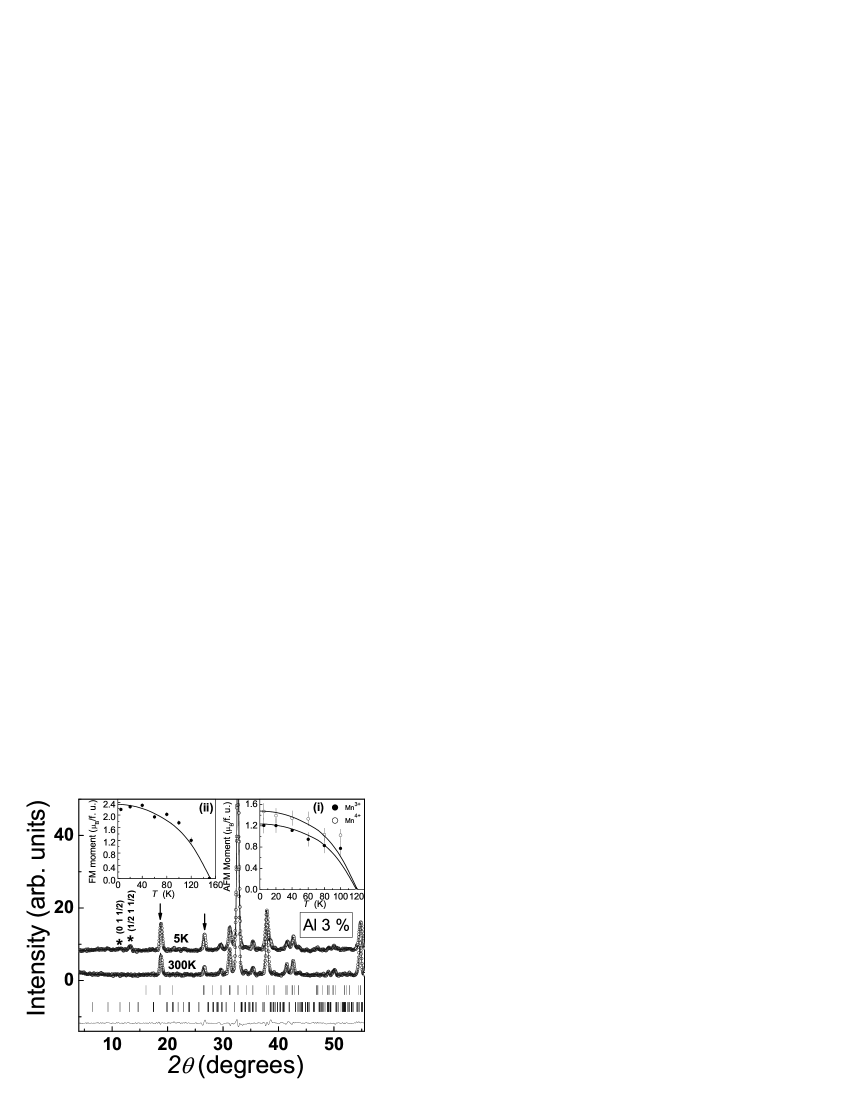
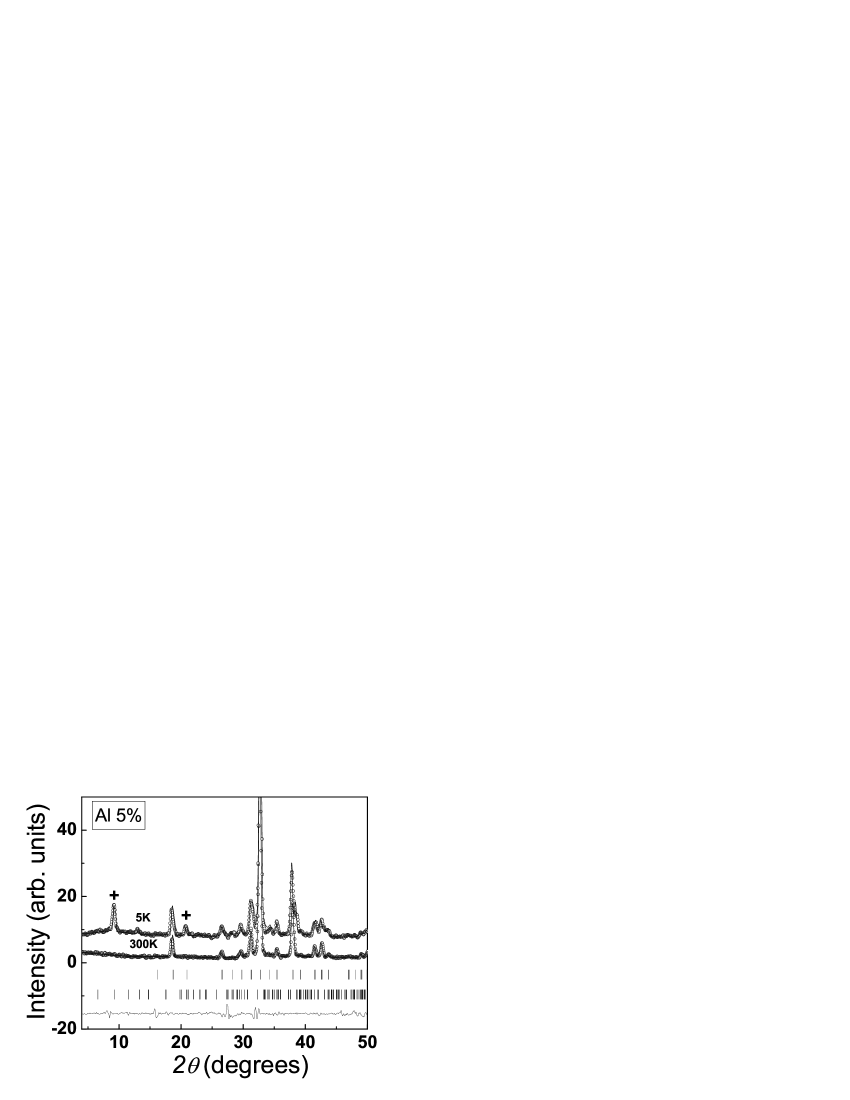
In the 1% Al doped sample the superlattice reflections below , in addition to enhancement in low angle fundamental Bragg reflections below are observed. The superlattice reflections are indexed to CE - type antiferromagnetic structure. The Rietveld analysis of the diffraction data is carried out taking both ferromagnetic and antiferromagnetic phases. The obtained antiferromagnetic moment values at 5K on and sites are 2.8(2) and 2.5(2) , respectively. The value of antiferromagnetic moment is close to that observed in the case of x = 0 sample. The ferromagnetic moment value is 1.1(1) and is in agreement with the M(H) study. The coexistence of ferromagnetic and antiferromagnetic phases observed in this sample is distinct from the Fe doped samples where only CE - type antiferromagnetic state is evident. In contrast to Fe doped samples, here with non magnetic Al doping, we find coexisting charge ordered insulating and ferromagnetic metallic phases. In figure 11, we have shown the neutron diffraction patterns of with x = 0.03. In this sample behavior similar to the 1% Al doped compound is observed. However, the antiferromagnetic moment values at the respective and sites are reduced to 1.2(1) and 1.5(1) , in comparison to the 1% Al doped compound. The temperature dependence of the antiferromagnetic moment is shown in the inset (i) to figure 11. This reduction in CE - type antiferromagnetic moment is accompanied by the favoring of ferromagnetic ordering with . The ferromagnetic moment as a function of temperature in the 3% Al doped sample is displayed in the inset (ii) to figure 11. The refined ferromagnetic moment value at 5K is 2.18(6) , which is in corroboration with the M(H) study. Therefore, in samples with , CE-type antiferromagnetic ordering coexists with the ferromagnetic ordering. This is not very evident from M(T, H) studies alone. In 5% Al doped compound, the CE - type antiferromagnetic state with considerable reduction in moment value is still evident, whereas the ferromagnetic phase is fully suppressed. In addition, new distinct superlattice reflections indicated by (+) in figure 12 are observed. The d-values and the relative intensity of these superlattice reflections match with those reported previously in half doped manganites and attributed to A-type antiferromagnetic ordering [9, 75, 76]. The Rietveld refinement of the diffraction data at 5K shows that these superlattice reflections correspond to A - type antiferromagnetic ordering. These superlattice reflections are indexed on cell in space group. In the A - type antiferromagnetic structure Mn spins form ferromagnetic planes with an antiferromagnetic coupling between them. The magnetic moment in this A - type antiferromagnetic phase is 2.64(6) , oriented ferromagnetically in ac plane and antiferromagnetically along b axis. The suppression of CE - type and emergence of A - type antiferromagnetic state observed in these systems is similar to that observed in previously reported neutron diffraction studies on A - site doped compounds [9, 8]. On increasing the Al doping to 7%, both CE - type antiferromagnetic and ferromagnetic phases are suppressed, while the superlattice reflections corresponding to an A - type antiferromagnetic state are still visible below . The obtained value of magnetic moment at 5K is 3.12(6) . Eventually, with increasing Al doping between 10 and 13%, the A - type antiferromagnetic state is also suppressed and no signature of long range magnetically ordered phases are seen from neutron diffraction measurements.
With Ga doping in , the results obtained from the present temperature dependent neutron diffraction study exhibit behavior similar to Al doped samples. In low Ga doping of 1%, the CE-type antiferromagnetic state is observed below , accompanied by ferromagnetic ordering below . The refinement of diffraction pattern at 5K yields antiferromagnetic moment values at and sites as 2.3(2) and 2.3(2) , respectively, while the ferromagnetic moment value is 1.0(1) . At 3% Ga doping also, the CE - type antiferromagnetic phase is accompanied with the ferromagnetic state having . However in comparison to the 1% Ga substituted compound, the CE - type antiferromagnetic phase is significantly weakened, indicated by the reduced moment values at and sites as 1.4(2) and 1.2(1) . The obtained ferromagnetic moment value at 5K is 2.74(6), in agreement with the M(H) study. Finally in 7% Ga doped sample, both CE - type antiferromagnetic and ferromagnetic states are suppressed, whereas the A - type antiferromagnetic state persists below . The obtained moment value at 5K is . The A-type antiferromagnetic spin structure has been analyzed in a manner similar to that described for Al doped compounds.
Therefore, the present neutron diffraction measurements together with magnetization and transport measurements reveal the evolution of various complex magnetic structures, as a function of temperature and different B - site dopants. In specific, we find the emergence of A - type antiferromagnetic spin structure accompanied by the gradual suppression of both CE - type antiferromagnetic and ferromagnetic phases, on substituting with non - magnetic dopants in with B = Al and Ga compounds, which has not been observed before. This is unlike the behavior reported in compound, wherein doping with non magnetic ions such as Al, Ga or Ti leads to the development of pseudo CE - type antiferromagnetic state at the expense of CE - type antiferromagnetic ground state [42, 44, 65].
3.4 Small Angle Neutron Scattering
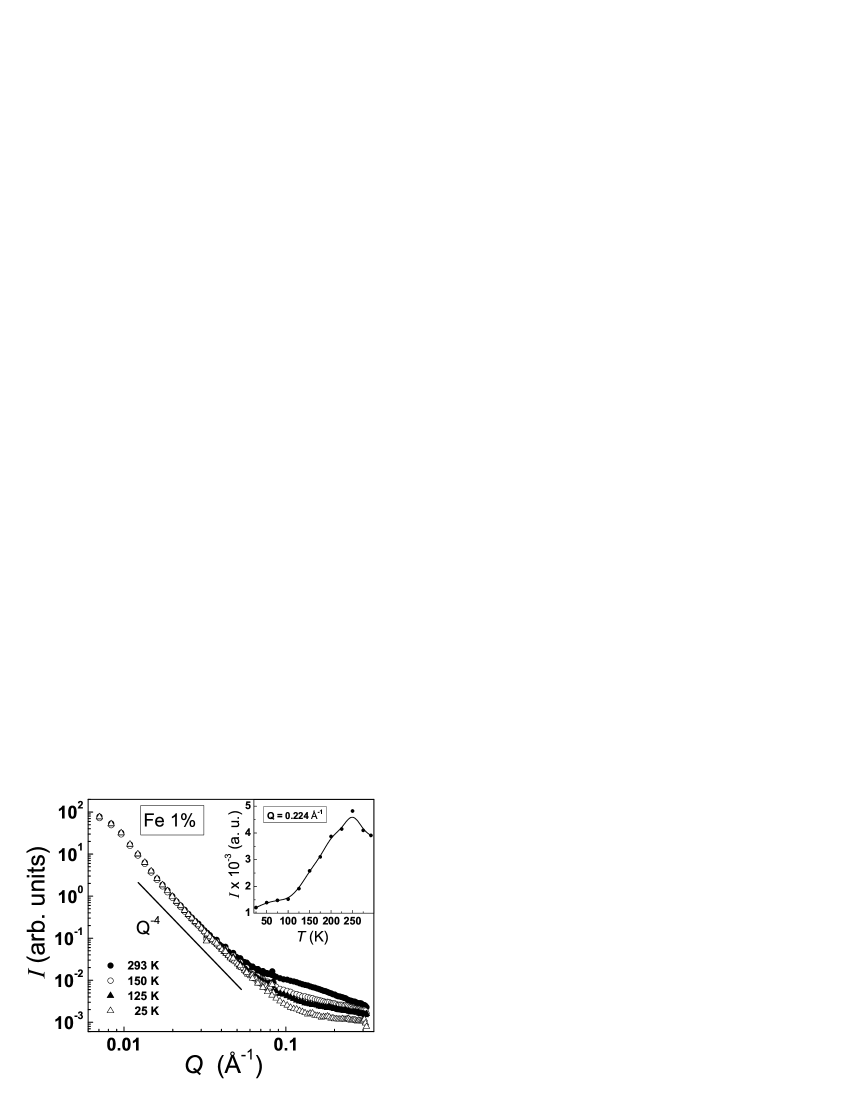
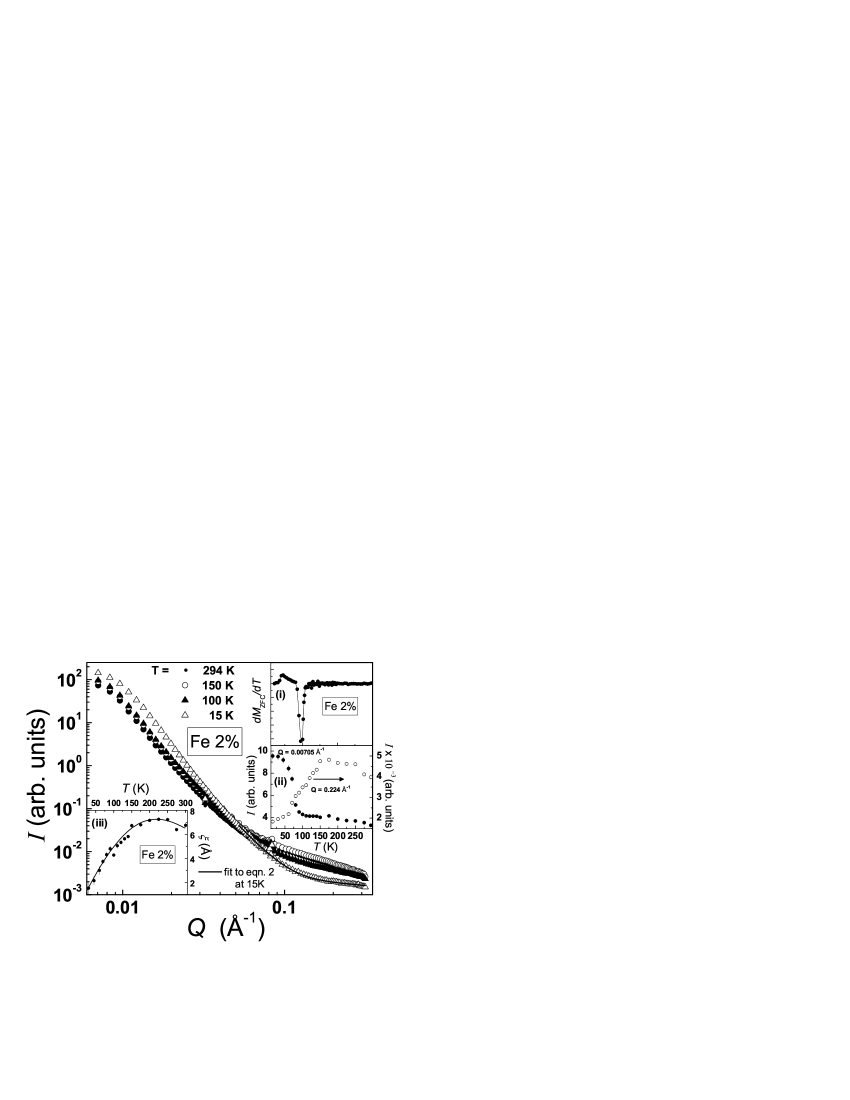
The presence of short range ordered ferromagnetic correlations as a result of B - site substitution in compound, for few of the selected samples is explored using SANS measurements, in the length scale of 10 to 1000Å. The small angle neutron scattering (SANS) intensity as a function of Q, I(Q), in the compound (1% Fe doping) at various temperature is shown in figure 13. Two distinct regimes in are observed from this figure. In the range, the intensity does not exhibit any temperature dependence, while in the high regime significant change in intensity is observed. In the low Q regime, the intensity exhibits dependence, obeying classical Porod’s law [77]. This behavior is attributed to the clustered structure, where smooth sphere particles are embedded in a matrix background. On the other hand, in high Q regime i. e. at smaller length scales, above the ordering temperature , intensity has contributions from both disordered paramagnetic scattering and nuclear scattering. On lowering of temperature below the magnetic ordering, paramagnetic disorder scattering is reduced and only the nuclear contribution persists as the antiferromagnetic phase does not contribute to the SANS intensity. The inset to figure 13 shows the temperature dependence of scattered neutron intensity at in compound. For length scale at about and beyond, a maximum at 230K is observed, which coincides with the weak hump in M(T) (figure 5(a)). In neutron diffraction measurements we do not observe any evidence of long range ferromagnetic ordering in this sample. The decrease in the maximum value of (figure 5(b)) in this sample, together with these results suggests that the reduction in intensity below 230K indicates the suppression of paramagnetic scattering with the onset of short range ferromagnetic ordering. However, no further evidence of ferromagnetic ordering is observed in the low Q regime as observed in other samples. Therefore, from both neutron diffraction and the SANS study no signature of ferromagnetic ordering behavior is observed in the zero field CE - type antiferromagnetic state for 1% Fe doped sample. Figure 14 shows the SANS intensity in (2% Fe doping) compound at several temperatures between 15 and 295K. However, in contrast to 1% Fe doped sample, enhancement in intensity in the regime is observed on lowering the temperature below . The temperature dependence of SANS intensity at = 0.00705 and 0.224 for 2% Fe doped sample is shown in the inset to figure 14. This figure shows the rise in intensity at below 100K, indicating the ferromagnetic transition, in agreement with neutron diffraction and M(T) measurements. This behavior correlates well with the temperature derivative of ZFC magnetization, , wherein the minimum in magnetization close to 100K is evident. While, in the high Q range at , behavior similar to 1% Fe doped sample is observed, which is identified as reduction in paramagnetic disorder scattering accompanied by the onset of short range ordered ferromagnetic state. The comparison between the SANS intensity and temperature dependence of strain parameters ( and ) in 2% Fe doped sample (inset to figure 4) display that the favoring of ferromagnetic ordering is accompanied by reduction in lattice strain. This behavior is in agreement with previously reported SANS study on compound exhibiting similar magnetic properties, wherein the growth of ferromagnetic clusters within the antiferromagnetic insulating phase is governed by reduction in lattice strains in the system [78]. In the Q regime between 0.05 to 0.31 , the Q dependence of scattering intensity has been described by the combination of Porod’s law ( dependence) and Lorentzian profile function ( dependence) given as,
| (1) |
where, and are scattering amplitudes and , is the correlation length of magnetic clusters. The corresponding fits by continuous line at 15K is shown in figure 14. Similar behavior has been reported previously, wherein the dependence is ascribed to the scattering by the phase separation interface, while dependence arises from nanometric magnetic inhomogeneities [79]. Although, according to Ch. Simon et al., in single crystal sample, the dependence may be a characteristic of two dimensional ferromagnetic stripes, suggesting a red cabbage structure [80]. The correlation length as a function of temperature shown in the inset (iii) to figure 14 exhibits a broad maximum between 150 and 250K, which suggests the presence of short range ordered ferromagnetic clusters even above the ferromagnetic ordering temperature. In a previous study, we had observed the evidence of diffuse neutron scattering in the region , in related compounds, indicating the existence of short range ordered magnetic correlations in the paramagnetic regime much above the ordering temperatures [81]. The existence of short range ordered ferromagnetic phase is also reported in many of the SANS measurements on other perovskite manganite systems [78, 79, 80] and is a signature of magnetic polarons. The scattering amplitude follows the temperature dependence of intensity at shown in the inset to figure 14, while no significant change in as a function of temperature is observed.
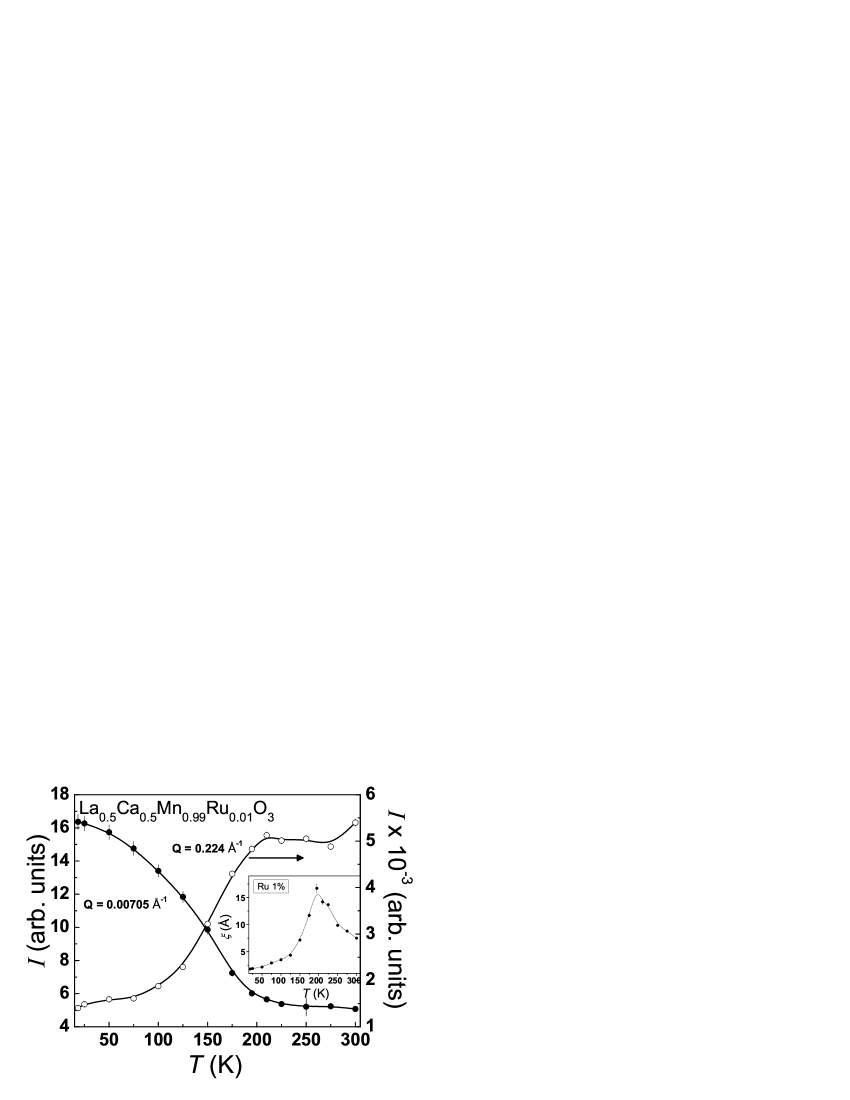
In figure 15, the temperature dependence of the SANS intensity at = 0.00705 and 0.224 for (1% Ru doping) sample is shown. In this sample, the temperature dependence of SANS intensity as a function of Q, exhibits behavior similar to 2% Fe doped compound (figure 14). In the low Q regime , the scattering intensity follows a dependence, whereas at higher Q values the behavior is described by equation 1. The obtained correlation length as a function of temperature, shown in the inset to figure 15, exhibits a sharp maximum across the ferromagnetic ordering temperature. The temperature of such a feature correlates well with one obtained from the magnetization measurement . At , the intensity as a function of temperature, shown in figure 15, displays an increase on cooling below 200K, indicating the ferromagnetic nature of the sample. This behavior is followed by an increase in SANS intensity on raising the temperature above 200K, at smaller , evident in the figure 15. This behavior also correlates with the minimum observed in plot. In this 1% Ru doped compound also, similar to 2% Fe doping, evidence of ferromagnetic ordering on two different length scales is observed.
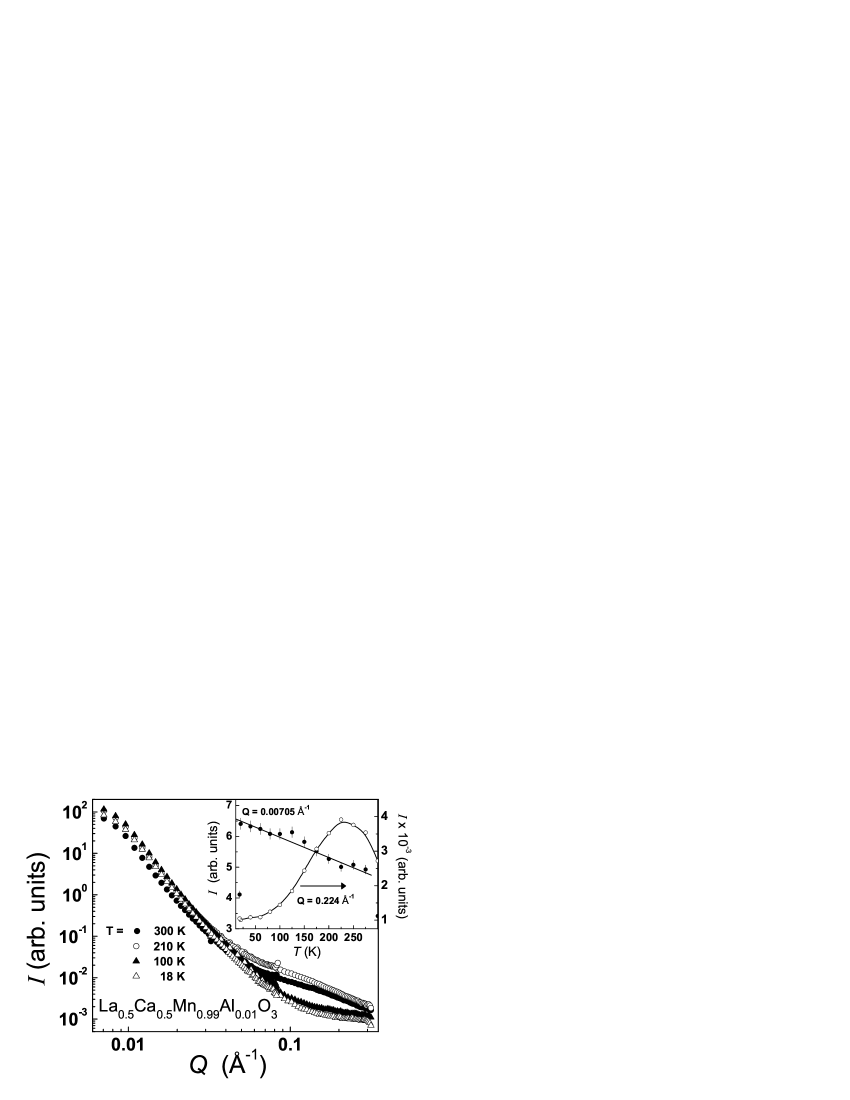
The variation of small angle neutron scattering intensity as a function Q, at several temperatures between 18 and 300K, for (1% Al doping) sample is shown in figure 16. The neutron diffraction measurements on 1% Al doped sample shows two transitions at and . In figure 16, for low Q values at low temperatures, the crossing over of SANS curves is found. Although, enhancement in intensity at low Q values below 0.044 is considerably small, as compared to 2% Fe and 1% Ru compounds. The temperature variation of intensity at exhibits almost linear increase upon cooling below 300K (the inset to figure 16). At high Q value of 0.224, the scattering intensity displays a sharp peak at 200K, coinciding with the broad hump in M(T) data. This indicates the existence of nanometric size ferromagnetic regions, which coexists with the long ranged antiferromagnetic phase below . SANS measurements have also been performed on higher Al doped sample in (5% Al doping). Contrastively, this sample exhibits the stabilization of A - type antiferromagnetic state at low temperatures. The temperature variation of SANS intensity I(Q) for 5% Al doped sample displays characteristics similar to 1% Fe doped compound (figure 13). At low Q (< 0.055) values the scattering curves overlap, displaying no significant change with temperature. While, in the high Q regime at scattering intensity exhibits a decrease below 200K, attributed to the reduction of paramagnetic disorder scattering accompanied with the growth of nanometric sized ferromagnetic regions.
The above results clearly demonstrate the contrastive nature of magnetic (Fe and Ru) and non magnetic dopants (Al and Ga) in half doped compound. According to previous studies on B - site substituted charge ordered manganites, contrasting nature in the stabilization of magnetic ground states has been ascribed to different mechanisms, such as the valence state of dopants, magnetic exchange interaction with Mn ions, and between dopants plays an essential role. These studies have shown that Fe ions couple antiferromagnetically with Mn ions [82, 83, 84], while Ru ions couple ferromagnetically with Mn ones [15, 85, 86, 87]. In addition, Ru doping enhances the local electron density; therefore strongly favor ferromagnetic metallic phase [88]. These effects may together contribute towards the favoring of insulator to metal transition in Ru doped samples [47, 48]. On the other hand, the non magnetic dopants are considered as random impurities, not having any magnetic coupling with Mn ions. The effect of random substitution at the B - site by magnetic and non-magnetic dopants has been investigated by Monte Carlo simulation studies in half doped manganites [47, 48, 88]. The non - magnetic impurity doping at the B - site is introduced as lattice defects and may modify the electron density, while in the case of magnetic doping, the magnetic exchange interactions are also taken into account. Our experimental studies are fairly consistent with these theoretical studies, wherein the long range ordered antiferromagnetic state collapses into a ferromagnetic phase and this behavior is ascribed to lattice defects introduced in the form of non magnetic B - site dopants. However, our studies indicate the absence of proposed C - type antiferromagnetic state [47], and instead the presence of A - type antiferromagnetic state in the vicinity of melting of CE - type antiferromagnetic and ferromagnetic phase is observed. This behavior has been predicted theoretically by Pradhan et al. for B site dopants with 3+ valence, where phase separation window lies between charge ordered CE - type and A - type antiferromagnetic phase [48]. Summarizing, our experimental studies show that the charge and orbitally ordered antiferromagnetic state can be significantly destabilized by the induced B - site disorder, leading to variation in favoring of magnetic ground states with different dopants. These include competing long range ordered ferromagnetic metallic or insulating state, short range ordered ferromagnetic phase coexisting with or without the antiferromagnetic state, or a system may enter magnetically frustrated, spin glass like state. In particular, the development of an A - type antiferromagnetic tendencies observed here are driven by the non magnetic substitution (Al or Ga) in the compound. The growth of ferromagnetic phase for low concentration of B - site dopants and its suppression at higher concentration is understood to be a combined effect of defects induced and density driven phenomena.
4 Conclusions
The influence of B - site doping on the crystal and magnetic structure in (B = Fe, Ru, Al and Ga) has been investigated using neutron diffraction, SANS, magnetization and resistivity techniques. The B - site doped samples are isostructural and crystallize in an orthorhombic structure in Pnma space group at 300K. On lowering of temperature, orthorhombic to monoclinic structural transition is observed in compounds exhibiting CE - type antiferromagnetic ordering. This structural transition is absent in other compounds which exhibit A - type antiferromagnetic and ferromagnetic ordering. In 1% Fe doped compound CE - type antiferromagnetic and ferromagnetic ordering is found similar to the x = 0 sample. However, the moment on both and are reduced. With higher Fe doping, CE - type antiferromagnetic state is suppressed at the expense of ferromagnetic insulating phase in compounds. At higher Fe doping in , the ferromagnetic state is also suppressed, no evidence of long range magnetic ordering is found. Contrastively, Ru doping as low as x = 0.01 favors ferromagnetic metallic state at and . With Al substitution in , the charge ordered CE - type antiferromagnetic state is retained, coexisting with ferromagnetic metallic phase. On increasing the Al doping , both CE - type antiferromagnetic and ferromagnetic phases are gradually suppressed and an A - type antiferromagnetic insulating state is stabilized in , which is also suppressed eventually at higher doping. On doping with Al, the charge and orbitally ordered state is retained up to much higher doping level with x = 0.07. Similarly, substitution with Ga is observed to induce similar effects as described for Al doped samples. The contrasting behavior of magnetic Fe and Ru as against non magnetic dopants Al and Ga are evidenced from this study. Doping with Fe and Ru is found result in either ferromagnetic or antiferromagnetic phases. While, doping with Al and Ga results in coexisting ferromagnetic and antiferromagnetic phases.
5 Acknowledgement
One of the authors (AD) gratefully acknowledges Department of Science and Technology (DST), India for financial support to carry out the SANS experiments at PSI, Switzerland.
6 References
References
- [1] Rao C N R and Raveau B 1998 Colossal Magnetoresistance, Charge Ordering, and Related Properties of Manganese Oxides (Singapore: World Scientific)
- [2] Dagotto E, Hotta T and Moreo A 2001 Phys. Rep. 344 1
- [3] Goodenough J B 2003 Handbook on the Physics and Chemistry of Rare Earth, edited by Gschneidner K A, Bunzli Jr. J -C, and Pecharsky V K (Elsevier Science, Amsterdam, Vol. 33)
- [4] Tokura Y 2006 Rep. Prog. Phys. 69 797
- [5] Tendeloo G van, Lebedev O I, Hervieu M and Raveau B 2004 Rep. Prog. Phys. 67 1315
- [6] Rao C N R, Arulraj A, Cheetham A K and Raveau B 2000 J. Phys.: Condens. Matter 12 R83
- [7] Arulraj A, Santhosh P N, Gopalan R S, Guha A, Raychaudhuri A K, Kumar N and Rao C N R 1998 J. Phys.: Condens. Matter 10 8497
- [8] Dhiman I, Das A, Mishra P K and Panicker L 2008 Phys. Rev. B 77 094440
- [9] Dhiman I, Das A and Nigam A K 2009 J. Phys.: Condens. Matter 21 386002
- [10] Akahoshi D, Uchida M, Tomioka Y, Arima T, Matsui Y and Tokura Y 2003 Phys. Rev. Lett. 90 177203
- [11] Tokura Y 2000 Colossal Magnetoresistive Oxides Gordon and Breach, New York
- [12] Salamon M and Jaime M 2001 Rev. Mod. Phys. 73 583
- [13] Dagotto E 2005 Science 309 257
- [14] Hebert S, Maignan A, Martin C and Raveau B 2002 Solid State Commun. 121 229
- [15] Martin C, Maignan A, Hervieu M, Autret C, Raveau B and Khomskii D I 2001 Phys. Rev. B 63 174402
- [16] Schuddinck W, Tendeloo G van, Barnabe A, Hervieu M and Raveau B 1999 J. Solid State Chem. 148 333
- [17] Kang J -S, Kim J H, Sekiyama A, Kasai S, Suga S, Han S W, Kim K H, Choi E J, Kimura T, Muro T, Saitoh Y, Olson C G, Shim J H and Min B I 2003 Phys. Rev. B 68 012410
- [18] Mahendiran R, Maignan A, Hebert S, Martin C, Hervieu M, Raveau B, Mitchell J F and Schiffer P 2002 Phys. Rev. Lett. 89 286602
- [19] Damari L, Pelleg J, Gorodetsky G, Koren C, Markovich V, Shames A, Wu X, Mogilyanski D, Fita I and Wisniewski A 2009 J. Appl. Phys. 106 013913
- [20] Hebert S, Maignan A, Hardy V, Martin C, Hervieu M, Raveau B, Mahendiran R and Schiffer P 2002 Eur. Phys. J. B 29 419
- [21] Garcia-Muï¿œoz J L, Bellido N, Frontera C, Hernï¿œndez-Velasco J, Ritter C, Yaicle C, Martin C and Maignan A 2005 J. Appl. Phys. 97 10H701
- [22] Raveau B, Maignan A and Martin C 1997 J. Solid State Chem. 130 162
- [23] Yaicle C, Frontera C, Garcᅵa-Muᅵoz J L, Martin C, Maignan A, Andrᅵ G, Bourᅵe F, Ritter C and Margiolaki I 2006 Phys. Rev. B 74 144406
- [24] Moritomo Y, Machida A, Nonobe T and Ohoyama K 2002 J. Phys. Soc. Jpn. 71 1626
- [25] Kimura T, Tomioka Y, Kumai R, Okimoto Y and Tokura Y 1999 Phys. Rev. Lett. 83 3940
- [26] Mori S, Shoji R, Yamamoto N, Asaka T, Matsui Y, Machida A, Moritomo Y and Katsufuji T 2003 Phys. Rev. B 67 012403
- [27] Machida A, Moritomo Y, Ohoyama K, Katsufuji T and Nakamura A 2002 Phys. Rev. B 65 064435
- [28] Markovich V, Fita I, Puzniak R, Martin C, Wisniewski A, Yaicle C, Maignan A and Gorodetsky G 2006 Phys. Rev. B 73 224423
- [29] Mahendiran R, Raveau B, Hervieu M, Michel C and Maignan A 2001 Phys. Rev. B 64 064424
- [30] Xu S, Moritomo Y, Machida A, Ohoyama K and Nakamura A 2003 J. Phys. Soc. Jpn. 72 922
- [31] Yan Z B, Dong S, Wang K F, Lu C L, Guo H X and Liu J -M 2008 J. Appl. Phys. 104 013916
- [32] Levy P, Parisi F, Granja L, Indelicato E and Polla G 2002 Phys. Rev. Lett. 89 137001
- [33] Levy P, Granja L, Indelicato E, Vega D, Polla G and Parisi F 2001 J. Magn. Magn. Mater 226 794
- [34] Chen X, Wang Z, Li R, Shen B, Zhan W, Sun J, Chen J and Yan C 2000 J. Appl. Phys. 87 5594
- [35] Ahn K H, Wu X W, Liu K and Chien C L 1997 J. Appl. Phys. 81 5505
- [36] Banerjee A, Mukherjee K, Kumar K and Chaddah P 2006 Phys. Rev. B 74 224445
- [37] Banerjee A, Pramanik A K, Kumar K and Chaddah P 2006 J. Phys. Condens. Matter 18 L605
- [38] Nair S and Banerjee A 2004 J. Phys.: Condens. Matter 16 8335
- [39] Pramanik A K and Banerjee A 2008 J. Phys.: Condens. Matter 20 275207
- [40] Tong W, Tang Y, Liu X and Zhang Y 2003 Phys. Rev. B 68 134435
- [41] Hong B, Li H, Ling L, Tan S, Ying Y, Pi L and Zhang Y 2007 Europhys. Lett. 80 37002
- [42] Martin C, Maignan A, Damay F, Hervieu M, Raveau B, Jirak Z, Andre G and Bouree F 1999 J. Magn. Magn. Mater 202 11
- [43] Frontera C, Beran P, Bellido N, Hernï¿œndez-Velasco J and Garcï¿œa-Muï¿œoz J L 2008 J. Appl. Phys. 103 07F719
- [44] Garcï¿œa-Muï¿œoz J L, Frontera C, Beran P, Bellido N, Hernï¿œndez-Velasco J and Ritter C 2010 Phys. Rev. B 81 014409
- [45] Frontera C, Garcï¿œa-Muï¿œoz J L, Beran P, Bellido N, Margiolaki I and Ritter C 2008 Chem. Mater. 20 3068
- [46] Martinelli A, Ferretti M, Castellano C, Cimberle M R and Ritter C 2008 J. Phys.: Condens. Matter 20 145210
- [47] Chen X, Dong S, Wang K, Liu J -M and Dagotto E 2009 Phys. Rev. B 79 024410
- [48] Pradhan K, Mukherjee A and Majumdar P 2008 Eur. Phys. Lett. 84 37007
- [49] Pradhan K, Mukherjee A and Majumdar P 2007 Phys. Rev. Lett 99 147206
- [50] Frontera C and Garcia-Munoz J L 2008 Europhys. Lett. 84 67011
- [51] Radaelli P G, Cox D E, Marezio M and Cheong S -W 1997 Phys. Rev. B 55 3015
- [52] Radaelli P G, Cox D E, Marezio M, Cheong S - W, Schiffer P E and Ramirez A P 1995 Phys. Rev. Lett. 75 4488
- [53] Rodriguez-Carvajal J 1993 Physica B 192 55
- [54] Strunz P, Mortensen K and Janssen S 2004 Physica B 350 e783
- [55] Van Aken B B, Jurchescu O D, Meetsma A, Tomioka Y, Tokura Y, and Palstra T T M 2003 Phys. Rev. Lett. 90 066403
- [56] Maris G, Volotchaev V and Palstra T T M 2004 New J. Phys. 6 153
- [57] A-site cationic radii for ninefold coordination in oxides were taken from Shannon R D 1976 Acta Crystallogr., Sect. A: Cryst. Phys., Diffr., Theor. Gen. Crystallogr., A32 751
- [58] Goodenough J B 1955 Phys. Rev. 100 564
- [59] Daoud-Aladine A, Rodrï¿œguez-Carvajal J, Pinsard-Gaudart L, Fernï¿œndez-Dï¿œaz M T, and Revcolevschi A 2002 Phys. Rev. Lett. 89 097205
- [60] Wu L, Klie R F, Zhu Y and Jooss Ch 2007 Phys. Rev. B 76 174210
- [61] Herrero-Martin J, Garcï¿œa J, Subï¿œas G, Blasco J and Concepciï¿œn Sï¿œnchez M 2004 Phys. Rev. B 70 024408
- [62] Ahn K H, Lookman T, and Bishop A R 2004 Nature (London) 428 401
- [63] Meneghini C, Levy D, Mobilio S, Ortolani M, Nunez-Reguero M, Kumar A and Sarma D D 2001 Phys. Rev. B 65 012111
- [64] Burgy J, Moreo A and Dagotto E 2004 Phys. Rev. Lett. 92 97202
- [65] Yaicle C, Martin C, Jirak Z, Fauth F, Andre G, Suard E, Maignan A, Hardy V, Retoux R, Hervieu M, Hebert S, Raveau B, Simon Ch, Saurel D, Brulet A and Bouree F 2003 Phys. Rev. B 68 224412
- [66] Hardy V, Hebert S, Maignan A, Martin C, Hervieu M and Raveau B 2003 J. Magn. and Magn. Mater. 264 183
- [67] Hardy V, Yaicle C, Hebert S, Maignan A, Martin C, Hervieu M and Raveau B 2003 J. Appl. Phys. 94 5316
- [68] Khomskii D and Khomskii L 2003 Phys. Rev. B 67 052406
- [69] Ying Y, Fan J, Pi L, Qu Z, Wang W, Hong B, Tan S, and Zhang Y 2006 Phys. Rev. B 74 144433
- [70] Saber M M, Egilmez M, Mansour A I, Fan I, Chow K H and Jung J 2010 Phys. Rev. B 82 172401
- [71] Hwang H Y, Cheong S -W, Radaelli P G, Marezio M and Batlogg B 1995 Phys. Rev. Lett. 75 914
- [72] Mydosh J A 1996 Spin Glasses: An Experimental Introduction Taylor & Francis, Washington 102
- [73] Dagotto E 2005 New J. Phys. 7 67
- [74] Wollan E O and Kohler W C 1955 Phys. Rev. 100 545
- [75] Kawano H, Kajimoto R, Yoshizawa H, Tomioka Y, Kuwahara H, and Tokura Y 1997 Phys. Rev. Lett. 78 4253
- [76] Ritter C, Mahendiran R, Ibarra M R, Morellon L, Magnan A, Raveau B, and Rao C N R 2000 Phys. Rev. B 61 R9229
- [77] Porod G 1983 in Small Angle X-ray Scattering, edited by Glatter O and Kratky O Academic Press, London, p. 35
- [78] Saurel D, Simon Ch, Brï¿œlet A, Heinemann A and Martin C 2007 Phys. Rev. B 75 184442
- [79] Saurel D, Simon Ch, Pautrat A, Martin C, Dewhurst Ch, and Brï¿œlet A 2010 Phys. Rev. B 82 054427
- [80] Simon Ch, Mercone S, Guiblin N, Martin C, Brᅵlet A, and Andrᅵ G 2002 Phys. Rev. Lett. 89 207202
- [81] Dhiman I, Das A, Mittal R, Su Y, Kumar A and Radulescu A 2010 Phys. Rev. B 81 104423
- [82] Ogale S B, Shreekala R, Bathe R, Date S K, Patil S I, Hannoyer B, Petit F and Marest G 1998 Phys. Rev. B 57 7841
- [83] Leung L K, Morrish A H and Evans B J 1976 Phys. Rev. B 13 4069
- [84] Simopoulos A, Pissas M, Kallias G, Devlin E, Moutis N, Panagiotopoulos I, Niarchos D, Christides C and Sonntag R 1999 Phys. Rev. B 59 1263
- [85] Markovich V, Rozenberg E, Gorodetsky G, Martin C, Maignan A, Hervieu M and Raveau B 2001 Phys. Rev. B 64 224410
- [86] Markovich V, Fita I, Puzniak R, Rozenberg E, Wisniewski A, Martin C, Maignan A, Hervieu M, Raveau B and Gorodetsky G 2002 Phys. Rev. B 65 224415
- [87] Kim J S, Kim D C, McIntosh G C, Chu S W, Park Y W, Kim B J, Kim Y C, Maignan A and Raveau B 2002 Phys. Rev. B 66 224427
- [88] Lu C L, Chen X, Dong S, Wang K F, Cai H L and Liu J -M 2009 Phys. Rev. B 79 245109