Photothermal Single Particle Microscopy: Detection of a Nanolens.
Photothermal microscopy Boyer2002 ; Lounis2004 ; Lounis2005 ; Orrit2010Science has recently complemented single molecule fluorescence microscopy by the detection of individual nano-objects in absorption. Photothermal techniques gain their superior sensitivity by exploiting a heat induced refractive index change around the absorbing nano-object. Numerous new applications to nanoparticles, nanorods and even single molecules Hartland2010 ; Berciaud2008 ; Rings2010PRL ; Waehnert2009 ; Lounis2009PhoCS ; Raduenz2009 have been reported all refering to the fact that photothermal microscopy is an extinction measurement on a heat induced refractive index profile. Here, we show that the actual physical mechanism generating a photothermal signal from a single molecule/particle is fundamentally different from the assumed extinction measurement Gaiduk2010 ; Berciaud2006 . Combining photothermal microscopy, light scattering microscopy as well as accurate Mie scattering calculations to single gold nanoparticles, we reveal that the detection mechanism is quantitatively explained by a nanolensing effect of the long range refractive index profile. Our results lay the foundation for future developments and quantitative applications of single molecule absorption microscopy.
Long range interactions play a very special role in physics. Fundamental forces such as the Coulomb force or gravitation are attributed to interaction potentials with inverse distance dependencies manifesting their action even at macroscopic length scales. In this paper we explore the action of another long-ranged field interacting with photons, namely the refractive index profile generated in the solvent surrounding a suspended nanoparticle that releases heat. A typical practical situation is provided by a gold nanoparticle in the focus of a laser beam. Most of the absorbed optical energy is released as heat to the solvent. This creates a temperature field which decays with the inverse distance from the absorber according to
| (1) |
where the temperature rise at the particle surface is resulting from the absorbed optical power , the surroundings’ heat conductivity and the particle radius . A corresponding refractive-index profile is thereby established, modifying the unperturbed refractive index of the solvent by (eqn. 2):
| (2) |
This infinite hot lens can be exploited to detect even a minute absorber with a probe laser in an optical microscopy setup with extremely high sensitivityOrrit2010Science . However, the infinite size of the lens and the complex spatial structure of the tightly focused, aberrated laser beams cause some conceptual and computational challenges for a quantitative understanding of the signal generationBerciaud2006 . These are addressed below, where we develop a consistent mathematical formalism to quantitatively explain and analyze such ”absorption microscopy” experiments in great detail.
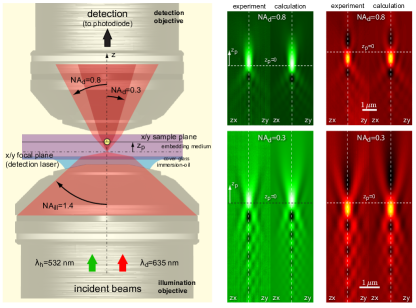
The complexity of the signal generation can already be appreciated when both involved lasers (heating and probe) scatter from a single gold nanoparticle at low incident power, where the heating is still negligibly small (see methods section for experimental details). The transmitted intensity collected by a lens reveals strong interference patterns as it senses the field structure of the aberrated incident laser beams (Fig. 1, right). Recording these scattering intensities at different detection numerical apertures emphasizes the importance of the phase relation of scattered and transmitted electric fields Selmke_elsewhere .
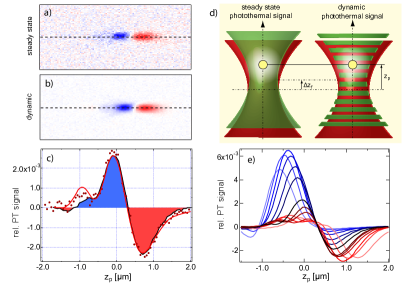
The interference patterns largely vanish when considering the photothermal signal, which is the difference in the probe laser scattering signal of a heated nanoparticle including the long range refractive index profile and a non-heated particle without the refractive index change. This scattering difference has been evaluated under steady state conditions recording two scattering images as well as dynamically using the photothermal heterodyne technique Berciaud2006 for an axial focus displacement of both lasers of (see Fig. 2 a and b). Despite the much lower signal to noise ratio of the steady state difference, both signals agree perfectly and reveal a two-lobe structure (Fig. 2 c). The simplicity of this two-lobe structure suggests a much simpler mechanism than the complex aberrated spatial heating and probe laser scattering intensity distributions put forward. It also unveils that the common assumption of a product point spread function of heating and detection laser is not appropriate. Instead, the two-lobe structure depends sensitively on the displacement of the two laser foci. Whenever the probe laser focus is in front of the refractive index gradient, the detected intensity is decreased, while an increased signal is measured when the probe laser focus is behind the refractive index gradient, as indicated in Figure 2 e. This is exactly the action of a diverging lens. While it is in general tempting to consider the refractive index profile as a finite sized scatterer which has to be treated by an appropriate scattering theory, we infer that the missing characteristic length scale of refractive index profile is the source of this intuitive lens-like action. As most materials lower their refractive index with increasing temperature (), the temperature field induces a diverging lens with radial symmetry. In fact a more detailed analysis reveals that the problem is equivalent to Rutherford scattering of -particles on a Coulomb potential in which case a classical mechanics treatment of the -particle delivers the same result as a quantum mechanical treatment of the particle Baryshevskii2004 . While we will detail this fundamental equivalence in a separate paper PhotonicRutherford2011 , we will stress a complex scattering description to demonstrate that an exact electromagnetic treatment is providing the same picture of a gradient index nanolens.
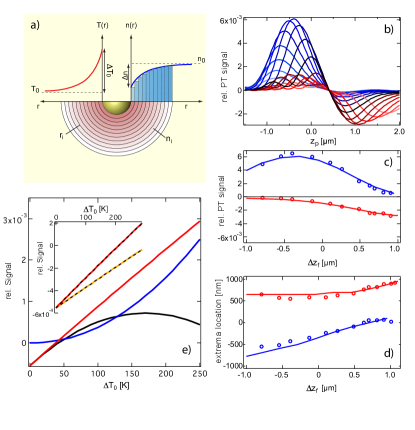
This theoretical scattering description has to go beyond common Mie theory as photothermal microscopy employs highly focused laser beams instead of plane waves. Thus a more rigorous Mie description (Generalized Lorenz-Mie Theory, GLMT Gouesbet1995 ) has been extended to account for the axial structure of the signal and to accurately model aberration effects in the focused laser beams Neves2007 ; Nasse2010 interacting with the metal particle and the refractive index gradient. The latter one is introduced in a multiple shell approach discretizing the refractive index profile as described by Peña et al. Pena2009 (see Fig. 3 a). The detection aperture has been introduced into the GLMT formalism calculating the time-averaged Poynting vector integrated over an area representing an angular detection domain which is determined by the detection aperture (eqn. 3).
| (3) |
Incorporating all experimental and material parameters (see method and supplement) to evaluate the pure gold nanoparticle scattering, an unprecedented quantitative agreement with the experimental results is unveiled (see Fig. 1). To our knowledge, this is the first quantitative exact calculation of single gold nanoparticle scattering intensity distributions. The calculated scattering images are largely determined by aberrations of the incident laser fields and additional interference structures. The maximum detected scattering intensity and true focus position do not coincide and strongly depend on wavelength. The spatially extended intensity distribution causes the peak intensity to be much lower than for a Gaussian beam having a beam-waist of the corresponding diffraction limit (). Thus, as compared to such a Gaussian beam only one third of the particle temperature is reached.
The amplitude of the aberration induced interference pattern is determined by the numerical aperture of the detection lens as found in the experiment. The larger this detection aperture, the weaker the interference patterns get as the individual phase differences at different detection angles average out (Fig. 1 right). This finding confirms that the plane-wave optical theorem is not applicable when collecting signals at finite detection angle and focused illumination Gouesbet1996opttheorem . The only way to conclude on the intensity distribution details in the scattering experiment is thus to consider the finite detection angle. While this complex structure determines the shape of the scattering intensity distribution, a contribution to the photothermal signal is also expected Jurgensen1995 ; Bialcowski1996 but less obvious.
We evaluate the photothermal signal as the difference between the probe scattering intensity distribution of particle with the refractive index profile and the distribution without the profile, completely equivalent to the above presented experiments. Accordingly, the theoretical model directly confirms the experimental observations quantitatively. Almost all of the interference structure disappears due to the difference of the two aberrated signals. A two lobe structure is remaining, which exactly corresponds to the experimental observations (Fig. 2 c). Even the strong dependence of the total signal on the displacement of the two involved laser foci is reproduced validating our theoretical approach (Fig. 3 b). Thus the exact treatment of the signal by a generalized Mie scattering calculation predicts a lens-like action of the refractive index gradient as well. It demonstrates that a quantitative analysis of photothermal microscopy data in terms of temperatures, absorption cross sections and even in terms of the sign of the thermorefractive coefficient is possible. This puts photothermal microscopy to a new quantitative level.
The fundamental difference between the commonly assumed extinction process and the mechanism reported here becomes obvious when separating the individual contributions to the signal as done for instance by Gaiduk Gaiduk2010 . The interaction of a probing field with the heat induced scatterer is commonly solved through the introduction of an outgoing spherical wave . The detected power then mathematically decomposes, upon inserting (and ) into eqn. 3, into three separate integrals Berg2008 for probe background , scattering and extinction powers containing only the probing field , the scattered field and both in mixed terms, respectively. So far, it has been commonly assumed that solely the latter extinction part contributes to the photothermal signal Berciaud2006 . This assumption does not hold, independent of the actual gold nanoparticle size thus being valid for single molecule detection as well. A separation of scattering and interference contribution in our theory shows that both parts change in a nonlinear fashion when increasing the temperature of the nanoparticle (see Fig. 3 e). While up to a temperature rise of about 50 K the interference contribution determines the signal, the importance of the scattering contribution rises quickly. It is the consequence of the inverse distance dependence of the refractive index change, which removes the characteristic length scale from the profile and thus requires a detailed theoretical analysis. This actually becomes obvious when considering a gold particle surrounded by an artificial refractive index profile which decays exponentially or with the inverse distance squared. In both cases, the finite length scale of such a refractive index profile ensures a leading contribution coming from the interference term (Fig. 3 e inset) increasing linearly with the temperature rise of the particle.
Therefore, the missing length scale of the refractive index change is responsible for both scattering and interference contributions to the signal, which have to be treated explicitly to understand the signal generation mechanism. The overall quality of our theoretical and experimental results is best seen in Figure 3 c and d, plotting the maximum and minimum photothermal signal values as well as their positions as a function of the axial focus displacement . They show an unprecedented agreement of experiment (markers) and theory (lines) without the inclusion of fitting parameters. From the above consideration of different refractive index profiles it is evident, that a calibration of the photothermal signal for the measurement of absorption cross-sections on arbitrarily shaped objects of sizes comparable to the lateral focus-extent (e.g. single-walled carbon-nanotubes Berciaud2008 ; Hartland2010 ) will fail as the general contribution of scattering and interference will change. In the case of point-like absorbers, however, there is a quantitative simplification of the generalized Mie theory applied here. In fact the lens-like action can be treated in a geometrical optics framework due to its fundamental mathematical equivalence to Rutherford scattering as we will show elsewherePhotonicRutherford2011 .
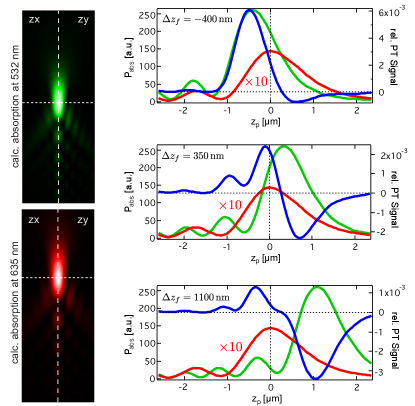
Finally, the contribution of aberrations to the photothermal signal can be rationalized. The photothermal signal generated by a non-aberrated probe beam is vanishing if the particle is in the focus of the probe laser. This behavior is expected for a simple lens. The aberrated probe beam, however, leads to a finite signal at the particle position. This can be understood in terms of a lens-like action as well. While a non-aberrated intensity distribution shows a zero crossing of the signal at the particle position (not shown), the aberrated probe beam leads to a finite signal at the particle position. While a non-aberrated beam is symmetric to the lens if directly focused to the center of the lens, the aberrated beam is not (Fig. 4, left). The additional interference maxima act like additional foci displaced with respect to the photothermal lens position and thus cause a photothermal signal. As a consequence, the displacement of particle fluorescence excited by the heating laser and photothermal signal will depend on the aberration of the probe beam and not simply on the Gouy phase Hwang2007 . We have calculated three limiting cases, where either the positive lobe or the negative lobe is maximum or both lobes show the same photothermal signal magnitude (Fig. 4, right). In the first case, photothermal signal maximum and fluorescence signal maximum would be displaced by about 100 nm (top). In the second case, the fluorescence signal is almost exactly at the position of the photothermal signal minimum (center) while in the last case the zero-crossing of the photothermal signal coincides with the fluorescence maximum (bottom). Therefore the commonly found displacements of fluorescence and photothermal signal Hartland2010 ; Orrit2010PCCP in axial direction can be well explained by the presented theoretical approach.
In summary, our results demonstrate that the long range refractive index change generated by a single heated nano-object in photothermal microscopy act as a nano lens. The understanding of this signal generation mechanism establishes photothermal microscopy as a quantitative technique to determine absolute absorption cross sections and delivers a framework for new applications of this technique. As a direct consequence, new experimental techniques such as twin-focus photothermal correlation spectroscopy similar to the well established dual focus fluorescence correlation techniques Dertinger2007 or super-resolution absorption microscopy methods can be developed. We expect that the understanding of the photothermal signal generation will pave the way for further improvements of this technique beyond the current level of sensitivity.
.1 Sample preparation.
Samples were prepared by spin-coating a polymer layer (Sylgard 184, about thickness) on top of a glass-cover slide. AuNPs (BBI International) with a diameter of were deposited on the polymer film. The particles were covered with a second Sylgard layer (also about thick) to embed the particles in a homogeneous matrix. The absence of a close-by interface ensures a radially symmetric temperature field around the particle.
.2 Photothermal microscopy measurements.
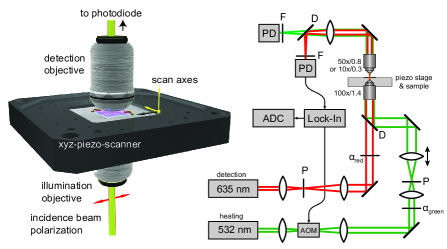
The experimental setup for single particle light scattering and photothermal measurements is based on a home-built confocal sample-scanning microscopy setup using two laser sources. A DPSS laser (Coherent, Verdi) with is used to heat the gold particles and a second laser source at (Coherent ULN laser diode) probes the local refractive index changes. Both beams are focused into the sample by the same objective lens (Olympus 100x/1.4NA) and are collected above the sample by a second objective (Zeiss 10x/0.3NA or Olympus 50x/0.8NA), which is adjusted to image the probe focus to infinity. The sample is moved by a piezo-scanner (PI). The resulting parallel beam is focused onto two photodiodes (Thorlabs, PDA36A-EC) after passing appropriate filters (no pinhole). To allow for a low noise detection of the photothermal signal, the heating beam is modulated with a frequency and the probe signal change is detected at this reference frequency with a lock-in amplifier (Signal Recovery 7280 DSP) with a time constant of ms. The resulting lock-in signal is recorded by a A/D converter (Adwin-Gold, Jäger Messtechnik) 300 times for each recorded pixel (1ms/pixel). The relative photothermal signal corresponds to the relative modulation amplitude at the photodiode
| (4) |
.3 Single particle light scattering measurements.
Single particle light scattering has been carried out in the same setup as the photothermal measurements. To do so, the intensity of heating and probe laser have been diminished that no notable effects of varying incident laser power can be found in the experiments. The laser intensities of both wavelength were recorded independently with two photodiodes (Thorlabs, PDA36A-EC) without intensity modulation and lock-in detection. All scattering signals have been normalized to the background intensity.
.4 Mie scattering calculations.
Mie scattering calculations were carried out with a modified C-code. The multishell scatter coefficients and were provided by ref. Pena2009 , and are referred to in the supplemented material as and . The modifications include the numerical evaluation of beam shape coefficients (supplement) as well as the integration of the Poynting-vector across a finite azimuthal collection-angle range (supplement eqn. 5-8). The C-code was then interfaced to WaveMetrics Igor Pro 6.06 to create the scans and images.
.5 Parameters used for the calculations in Figure 1
The following parameters were used for the calculation of the imaging (subscript d and h denote detection and heating parameters, see supplement for notation): Particle parameters: , and Johnson1972 . Beam and objective parameters: Detection laser: W, , heating laser: W, , effective illumination objective focal length mm, overfilling factors and . Sample parameters: refractive indices: , , , , , , , , , , or . Discretization parameters: number of angles for numerical angular signal integration: , number of layers for multi-shell scatter-coefficients and : , layer spacing: with and . Number of angles for the beam shape coefficients: , , given by scattnlay.
The bottom row of the Fig. 4 shows maps of the absorbed power . In case of a point-absorber these maps corresponds to the point-spread-functions (PSFs). These maps yield the following effective gaussian parameters: nm, nm, nm, nm.
.6 Temperatures and Cross-Sections from the calculations for Figure 2
The power measured with the power-meter and converted to peak-to-peak power was (see supplement). The power-meter aperture was the same as the microscope objective back-aperture, i.e. . The Gaussian GLMT calculation gives: . With the expressions for and (see supplement) we find: , , . The absorption-cross-section was found to be which is close to the Mie-cross section (): . The exact calculation yields which is obtained with and (see supplement). , , .
References
- (1) Boyer, D., Tamarat, P., Maali, A., Lounis, B. & Orrit, M. Photothermal imaging of nanometer-sized metal particles among scatterers. Science 297, 1160–3 (2002).
- (2) Berciaud, S., Cognet, L., Blab, G. & Lounis, B. Photothermal heterodyne imaging of individual nonfluorescent nanoclusters and nanocrystals. Phys. Rev. Lett. 93, 257402 (2004).
- (3) Berciaud, S., Cognet, L. & Lounis, B. Photothermal absorption spectroscopy of individual semiconductor nanocrystals. Nano Lett. 5, 2160–3 (2005).
- (4) Gaiduk, A., Yorulmaz, M., Ruijgrok, P. V. & Orrit, M. Room-temperature detection of a single molecule’s absorption by photothermal contrast. Science 330, 353–356 (2010).
- (5) Giblin, J., Syed, M., Banning, M. T., Kuno, M. & Hartland, G. Experimental determination of single CdSe nanowire absorption cross sections through photothermal imaging. ACS Nano 4, 358–364 (2010).
- (6) Berciaud, S., Cognet, L. & Lounis, B. Luminescence decay and the absorption cross section of individual single-walled carbon nanotubes. Phys. Rev. Lett. 101, 077402-1–077402-4 (2008).
- (7) Rings, D., Schachoff, R., Selmke, M., Cichos, F. & Kroy, K. Hot Brownian motion. Phys. Rev. Lett. 105, 090604-1-090604-4 (2010).
- (8) Wähnert, M., Radünz, R. & Cichos, F. Nanoscale distance fluctuations probed by photothermal correlation spectroscopy. Proc. SPIE 7185, 71850V (2009).
- (9) Octeau, V., Cognet, L. et al. Photothermal absorption correlation spectroscopy. ACS Nano 3, 345–350 (2009).
- (10) Radünz, R., Rings, D., Kroy, K. & Cichos, F. Hot Brownian particles and photothermal correlation spectroscopy. J. Phys. Chem. A (2009).
- (11) Gaiduk, A., Ruijgrok, P. V., Yorulmaz, M. & Orrit, M. Detection limits in photothermal microscopy. Chem. Sci. 1, 343–350 (2010).
- (12) Berciaud, S., Lasne, D., Blab, G., Cognet, L. & Lounis, B. Photothermal heterodyne imaging of individual metallic nanoparticles: Theory versus experiment. Phys. Rev. B 73, 045424 (2006).
- (13) Selmke, M., Braun, M. & Cichos, F. in preparation N.N. (2011).
- (14) Selmke, M., Braun, M. & Cichos, F. Photonic Rutherford scattering. in preparation (2011).
- (15) Neves, A. A. R. et al. Axial optical trapping efficiency through a dielectric interface. Phys. Rev. E 76, 061917-1-061917-8 (2007).
- (16) Nasse, M. J. & Woehl, J. C. Realistic modeling of the illumination point spread function in confocal scanning optical microscopy. J. Opt. Soc. Am. A 27, 295–302 (2010).
- (17) Pena, O. & Pal, U. Scattering of electromagnetic radiation by a multilayered sphere. Comput. Phys. Commun. 180, 2348–2354 (2009).
- (18) Gouesbet, G., Letellier, C., Grehan, G. & Hodges, J. T. Generalized optical theorem for on-axis Gaussian beams. Opt. Commun. 125, 137–157 (1996).
- (19) Jurgensen, F. & Schroer, W. Studies on the diffraction image of a thermal lens. Appl. Opt. 34, 41–50 (1995).
- (20) Bialkowski, S. E. Photothermal Spectroscopy Methods for Chemical Analysis (John Wiley and Sons, Inc., 1996).
- (21) Hwang, J. & Moerner, W. E. Interferometry of a single nanoparticle using the Gouy phase of a focused laser beam. Opt. Commun. 280, 487–491 (2007).
- (22) Gaiduk, A., Ruijgrok, P. V., Yorulmaz, M. & Orrit, M. Making gold nanoparticles fluorescent for simultaneous absorption and fluorescence detection on the single particle level. Phys. Chem. Chem. Phys. (2010).
- (23) Berg, M. J., Sorensen, C. M. & Chakrabarti, A. Extinction and the optical theorem. part i. single particles. J. Opt. Soc. Am. A 25, 1504–1513 (2008).
- (24) Gouesbet, G., Grehan, G. & Maheu, B. Scattering of a Gaussian-beam by a Mie scatter center using a Bromwich formalism. J. Optics-Nouvelle Rev. D Opt. 16, 83–93 (1985).
- (25) Johnson, P. B. & Christy, R. W. Optical constants of the noble metals. Phys. Rev. B 6, 4370–4379 (1972).
- (26) Baryshevskii, V. G., Feranchuk, I. D. & Kats, P. B. Regularization of the coulomb scattering problem. Phys. Rev. A 70, 052701-1–052701-15 (2004).
- (27) Dertinger, T. et al. Two-focus fluorescence correlation spectroscopy: A new tool for accurate and absolute diffusion measurements. Chem. Phys. Chem. 8, 433–443 (2007).