The Survey of HI in Extremely Low-mass Dwarfs (SHIELD)
Abstract
We present first results from the Survey of HI in Extremely Low-mass Dwarfs (SHIELD), a multi-configuration EVLA study of the neutral gas contents and dynamics of galaxies with HI masses in the 106-107 M⊙ range detected by the Arecibo Legacy Fast ALFA (ALFALFA) survey. We describe the survey motivation and concept demonstration using VLA imaging of 6 low-mass galaxies detected in early ALFALFA data products. We then describe the primary scientific goals of SHIELD and present preliminary EVLA and WIYN 3.5m imaging of the 12 SHIELD galaxies. With only a few exceptions, the neutral gas distributions of these extremely low-mass galaxies are centrally concentrated. In only 1 system have we detected HI column densities higher than 1021 cm-2. Despite this, the stellar populations of all of these systems are dominated by blue stars. Further, we find ongoing star formation as traced by H emission in 10 of the 11 galaxies with H imaging obtained to date. Taken together these results suggest that extremely low-mass galaxies are forming stars in conditions different from those found in more massive systems. While detailed dynamical analysis requires the completion of data acquisition, the most well-resolved system is amenable to meaningful position-velocity analysis. For AGC 749237, we find well-ordered rotation of 30 km s-1 at distance from the dynamical center. At the adopted distance of 3.2 Mpc, this implies the presence of a 1 108 M⊙ dark matter halo and a baryon fraction 0.1.
Subject headings:
galaxies: evolution — galaxies: dwarf — galaxies: irregular1. Populating the Cosmologically Important Faint End of the HI Mass Function: ALFALFA
One of the major accomplishments of the Arecibo Legacy Fast ALFA (ALFALFA) survey (Giovanelli et al., 2005) is the detection of hundreds of galaxies with HI masses 108 M⊙. As its design intended, ALFALFA provides the first statistically robust sampling of the faint end of the HI mass function (MHI 108 M⊙; Martin et al., 2010). The sensitivity and resolution of ALFALFA have now produced a collection of dozens of galaxies outside the Local Group with HI masses below 107 M⊙. Each of these objects has been cross-correlated with optical catalogs; these extremely low-mass dwarfs are among the lowest-mass, gas-bearing systems that harbor detectable stellar populations in the local universe.
Over the past few decades, the kinematics and stellar populations of dwarf galaxies have been explored in detail, both in targeted investigations and in dedicated surveys. These studies have focused largely (though not exclusively) on systems that populate the HI mass function above 108 M⊙. Three prominent surveys to this end are the LITTLE THINGS (Hunter et al., 2007), FIGGS (Begum et al., 2008), and VLA-ANGST (Ott et al., 2010) programs. While the selection and sample criteria vary from one program to the next (including some overlap), we note that the median HI masses are 8.5 107 M⊙, 2.7 107 M⊙, and 2.3 107 M⊙ for LITTLE THINGS, FIGGS, and VLA-ANGST, respectively. These surveys have revealed many new insights into low-mass galaxies, including the characteristics of 21 systems (4, 8, and 9 in LITTLE THINGS, FIGGS, and VLA-ANGST, respectively) with M107 M⊙.
| AGCaaArecibo General Calalog | Distance | Mr | (ur) | MB | (BV) | %Z⊙bbAssuming the Solar oxygen abundance From Asplund et al. (2009). | V21 | W21 | log(MHI) | ||
|---|---|---|---|---|---|---|---|---|---|---|---|
| # | (J2000) | (J2000) | (Mpc) | (mag) | (mag) | (mag) | (mag) | (km s-1) | (km s-1) | (M⊙) | |
| Concept Demonstration Targets | |||||||||||
| 100062 | 00:09:52.8 | 15:43:58 | 12.7ccDerived using the parametric multiattractor flow model developed by Masters (2005); see further discussion in Martin et al. (2010). | 15.02 | 1.020.02 | N/A | N/A | N/A | 869 | 45 | 7.82 |
| 101772 | 00:11:08.2 | 14:14:08 | 11.7ccDerived using the parametric multiattractor flow model developed by Masters (2005); see further discussion in Martin et al. (2010). | 13.64 | 0.980.06 | N/A | N/A | N/A | 802 | 37 | 7.54 |
| 111945 | 01:44:42.7 | 27:17:18 | 6.3ccDerived using the parametric multiattractor flow model developed by Masters (2005); see further discussion in Martin et al. (2010). | 11.88ddMagnitudes and colors uncertain due to SDSS shredding issues. | 3.351.26ddMagnitudes and colors uncertain due to SDSS shredding issues. | N/A | N/A | N/A | 420 | 38 | 7.28 |
| 321203 | 22:13:03.3 | 28:04:28 | 16.4ccDerived using the parametric multiattractor flow model developed by Masters (2005); see further discussion in Martin et al. (2010). | 14.20 | 0.980.04 | N/A | N/A | 14% | 983 | 62 | 7.83 |
| 321307 | 22:14:04.4 | 25:41:08 | 18.7ccDerived using the parametric multiattractor flow model developed by Masters (2005); see further discussion in Martin et al. (2010). | 13.88 | 1.240.07 | N/A | N/A | N/A | 1152 | 60 | 7.96 |
| 332939 | 23:08:16.0 | 31:53:57 | 11.4ccDerived using the parametric multiattractor flow model developed by Masters (2005); see further discussion in Martin et al. (2010). | 13.67 | 0.690.05 | N/A | N/A | N/A | 692 | 41 | 7.74 |
| The SHIELD Sample | |||||||||||
| 748778eeWIYN 3.5m imaging acquired in Fall 2010. | 00:06:34.3 | 15:30:39 | 5.4ccDerived using the parametric multiattractor flow model developed by Masters (2005); see further discussion in Martin et al. (2010). | 10.52 | 0.810.19 | 10.02 | 0.250.03 | N/A | 258 | 16 | 6.51 |
| 112521eeWIYN 3.5m imaging acquired in Fall 2010. | 01:41:07.6 | 27:19:24 | 7.2ffProbable member of NGC 672 group. | 11.52ddMagnitudes and colors uncertain due to SDSS shredding issues. | 2.190.42ddMagnitudes and colors uncertain due to SDSS shredding issues. | 10.80 | 0.450.03 | 6% | 274 | 26 | 6.92 |
| 110482eeWIYN 3.5m imaging acquired in Fall 2010. | 01:42:17.4 | 26:22:00 | 7.2ffProbable member of NGC 672 group. | 13.63 | 1.250.04 | 12.86 | 0.490.02 | 13% | 357 | 30 | 7.21 |
| 111946eeWIYN 3.5m imaging acquired in Fall 2010. | 01:46:42.2 | 26:48:05 | 7.2ffProbable member of NGC 672 group. | 11.49ddMagnitudes and colors uncertain due to SDSS shredding issues. | 1.460.25ddMagnitudes and colors uncertain due to SDSS shredding issues. | 11.48 | 0.390.03 | 5% | 367 | 21 | 6.97 |
| 111977eeWIYN 3.5m imaging acquired in Fall 2010. | 01:55:20.2 | 27:57:14 | 5.5ggTip of the red giant branch. | 12.55ddMagnitudes and colors uncertain due to SDSS shredding issues. | 2.260.16ddMagnitudes and colors uncertain due to SDSS shredding issues. | 12.31 | 0.470.02 | N/A | 207 | 26 | 6.78 |
| 111164eeWIYN 3.5m imaging acquired in Fall 2010. | 02:00:10.1 | 28:49:52 | 4.9ggTip of the red giant branch. | 11.50ddMagnitudes and colors uncertain due to SDSS shredding issues. | 0.800.09ddMagnitudes and colors uncertain due to SDSS shredding issues. | 11.10 | 0.410.02 | N/A | 163 | 27 | 6.57 |
| 174585h,ih,ifootnotemark: | 07:36:10.3 | 09:59:11 | 6.1ccDerived using the parametric multiattractor flow model developed by Masters (2005); see further discussion in Martin et al. (2010). | N/A | N/A | N/A | N/A | N/A | 356 | 21 | 6.68 |
| 174605hhWIYN 3.5m imaging acquired in Spring 2011. | 07:50:21.7 | 07:47:40 | 6.0ccDerived using the parametric multiattractor flow model developed by Masters (2005); see further discussion in Martin et al. (2010). | 10.46ddMagnitudes and colors uncertain due to SDSS shredding issues. | 1.850.21ddMagnitudes and colors uncertain due to SDSS shredding issues. | 10.98 | 0.470.05 | N/A | 351 | 24 | 6.75 |
| 182595hhWIYN 3.5m imaging acquired in Spring 2011. | 08:51:12.1 | 27:52:48 | 6.1ccDerived using the parametric multiattractor flow model developed by Masters (2005); see further discussion in Martin et al. (2010). | 12.45 | 1.270.05 | 11.75 | 0.520.05 | N/A | 398 | 20 | 6.66 |
| 731457hhWIYN 3.5m imaging acquired in Spring 2011. | 10:31:55.8 | 28:01:33 | 5.4ccDerived using the parametric multiattractor flow model developed by Masters (2005); see further discussion in Martin et al. (2010). | 12.55 | 1.230.03 | 12.02 | 0.390.05 | N/A | 454 | 36 | 6.63 |
| 749237hhWIYN 3.5m imaging acquired in Spring 2011. | 12:26:23.4 | 27:44:44 | 3.2ccDerived using the parametric multiattractor flow model developed by Masters (2005); see further discussion in Martin et al. (2010). | 11.58 | 1.280.03 | 11.21 | 0.440.05 | N/A | 372 | 65 | 6.64 |
| 749241hhWIYN 3.5m imaging acquired in Spring 2011. | 12:40:01.7 | 26:19:19 | 4.3ccDerived using the parametric multiattractor flow model developed by Masters (2005); see further discussion in Martin et al. (2010). | 9.27 | 0.830.15 | 9.57 | 0.220.05 | N/A | 451 | 18 | 6.52 |
The existence of such gas-rich galaxies with very shallow potential wells poses interesting puzzles for the CDM paradigm. Ram pressure should easily strip their ISM via encounters with coronal gas if they venture within the virial radius of nearby giant galaxies or clusters (e.g., Lewis et al., 2002; Grebel et al., 2003). Star formation (SF) activates feedback mechanisms that result in gas loss via superwinds; simulations have predicted that galaxies with gas masses M107 M⊙ are highly susceptible to mass loss via starburst-driven superwinds (e.g., Mac Low & Ferrara, 1999; Ferrara & Tolstoy, 2000), and observational results support this scenario (e.g., Martin et al., 2002; Ott et al., 2005). The metagalactic UV radiation field inhibits gas accretion and cooling most severely in low-mass halos (Rees, 1986; Babul & Rees, 1992; Benson et al., 2002; Hoeft et al., 2006). A hot IGM should vaporize a small, unshielded cold gas mass within less than a Hubble time (Benson et al., 2002). And yet, despite these myriad destruction mechanisms, objects such as Leo T (MHI 105 M⊙, SF within the last few hundred Myr; Irwin et al. 2007) exist. The survival of such systems seems to depend on both the protection provided by a shielding envelope of warm, ionized gas (Sternberg et al., 2002), and on environment i.e., they are found in locations removed from the immediate vicinity of dense coronal gas. For halo masses below M⊙, the baryon fraction () of dwarf systems is predicted to fall below the cosmic value of 0.16 (Hoeft et al., 2006; McGaugh et al., 2010). Most of the remaining baryons within a given system are in the form of a warm, ionized phase that is difficult to detect. In the central regions of these halos, a small fraction of the gas is predicted to be neutral and thus capable of condensing into stars.
The extremely low-mass galaxies observed in the local universe by ALFALFA have not been detected in large enough numbers to solve the “missing satellite problem” (Klypin et al., 1999). However, these systems are nonetheless critical for models of cosmological structure formation for two primary reasons. First, an understanding of their characteristics as the survivors of the structure formation process provides constraints on the aforementioned destruction mechanisms acting on low-mass halos. Second, these systems bridge the observational gap between the well-studied and comparatively high-mass (107 M⊙ MHI 109 M⊙) dwarfs of the local universe and the extremely low-mass ultra-faint dwarf companions of the Milky Way (e.g., Willman 1, with M5 105 M⊙; Willman et al. 2005; Martin et al. 2007). To probe this transition, we have thus undertaken a multiwavelength study of very low-mass (MHI 107 M⊙) dwarfs across the range of halo masses over which the transition from to takes place (see Hoeft et al., 2006; McGaugh et al., 2010). This Letter presents first results from optical and radio imaging of extremely low-mass galaxies that form part of this observing campaign.
2. Exploring the Faint End of the HI Mass Function: SHIELD
The measurement of the total halo masses of the extremely low-mass galaxies detected by ALFALFA requires deep, high spatial and spectral resolution HI observations in order to characterize the systems’ rotation curves. This measurement is the primary motivation for The Survey of HI in Extremely Low-mass Dwarfs (SHIELD). We now describe the strategy, goals, and present status of SHIELD.
Our investigation began with a series of concept demonstration observations of 6 low-mass systems detected in early ALFALFA observations (see “Concept Demonstration Targets” in Table 1). These systems were observed with the Very Large Array111The National Radio Astronomy Observatory (NRAO) is a facility of the National Science Foundation operated under cooperative agreement by Associated Universities, Inc. (VLA) for programs AC963 (PI Cannon) and AS883 (PI Saintonge) during the VLA EVLA transition. The data reduction and imaging were performed wtih the Astronomical Image Processing System (AIPS222The Astronomical Image Processing System (AIPS) has been developed by the NRAO.); reductions proceeded normally, with modifications as necessary for aliased baselines. The calibrated datasets were imaged to the rms level using both natural (ROBUST=5) and robust (ROBUST=0.5) weighting, and then smoothed to a common circular beam size of 20″. The two approaches resulted in flux integrals that differed by 10% for most systems, and we thus show only the robust weighted images in this work.
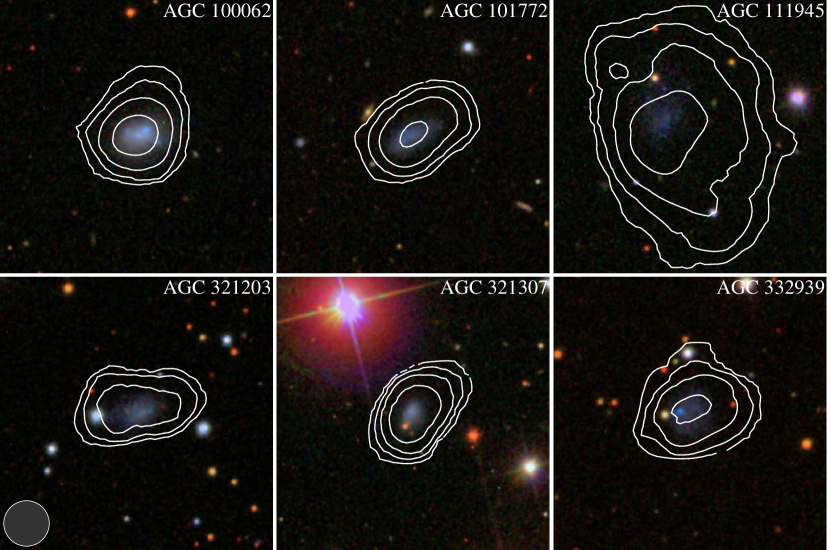
Figure 1 shows SDSS 3-color images of the six precursor galaxies. It is immediately obvious that the high surface brightness stellar populations are dominated by blue stars. This is confirmed by the SDSS photometry presented in Table 1. The weighted mean (ur) color for the six precursor systems is (ur) 0.99 0.02. This can be compared with (ur)1.3, the mean SDSS color for all ALFALFA galaxies with log(MHI)7.7 (Huang et al. 2011, in preparation).
Figure 1 compares the stellar and neutral gas distributions; overlaid on each panel are HI column density contours at the (0.5, 1, 2, 4) 1020 cm-2 levels. The neutral gas distributions are centrally concentrated and spatially coincident with the blue stellar populations. All systems show peak column densities below the canonical SF surface density threshold of n 1021 cm-2 (Skillman, 1987; Kennicutt, 1998). While the spectral resolution of these images are sufficient to resolve the HI profiles derived from ALFALFA, the HI distributions are only slightly larger than the synthesized beam size (20″). Although these six systems have HI masses above 107 M⊙ (see Table 1), these precursor observations nonetheless demonstrate the scientific potential of a coordinated observing campaign using the EVLA (see Perley et al. 2011 for a description of the EVLA project) to explore the low-mass galaxies detected by ALFALFA.
We thus initiated SHIELD (OSRO Program 10B-187, PI Cannon; time allocation of 180 hours), a multi-configuration study of the neutral ISM of 12 extremely low-mass systems. The sample members were selected from the 11,000 ALFALFA-detected galaxies to date on the basis of HI mass (MHI 1.6 107 M⊙) and line width (full width at 50% of peak 65 km s-1 from ALFALFA); the latter discriminates against massive but HI-poor galaxies and identifies the truly low mass galaxies. The median distance, HI mass, and HI line width are 5.7 Mpc, 4.7 106 M⊙, and 25 km s-1, respectively. Our observational strategy (9, 4, 2 hours per source in the B, C, D arrays, respectively, with typical calibration overheads of 25%) achieves high spatial (6″ synthesized beam at full resolution) and spectral resolution (0.82 km s-1 ch-1), while retaining sensitivity to extended structure. When data acquisition is complete, the 5 (per channel) column density sensitivity will be nHI 1019 cm-2 and 2.3 1020 cm-2 at low and high spatial resolution, respectively; the realized column density sensitivities will be higher because the linewidths are larger than the channel spacing (see Table 1). The WIDAR correlator is used to provide a single 1 MHz sub-band with 2 polarization products and 256 channels each, covering 211 km s-1 of frequency space at 3.906 kHz ch-1. Data acquisition for SHIELD began in October 2010. The images presented here use only the data acquired in the C configuration; the reduction techniques are standard, and the same imaging techniques are used for the SHIELD galaxies as described above for the precursor galaxies. The rms noise values in the robust weighted cubes range from 0.8-1.0 mJy Bm-1.
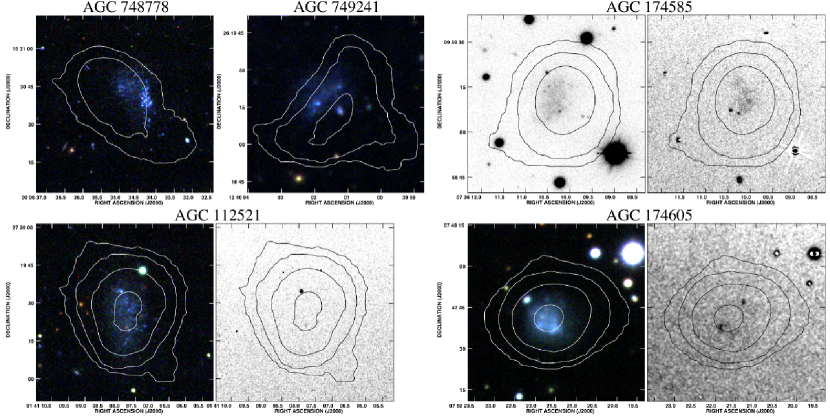
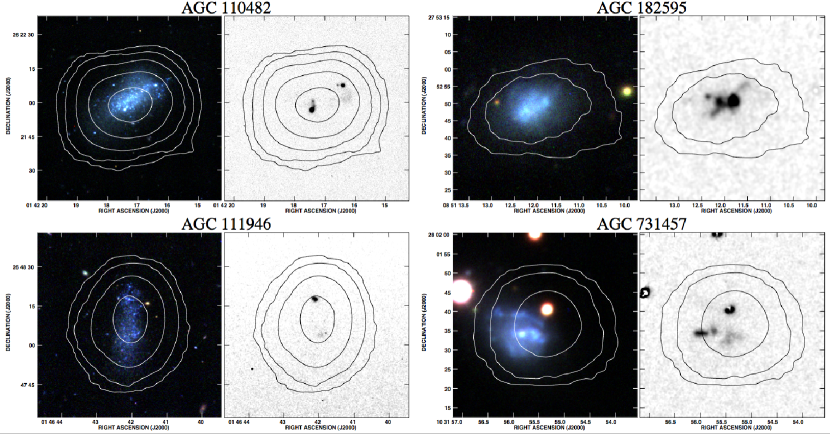
Figures 2, 3 and 4 present comparisons of the optical and HI properties of all 12 galaxies using the C-configuration datasets only. The optical images were acquired with the WIYN333The WIYN Observatory is a joint facility of the University of Wisconsin-Madison, Indiana University, Yale University, and the National Optical Astronomy Observatories. 3.5m telescope and the Mini-Mosaic camera during two observing runs (October 2010 and March 2011). The Fall images (see Table 1) were obtained during superior observing conditions (0.4″ FWHM seeing); the Spring images (see Table 1) were obtained during average observing conditions (1″ FWHM seeing). Broadband Johnson-Cousins (B, V, R) filters, and a narrowband H filter, were used. Standard reduction strategies were applied. The images are first cosmic ray rejected, aligned and combined. The broad and narrowband images are then smoothed to a common point spread function size and flux scaled to remove the continuum from the narrowband image. Finally, standard photometry routines are applied, using observations of photometric standard stars acquired during the same observing session. We estimate the photometric accuracies of the Fall and Spring images to be better than 2% and 4%, respectively.
Table 1 compiles the absolute B magnitudes and (BV) colors of 11 of the 12 SHIELD galaxies; an absolute calibration of the images of AGC 174585 (which is outside the SDSS footprint) was not attained. Similar to the precursor systems shown in Figure 1, the optical appearances of the 12 galaxies shown in Figures 2, 3 and 4 are each dominated by blue stars (note that only the R-band image of AGC 174585 is shown, due to two of the images being affected by cloud cover). The weighted mean (BV) color is 0.43 0.01; this compares well with the typical (BV) 0.42 0.05 found for local star-forming dIrr galaxies (van Zee et al., 1997; van Zee, 2000). Similarly, the weighted mean (ur) color for the SHIELD galaxies is 1.25 0.02; these systems are on average slightly redder than the precursor objects, though still consistent with the results of Huang et al. (in preparation).
SHIELD is a systematic investigation of a sample of galaxies with HI masses below 107 M⊙ outside the Local Group. Using our EVLA datasets, we are focusing on three primary goals. First, what properties change between mini-halos (HI clouds without optical counterparts; see Giovanelli et al. 2010), very low-mass dwarfs, and more massive systems? Are the cosmologically important galaxies with HI masses of 106–107 M⊙ systematically different than more or less massive objects? We plan to identify correlations between fundamental galaxy parameters (e.g., HI line width, stellar mass, SF rate, etc.) by undertaking a comparative study of these properties in objects that span some three orders of magnitude in dynamical mass, from 106–109 M⊙ (i.e., covering the mini-halo to dwarf galaxy transition region). The synthesis observations provided by the EVLA are crucial components of this program, as they allow us to examine both the global and the local processes that influence the evolution of these systems.
Second, what fraction of the mass in these low-mass dwarfs is baryonic? When data acquisition is complete, our EVLA observing campaign will allow us to study the ISM kinematics on spatial scales of order 200 pc in the galaxies in our sample (assuming a 6″ beam and a maximum distance of 8 Mpc). These data will allow us to extract detailed rotation curves in the inner regions of these galaxies and to infer the dark-to-baryonic fraction throughout the disks. Equally important is the sensitivity of the combined EVLA Arecibo datasets to extended structure, which we will exploit to study gas in the outermost regions of the disks.
Third, is the character of the SF process different in very low-mass galaxies? These systems have retained HI mass reservoirs of 106-107 M⊙ over a Hubble time; they are apparently evolving in relative quiescence and are exceedingly inefficient at converting their interstellar gas into stars. These clues suggest that the SF law may in fact deviate significantly from the canonical Schmidt-Kennicutt prescription derived for more massive systems (Skillman, 1987; Kennicutt, 1998).
3. Preliminary Results
While data acquisition for SHIELD is ongoing, we are able to draw conclusions about various intriguing properties of these extremely low-mass galaxies using the C configuration images alone. We discuss three results in turn below. First, with only one exception (AGC 111977), the HI distributions of the SHIELD galaxies are centrally concentrated at 20″ resolution. In only one case (AGC 110482) does the observed HI column density reach the 1021 cm-2 level; however, we expect that higher-resolution imaging will localize regions of larger column densities (see, e.g., the discussion of beam smearing effects in Begum et al. 2008). The SHIELD galaxies appear to have gas surface densities comparable to those in other nearby galaxies with similar HI masses (e.g., all of the galaxies with M 107 M⊙ in Begum et al. 2008 have peak n 1021 cm-2).
Second, as discussed in detail by Begum et al. (2006) and Roychowdhury et al. (2009, 2011), the relationship between HI column density and ongoing SF in low-mass galaxies is complex. Stochastic effects play an important role, and the overall process appears to be less efficient than in more massive galaxies. When taken at face value, the low integrated column densities of the SHIELD galaxies are not conducive to ongoing SF. And yet, the stellar populations of these systems are dominated by blue stars (as evidenced by the blue integrated colors in Table 1), and the majority of the galaxies show active SF as traced by H emission (see Figures 2, 3 and 4). Our WIYN 3.5m imaging produced usable H images of 11 systems (images of AGC 749241 were acquired but were compromised by cloud cover). 10 of these systems show high surface brightness H emission; the only conclusive H non-detection is AGC 748778. In most cases, H emission is located in close proximity to the highest HI column densities (but see the diffuse H emission in the southern region of AGC 111977); however, as noted above, none of these columns exceeds the canonical SF surface density threshold of 1021 cm-2. We note with interest that two of the six precursor systems (AGC 100062 and AGC 101772) have strong H emission lines in their SDSS spectra.
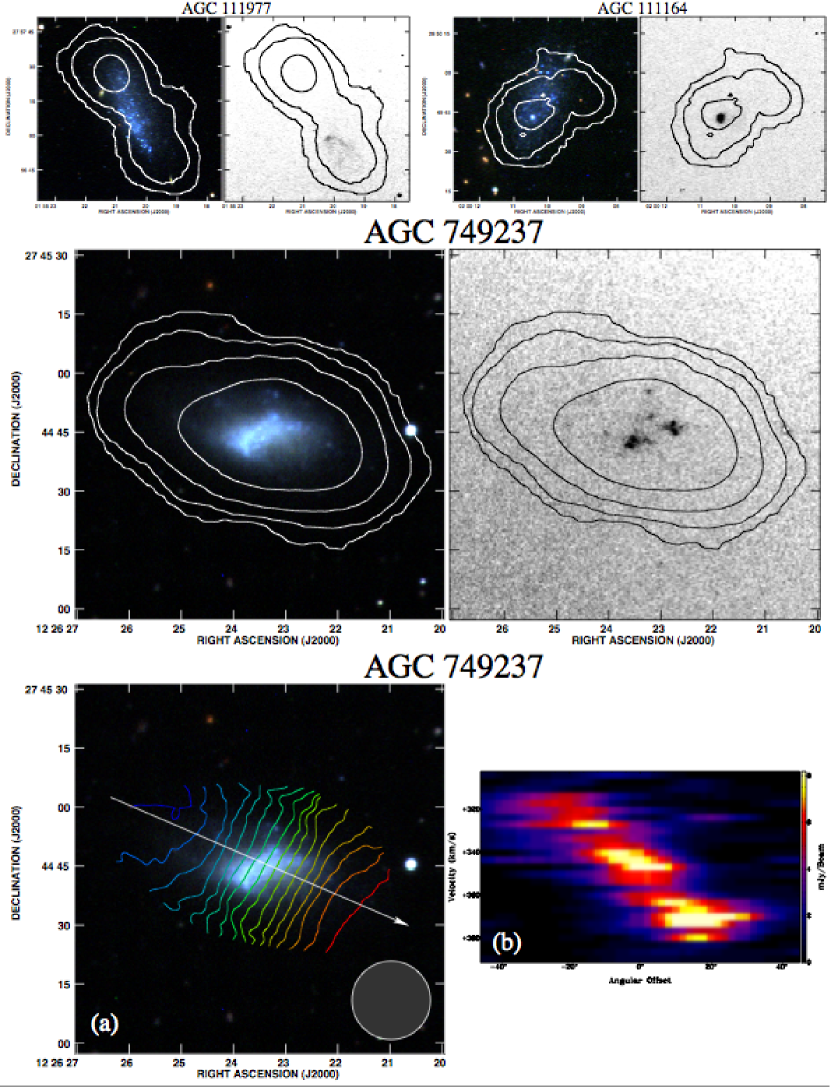
Finally, the full SHIELD datasets will allow us to test our understanding of the dark matter contents of these low-mass galaxies and of within them. While detailed rotation curve analysis requires higher resolution B-configuration EVLA images, a few systems are already amenable to meaningful position-velocity analysis using the 20 datacubes alone. Using AGC 749237 as an example (see the velocity field and position-velocity slice in Figure 4), we find solid-body rotation of 30 km s-1 at a distance of 40 from the dynamical center. We apply no inclination correction to this velocity; we note, however, that the optical inclination i 56∘, and thus the true rotational velocity may be higher by 20% or more. At the adopted (but uncertain) distance of 3.2 Mpc, this implies a dynamical mass Mdyn 1 108 M⊙. Correcting for helium and molecular gas (35% of MHI) and assuming equal masses of stars and gas, this implies 0.1. As expected, this low-mass galaxy follows the trends of at low dynamical masses in the models of Hoeft et al. (2006) and McGaugh et al. (2010).
4. Conclusion
We have introduced SHIELD, a systematic investigation of a sample of galaxies with HI masses below 107 M⊙ outside the Local Group. A primary goal of SHIELD and of ALFALFA is to characterize changes in fundamental galaxy properties as functions of total halo mass. The EVLA imaging described in this Letter is the centerpiece of a multiwavelength observing campaign designed to place these low-mass systems in an evolutionary context. When completed, the SHIELD data suite will offer a unique opportunity to study the fundamental properties of galaxies in a newly-opened region of parameter space.
References
- Babul & Rees (1992) Babul, A., & Rees, M. J. 1992, MNRAS, 255, 346
- Begum et al. (2006) Begum, A., Chengalur, J. N., Karachentsev, I. D., Kaisin, S. S., & Sharina, M. E. 2006, MNRAS, 365, 1220
- Begum et al. (2008) Begum, A., Chengalur, J. N., Karachentsev, I. D., Sharina, M. E., & Kaisin, S. S. 2008, MNRAS, 386, 1667
- Benson et al. (2002) Benson, A. J., Lacey, C. G., Baugh, C. M., Cole, S., & Frenk, C. S. 2002, MNRAS, 333, 156
- Ferrara & Tolstoy (2000) Ferrara, A., & Tolstoy, E. 2000, MNRAS, 313, 291
- Giovanelli et al. (2005) Giovanelli, R., et al. 2005, AJ, 130, 2598
- Giovanelli et al. (2010) Giovanelli, R., Haynes, M. P., Kent, B. R., & Adams, E. A. K. 2010, ApJ, 708, L22
- Grebel et al. (2003) Grebel, E. K., Gallagher, J. S., III, & Harbeck, D. 2003, AJ, 125, 1926
- Hoeft et al. (2006) Hoeft, M., Yepes, G., Gottlöber, S., & Springel, V. 2006, MNRAS, 371, 401
- Hunter et al. (2007) Hunter, D. A., Brinks, E., Elmegreen, B., Rupen, M., Simpson, C., Walter, F., Westpfahl, D., & Young, L. 2007, Bulletin of the American Astronomical Society, 38, 895
- Kennicutt (1998) Kennicutt, R. C., Jr. 1998, ApJ, 498, 541
- Klypin et al. (1999) Klypin, A., Kravtsov, A. V., Valenzuela, O., & Prada, F. 1999, ApJ, 522, 82
- Lewis et al. (2002) Lewis, I., et al. 2002, MNRAS, 334, 673
- Mac Low & Ferrara (1999) Mac Low, M.-M., & Ferrara, A. 1999, ApJ, 513, 142
- Martin et al. (2002) Martin, C. L., Kobulnicky, H. A., & Heckman, T. M. 2002, ApJ, 574, 663
- Martin et al. (2007) Martin, N. F., Ibata, R. A., Chapman, S. C., Irwin, M., & Lewis, G. F. 2007, MNRAS, 380, 281
- Martin et al. (2010) Martin, A.M., Papastergis, E., Giovanelli, R., Haynes, M.P., Springob, C.M. & Stierwalt, S. 2010, ApJ, 723, 1359
- Masters (2005) Masters, K. L. 2005, Ph.D. Thesis, Cornell University
- McGaugh et al. (2010) McGaugh, S. S., Schombert, J. M., de Blok, W. J. G., & Zagursky, M. J. 2010, ApJ, 708, L14
- Ott et al. (2005) Ott, J., Walter, F., & Brinks, E. 2005, MNRAS, 358, 1453
- Ott et al. (2010) Ott, J., Warren, S., Stilp, A., Skillman, E., Dalcanton, J., Walter, F., & de Blok, E. 2010, Bulletin of the American Astronomical Society, 42, #202.03
- Perley et al. (2011) Perley, R. A., Chandler, C. J., Butler, B. J., & Wrobel, J. M. 2011, ApJ, in press
- Rees (1986) Rees, M. J. 1986, MNRAS, 218, 25P
- Roychowdhury et al. (2009) Roychowdhury, S., Chengalur, J. N., Begum, A., & Karachentsev, I. D. 2009, MNRAS, 397, 1435
- Roychowdhury et al. (2011) Roychowdhury, S., Chengalur, J. N., Kaisin, S. S., Begum, A., & Karachentsev, I. D. 2011, MNRAS, L256
- Skillman (1987) Skillman, E. D. 1987, NASA Conference Publication, 2466, 263
- Sternberg et al. (2002) Sternberg, A., McKee, C. F., & Wolfire, M. G. 2002, ApJS, 143, 419
- van Zee et al. (1997) van Zee, L., Haynes, M. P., & Salzer, J. J. 1997, AJ, 114, 2479
- van Zee (2000) van Zee, L. 2000, AJ, 119, 2757
- Willman et al. (2005) Willman, B., et al. 2005, ApJ, 626, L85