The effects of the interaction on the kinematics, stellar population and metallicity of AM 2322-821 with Gemini/GMOS
Abstract
We present an observational study about the impacts of the interactions in the kinematics, stellar populations, and oxygen abundances of the components of the galaxy pair AM 2322-821. A fairly symmetric rotation curve for the companion (AM 2322B) galaxy with a deprojected velocity amplitude of 110 km s-1 was obtained, and a dynamical mass of within a radius of 4 kpc was estimated using this deprojected velocity. Asymmetries in the radial velocity field were detected for the companion, very likely due the interaction between the galaxies. The interaction between the main and companion galaxies was modelled using numerical N-body/hydrodynamical simulations, with the result indicating that the current stage of the system would be about 90 Myr after perigalacticum. The spatial variation in the distribution of the stellar-population components in both galaxies was analysed using the stellar population synthesis code STARLIGHT. The companion galaxy is dominated by a very young (t yr) population, with the fraction of this population to the total flux at , increasing outwards in the galaxy disc. On the other hand, the stellar population of AM 2322A is heterogeneous along the slit positions observed. Spatial profiles of oxygen abundance in the gaseous phase were obtained using two diagnostic diagrams ( =([\textO ii][\textO iii] [\textO iii] H vs. [\textO iii]/[\textO ii] and [\textO iii]/[\textO ii] vs.[\textN ii]/[\textO ii]), where we compared the observed values with the ones obtained from photoionization models. Such gradients of oxygen abundance are significantly flatter for this pair of galaxies than in typical isolated spiral galaxies. This metallicity distribution is interpreted as the gradients having been destroyed by interaction-induced gas flows from the outer parts to the centre of the galaxy.
keywords:
galaxies: general – galaxies: stellar content – galaxies: abundances – galaxies: interactions – galaxies: kinematics and dynamics – galaxies: starburst1 Introduction
Galaxy interactions and merger events play an important role on the evolution and the stellar formation history of galaxies. Interacting/merging galaxies show enhanced star formation when compared with isolated objects, as indicated by different studies (Kennicutt et al., 1987; Sekiguchi & Wolstencroft, 1992; Donzelli & Pastoriza, 1997; Barton Gillespie et al., 2003; Geller et al., 2006; Woods & Geller, 2007). This enhancement has been observed as being a function of the projected galaxy pair separation (e.g. Barton et al. 2000; Lambas et al. 2003; Nikolic et al. 2004), as well as being stronger in low-mass than in high-mass galaxies (e.g. Woods & Geller 2007; Ellison et al. 2008).
The induced star formation associated with the gas motions created by the interaction also is expected to have an impact in the chemical state of the galaxies. As star formation enriches the interstellar medium via nucleosynthesis, inflows of metal poor gas from the outer parts of the galaxy can decrease the metallicity in inner regions and modify the radial abundance gradients across spiral discs. In fact, studies have found that interacting galaxies do not follow the well established correlation between luminosity and metallicity found in normal disc galaxies. The central regions of these galaxies are underabundant when compared to isolated galaxies of similar mass (Kewley et al., 2006; Rupke et al., 2008; Ellison et al., 2008; Michel-Dansac et al., 2008; Peeples et al., 2009).
Shallower metallicity gradients have been found in barred galaxies and explained by the action of inward and outward radial flows of interstellar gas induced by the non-axisymmetric potential of bars (e.g. Friedli et al. 1994; Sellwood & Wilkinson 1993; Roy & Walsh 1997). N-body/Smoothed Particle Hydrodynamics numerical simulations of equal-mass mergers, although ignore the presence of ongoing star formation, predict that the radial metallicity gradients in disc galaxies flatten shortly after the first pericentre passage, due to the radial mixing of gas (Rupke et al., 2010). Recently, Kewley et al. (2010) determined the metallicity gradients for 8 galaxy pairs with mass ratio near unity and showed that they were significantly shallower than those in isolated spiral galaxies. Futhermore, Krabbe et al. (2008) found for the interacting pair AM 2306-721 with a mass ratio of 2:1 that the disc of the main galaxy showed a clear radial metallicity gradient, while the secondary presented a relatively homogeneous oxygen abundance. These authors interpreted the absence of abundance gradient in the secondary galaxy in terms of mixing the low metallicity gas from the outer parts with the rich metal gas of the centre of the galaxy. Is this picture always reproduced in others minor mergers? This question was not adressed before by theoretical merger simulations and observations, except the above study of AM 2306-721. Therefore, more observational studies of mergers with different mass ratios should provide useful insights to answer the above question. We have selected from Ferreiro & Pastoriza (2004) several systems to study the effects of the kinematics, stellar population and gradient abundances of the galaxies in minor mergers, where the first results of this programme were presented for AM 2306-721 (Krabbe et al., 2008).
This paper presents the results for the system AM 2322-821, which is morphologically very similar to AM 2306-721, but its mass ratio is much lower than the latter. AM 2322-821 is composed of a SA(r)c galaxy with disturbed arms (hereafter, AM 2322A) in interaction with an irregular galaxy (hereafter, AM 2322B). Both galaxies contain very luminous \textH ii regions with H luminosity in the range of L(Herg s-1 as estimated from H images and high star formation rate in the range of 0.02 to 1.15 /yr (Ferreiro et al., 2008).
The present paper is organized as follows: in Section 2, we summarize the observations and data reduction. The gas kinematics of each galaxy and the numerical N-body/hydrodynamical simulations of the interaction are presented in Sections 3 and 4, respectively. In Section 5, we present the stellar population synthesis. The metallicity analysis is in Section 6, and the conclusions are summarized in Section 7.
2 Observations and data reduction
Long slit spectroscopic data were obtained on 29/30 June 2006, 01/02 July 2006, and 27/28 July 2008 with the Gemini Multi-Object Spectrograph at Gemini South, as part of poor weather programmes GS-2006A-DD-6 and GS-2008A-Q-206. Spectra in the range 3 450 to 7 130Å were acquired with two settings with the B600 grating, and the 1 slit, keeping a compromise between spectral resolution (), spectral coverage and slit losses (due to the Image Quality = ANY constraint). The blue setting provided a wavelength coverage of 3 450 to 6 280Å and the red setting of 4 280 to 7 130Å at about the same spectral resolution. The frames were binned on-chip by 4 and 2 pixels in the spatial and spectra directions, respectively, resulting in a spatial scale of 0.288 pxl-1, and 0.9Å pxl-1 dispersion.
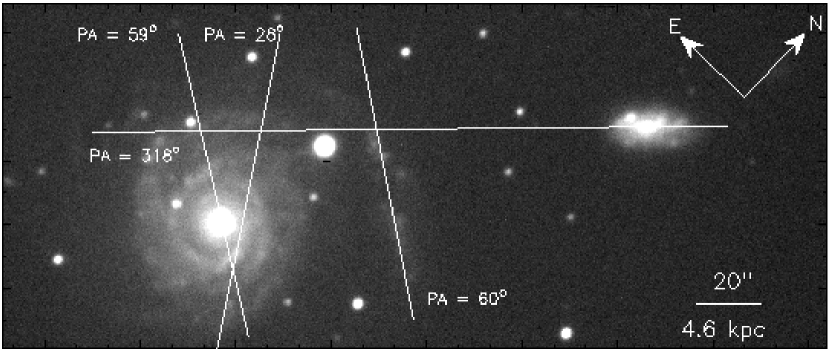
Spectra were taken at four different position angles on the sky, with the goal of observing the nucleus and the brigthest regions of the galaxies, as well as, one spiral arm that is away from the main galaxy. PA=59 is in the slit position crossing the nucleus of AM 2322A; PA=28 is cutting across main body of primary, but not across the nucleus (offset of about 8 NW from nucleus); the slit position at PA=60 is located off the disc of the main component, along the NW spiral arm (located between the main and secondary component). The PA=318 slit position is oriented along the main axis disc of the secondary component (AM 2322B) and also along the AM 2322A NE spiral arm. The PA=60 was observed only in the red spectra, and thus in this slit, it was possible only to study the ionized gas kinematics, but not their stellar population and the gas phase O/H abundance. Figure 1 shows the four slit positions on the GMOS-S acquisition image.
The exposure time on each single frame was limited to 700 seconds to minimize the effects of cosmic rays, with multiple frames being obtained for each slit position to achieve a suitable signal. The slit positions are shown in Fig. 1, superimposed on the -band image of the pair. Table 1 gives the journal of observations. Conditions during both runs were not photometric, with thin cirrus and image quality in the range 0.5 to 2.0 (as measured from stars in the acquisition images taken just prior to the spectroscopic observations).
The spectroscopic data reduction was carried out using the gemini.gmos package as well as generic IRAF tasks. We followed the standard procedure: (1) the data were bias subtracted and flatfielded; (2) the wavelengh calibration was established from the Cu-Ar arc frames with typical residuals of 0.2 Å and applied to the object frames; (3) the individual spectra of same slit positions and wavelengh range were averaged with cosmic ray rejection; (4) the object frames were sky subtracted interactively using the gsskysub task, which use a background sample of off-object areas to fit a function to the specified rows, and this fit is then subtracted from the column of each spectra; (5) the spectra were relative flux calibrated using observations of a flux standard star taken with the same set up as the science observations; (6) finally, one-dimensional spectra were extracted from the two-dimensional spectra by summing over six rows along the spatial direction. Each spectrum therefore comprises the flux contained in an aperture of 1. Assuming a distance of 49.6 Mpc for AM 2322-821 system barycenter (estimated from the radial velocities derived in Section 3 and total masses of AM 2322A and AM 2322B, estimated in Section 4, and adopting =75 km s-1 Mpc-1), this aperture corresponds to a region of 241419 pc2 for AM 2322-821. The nominal centre of each slit was chosen to be the continuum peak at . The mismatch between the blue and red spectra for all the apertures extracted was lower than about 5 % over the spectral range where both spectra overlapped. We decided not to co-add them.
| Date (UT) | Exposure time(s) | PA (°) | |
|---|---|---|---|
| 2006/06/29 | 3600 | 318 | 4280-7130 |
| 2006/06/30 | 6600 | 60 | 4280-7130 |
| 2006/07/01 | 2600 | 28 | 4280-7130 |
| 2006/07/01 | 3700 | 59 | 4280-7130 |
| 2006/07/01 | 3600 | 318 | 4280-7130 |
| 2008/07/27 | 6600 | 28 | 3450-6270 |
| 2008/07/27 | 6600 | 59 | 3450-6270 |
| 2008/07/27 | 6600 | 318 | 3450-6270 |
3 Ionized gas kinematics
The radial velocity was estimated from the strongest emission lines present in the spectra, namely ,[\textO iii] , and [\textN ii] . The final radial velocity for each spectrum was obtained by averaging the individual measurements from the detected emission lines, and the errors were estimated from the standard deviation of the individual measurements around the mean.
The inclination of each galaxy with respect to the plane of the sky was computed as , where and is the minor and major semi-axes of the galaxy, respectively. The minor and major semi-axes as well as, the position angle of the major axis of each galaxy were obtained from the acquisition images in the filter, using a simple isophotal fitting with the IRAF stsdas.ellipse task. The fitting results for the position angle of the major axis and the inclination as a function of the projected distance in arcseconds along the isophotal major axis are shown in Figs 2 and 3, for AM 2322A and AM 2322B, respectively.


For AM 2322B, the position angle of the major axis and the inclination of the galaxy are nearly constant out to a radius. The resulting values for the disc inclination and position angle of the line of nodes are and , respectively. For AM 2322A, the position angle of the major axis and the inclination of the galaxy as measured from the isophotal fitting show significant variations with radius. According to Bender & Moellenhoff (1987), the interaction among galaxies can cause isophotal twisting, so these variations can be due to the disturbed morphology of the galaxy, added to the fact that the GMOS r’-band image is not deep and star forming regions and spiral structure are dominating in these wavelengths. If we considered the external isophotes of AM 2322A, the values found are about and .
Ferreiro & Pastoriza (2004) estimated the inclination of the galaxies in this pair measuring the major and minor diameters of the 24 mag arcsec-2 isophote from images in the filter. They found and for AM 2322A and AM 2322B, respectively.
The rotation curves and the spatial profiles of the emission and continuum flux along the observed slit positions are presented in Figs. 4 and 5 for AM 2322A and AM 2322B, respectively.


As can be seen in Fig. 4, AM 2322A does not have a well defined and symmetric rotation curve along to the observed slit positions, indicating that the inclination of the galaxy must be quite low and that this object is actually being seen near face-on. Then, the real inclination of the galaxy must be lower than the one obtained from Ferreiro & Pastoriza (2004) and perhaps even from our own estimation.
The heliocentric velocity of the main galaxy is taken to be the radial velocity measured at the nominal centre (continuum peak) along the slit position at PA=59° or 3 739 km s-1.
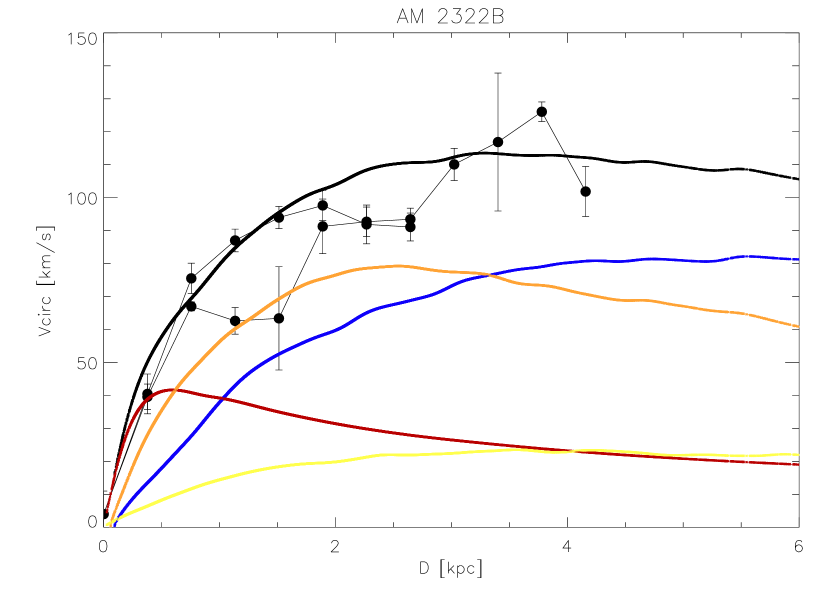
AM 2322B shows a fairly symmetric rotation curve and for this galaxy we adopted a very simple approximation for the observed velocity distribution, assuming that the gas moves under a logarithmic gravitational potential, following circular orbits close to a plane , characterized by its inclination to the plane of the sky and the position angle (PA) of the line of nodes . This assumption results in an observed radial circular velocity in the plane of the sky given by Bertola et al. (1991):
| (1) |
with
| (2) |
where is the systemic velocity, is the radius in the plane of the galaxy, and and are parameters that define the amplitude and shape of the curve. The fit of the rotation curve for this galaxy is shown in Fig. 5.
The above model for the rotation curve results in an heliocentric velocity of 3 376 km s-1. The observed radial velocities along the major axis are well represented by the model. The rotation curve is typical of spiral discs, rising shallowly and flattening at an observed amplitude of 110 km s-1, with small (less than 25 km s-1) deviations from the smooth rotational field, which are commonly observed in interacting galaxies.
Donzelli & Pastoriza (1997) estimated systemic velocities of 3 680 and 3 424 km s-1 for AM 2322A and AM 2322B, respectively, which agree within 2 % with our values.

| Parameter | AM 2322B (PA=318°) |
|---|---|
| (°) | 63 |
| (°) | 318 |
| (km/s) | 3 376 |
| (km/s) | 110 |
| (kpc) | -0.331391 |
For AM 2322B, we can obtain an estimation of the dynamical mass by assuming that the mass inside a certain radius is given by . Using the deprojected velocity amplitude of 110 km s-1 and a radius of 4 kpc its dynamical mass is . It is important to emphasize that the maximum radius to which we can observe the gas in emission is quite certainly smaller than the total radius of the galaxies, so our estimate of the dynamical mass is a lower limit to the actual dynamical mass of the system. The estimation of the deprojected velocity is also dependent on the assumed inclination of the galaxies with respect to the plane of the sky, so if we assume the inclination angle of derived by Ferreiro & Pastoriza (2004), the dynamical mass would be of .
4 Numerical Simulations
Aiming to reconstruct the history of the AM 2322-821 system and predict its evolution, we attempted to reproduce the interaction between AM 2322A and AM 2322B by running a series of N-body simulations. The simulations were carried out with the N-body/SPH code GADGET-2 developed by Springel (2005). Galaxies were modeled following the prescription of Hernquist (1993), where we included a gaseous disk component.
The model parameters for AM 2322B were constrained from the observed morphology and rotation curve presented in Sec. 3. The resulting simulated rotation curve is shown in Fig. 6, where we overplot the observed circular velocity data.
| AM 2322A | AM 2322B | |
| Number of points in disk | 16384 | 8192 |
| Disk mass | 0.6 | 0.08 |
| Disk radial scale length | 0.7 | 0.3 |
| Disk vertical scale thickness | 0.14 | 0.0 |
| Reference radius Rref | 1.7 | 0.8 |
| Toomre Q at Rref | 1.5 | 1.5 |
| Number of points in gas disk | 16384 | 8192 |
| Gas disk mass | 0.06 | 0.01 |
| Gas disk radial scale length | 1.0 | 0.45 |
| Gas disk vertical scale thickness | 0.07 | 0.01 |
| Toomre Q at Rref | 1.2 | 1.4 |
| Number of points in bulge | 1024 | 1024 |
| Bulge mass | 0.5 | 0.01 |
| Bulge radial scale length | 0.14 | 0.05 |
| Number of points in spherical halo | 16384 | 8192 |
| Halo mass | 2.4 | 0.24 |
| Halo cutoff radius | 6.0 | 2.0 |
| Halo core radius | 0.6 | 0.4 |
Notes: Simulations were done in a system of units with G=1. Model units scales to physical ones such that: length unit is 3.5 kpc, unit velocity is 262 km s-1, unit mass is and unit time is 13.062 Myr.
In order to build a model for AM 2322A, we first attempted to measure its inclination through isophotal ellipse fitting (see Fig. 2), but the results are inconclusive due to the small inclination angle, combined with tidal distortions experienced by the galaxy, which result in strong radial variations on the resulting isophotal position angle. The long-slit spectra crossing the disk through two different position angles (see Figures 1 and 4), and none of those show clear signs of rotation, so the rotation curve cannot really be used to constrain the mass distribution of the galaxy as in the case of AM 2322B. AM 2322A is modeled as a face-on galaxy. A photometric mass estimate of is obtained using an absolute B magnitude M (Ferreiro & Pastoriza, 2004) and assuming a mass-to-light ratio of M⊙ L from Faber & Gallagher (1979) as valid for a Hubble type SA(r)c galaxy (de Vaucouleurs et al., 1991).
As usual in this kind of approach, to reproduce the dynamical and morphological state of the AM 2322-821 system we have to solve a reverse problem of finding the orbit followed by the galaxies from their observed properties, and this is not a fully determined problem, since the observational data do not provide all the necessary information. Therefore, in order to set up the initial conditions for the simulations, we calculate orbits that satisfy the requirements given by the observed radial velocity difference, testing different eccentricities, pericenter distances, and line of sight direction distances. After that, based on the observed morphology and previous experience, we select a few orbits to simulate, from which the one that best fits the observed properties is selected.
Different galaxy models were tested, and the parameters of the final ones are presented in Table 3. The AM 2322A model has a total mass of , and the mass of the AM 2322B model is . The mass of each individual component (disk, bulge, halo, and gas) of both models is also given in the table. The disk inclination in the models were chosen to match the observationally derived values (see Section 3: AM 2322A is modeled as a face-on galaxy). The determination of AM 2322B model inclination required several test simulations, because the tidal distortions and warping induced by the interaction modifies the projected axial ratio: initial conditions with AM 2322B model inclined by led to final morfologies that do not match with the observed one. The best results were obtained with AM 2322B initially inclined by . A total of 75776 particles were used.


After several runs, the orbit that best reproduces the observational properties is a fast hyperbolic orbit, with an eccentricity and perigalacticum of kpc. The orbital plane is inclined to the plane of the sky by , and intersects the later in a position angle of .
The dynamical mass of AM 2322B, as obtained in Section 2 up to a radius of 4 kpc, amounted to . At the final stage of the simulation, up to that radius, the model provided a mass of (the initial model has a mass of up to that radius).
The simulation indicates that the spatial distance between both galaxies is 43.8 kpc (sky projected distance is 35 kpc). AM 2322A is closer to us than AM 2322B.
Radial velocity curves of model galaxies AM 2322A and AM 2322B are presented in Figure 7. They are compared with the observed radial velocity data and show that the kinematics of the models is correct.
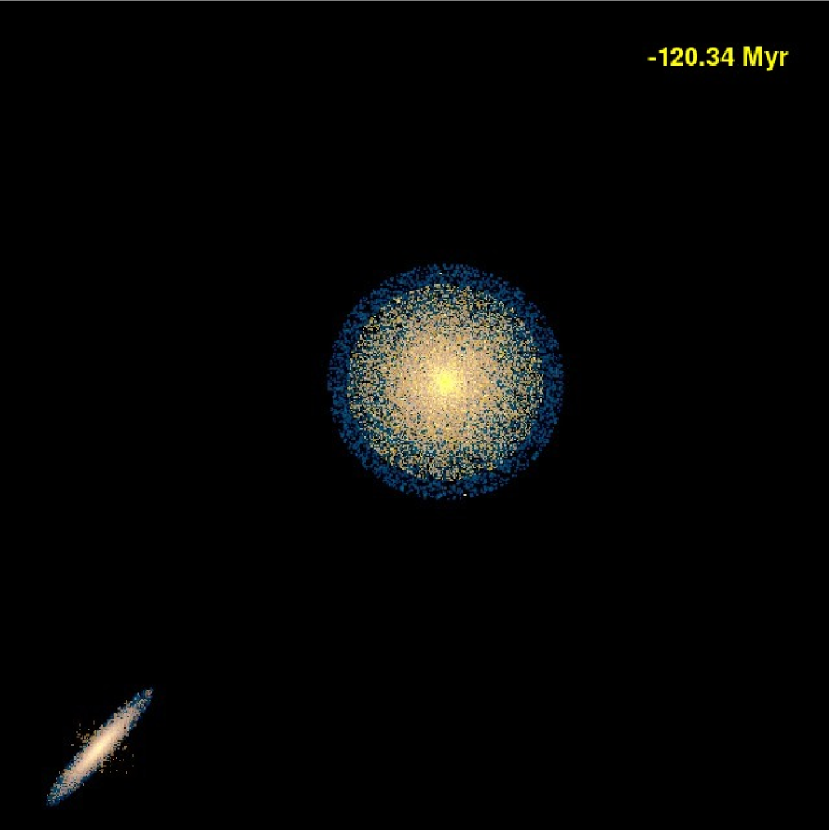
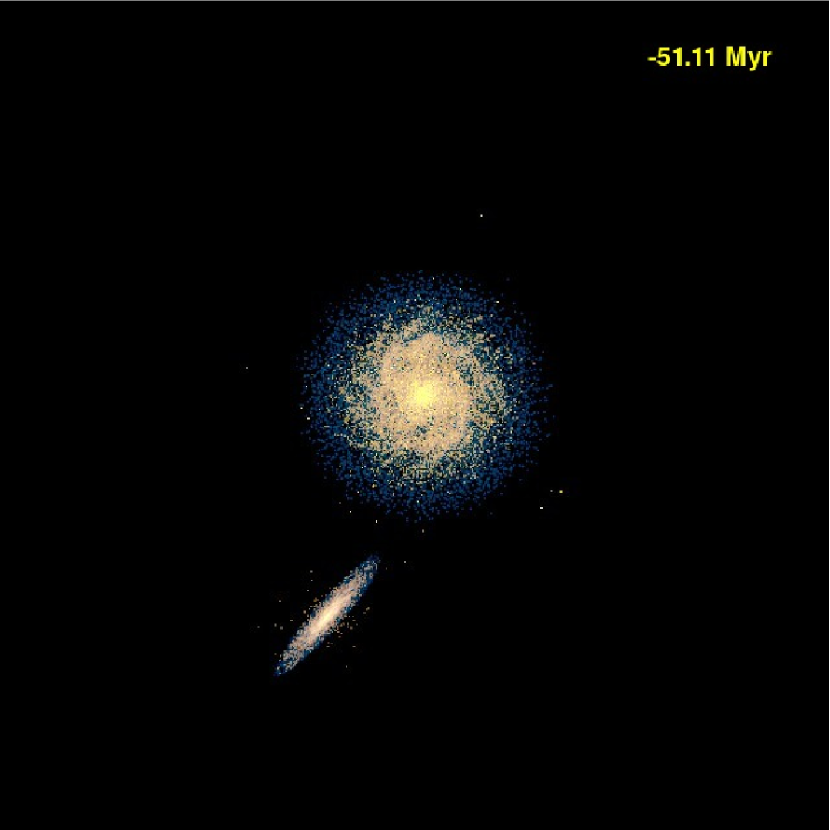
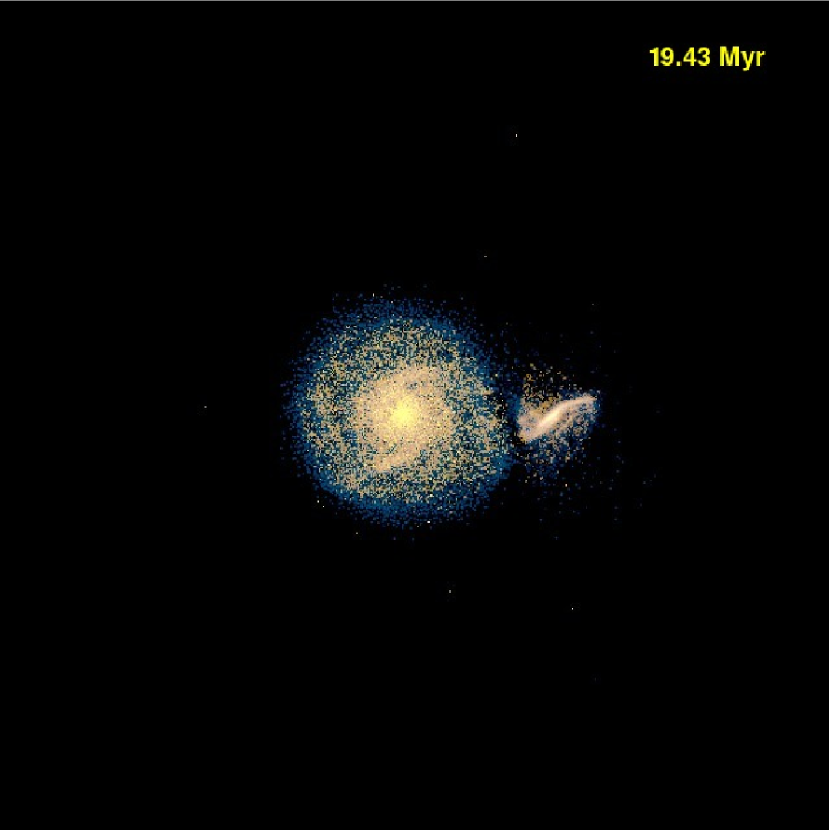
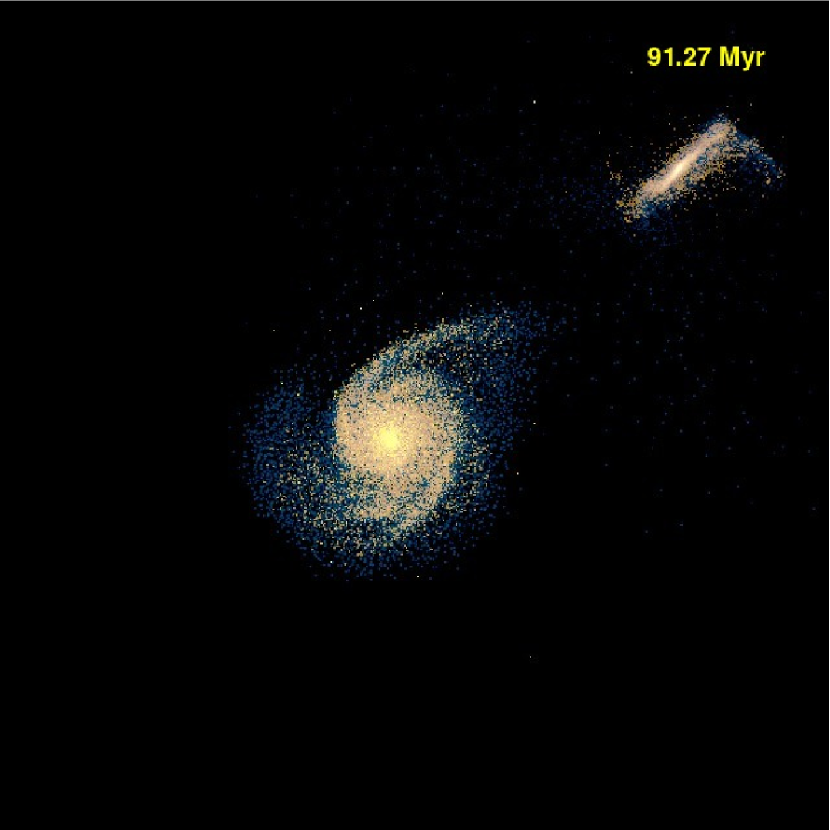
Figure 8 shows the time evolution of the encounter. Time is shown in
Myr in the upper right corner of each frame, with respect to the
perigalacticum. Simulation starts 120 Myr before perigalacticum. The
situation that best reproduces the morphology and kinematics of the present
stage of the AM 2322-821 system is at Myr after perigalacticum. The
general large scale morphology and kinematics agrees well with observations,
within the resolution provided by the simulations.
5 Stellar Population Synthesis
A detailed study of the star formation in minor merger galaxies is an important source of information not only on the age distribution of their stellar population components, but to better understand several aspects related to the interacting process, its effect in the properties of the individual galaxies and their later evolution. The absorption features arising from the stellar component also affect to different degrees the measured intensity of the emission line in the spectrum of the gaseous component. This effect is more prominent in, but not restricted to, the Balmer lines, so the stellar population contribution must be subtracted from each spectra in order to study the physical properties of the gas.


To investigate the star formation history of AM 2322A and AM 2322B, we use the stellar population synthesis code STARLIGHT (Cid Fernandes et al., 2004, 2005; Mateus et al., 2006; Asari et al., 2007). This code is extensively discussed in Cid Fernandes et al. (2004, 2005), and is built upon computational techniques originally developed for empirical population synthesis with additional ingredients from evolutionary synthesis models.The code fits an observed spectrum with a combination of single stellar populations (SSPs) from the Bruzual & Charlot (2003) models. These models are based on a high-resolution library of observed stellar spectra, which allows for detailed spectral evolution of the SSPs at a resolution of 3 Å across the wavelength range of 3 200-9 500 with a wide range of metallicities. We used the Padova 1994 tracks as recommended by Bruzual & Charlot (2003), with the initial mass function of Chabrier (Chabrier, 2003) between 0.1 and 100 . Extinction is modeled by STARLIGHT as due to foreground dust, using the reddening law of Cardelli et al. (1989) with RV= 3.1 , and parametrized by the V-band extinction AV. The SSPs used in this work cover fifteen ages, t = [0.001 , 0.003 , 0.005 , 0.01 , 0.025 , 0.04 , 0.1 , 0.3 , 0.6 , 0.9 , 1.4 , 2.5 , 5 , 11 , and 13] Gyr, and three metallicities, Z = [0.2 Z☉, 1 Z☉, and 2.5] Z☉, summing up to 45 SSP components. Briefly, the code solves the following equation for a model spectrum M☉ (Cid Fernandes et al., 2005):
| (3) |
were is the reddened spectrum of the th SSP normalized at ; is the reddening term; Mλ0 is the synthetic flux at the normalisation wavelength; is the population vector; denotes the convolution operator; and G() is the gaussian distribution used to model the line-of-sight stellar motions, it is centred at velocity with dispersion .
The fit is carried out with a simulated annealing plus Metropolis scheme, which searches for the minimum of the equation (Cid Fernandes et al., 2005):
| (4) |
where emission lines and spurious features are masked out by fixing . For more details on STARLIGHT see Cid Fernandes et al. (2005).
Prior to the modelling, the SSPs models were convolved to the same resolution of the observed spectra; the observed spectra were shifted to its rest-frame, corrected for foreground Galactic reddening of mag taken from Schlegel et al. (1998) and normalized to Å. The error in considered in the fitting was the continuum rms with a , where is the signal-to-noise ratio per in the region around . Also, the fitting was performed only in spectra with the presence of absorption lines. Measurement errors are still a problem in population synthesis. The most serious drawback of STARLIGHT, as it is, is that it does not provide error estimates on its parameters. The reliability of parameter estimation was best studied in Cid Fernandes et al. (2004, 2005) by means of simulations which fed the code with spectra generated with known parameters, add noise, and then examined the correspondence between input and output values. They performed this kind of simulation for a = 20 base and the main results of that study were: (1) in the absence of noise, the method recovers all components of to a high degree of accuracy; (2) in the presence of noise, however, the individual output fractions may deviate drastically from the input values. However, this problem can be circumvented by binning the stellar populations according to the flux contributions. In addition to, the absorption features present in our spectra, i.e. Balmer lines, are mainly dependent on age rather than on metallicity. In Fig. 11 is a histogram with the contribution of each stellar populations to the optical flux of the spectrum of the central region along the PA=59° , before the binning the stellar populations. About the same results were obtained for the other apertures. It can be noted in Fig. 11 that the about the same contributions by age are obtained from different metallicities, with a little increase of old population contribution when lower Z values are assumed (the metallicity-age degeneracy problem).

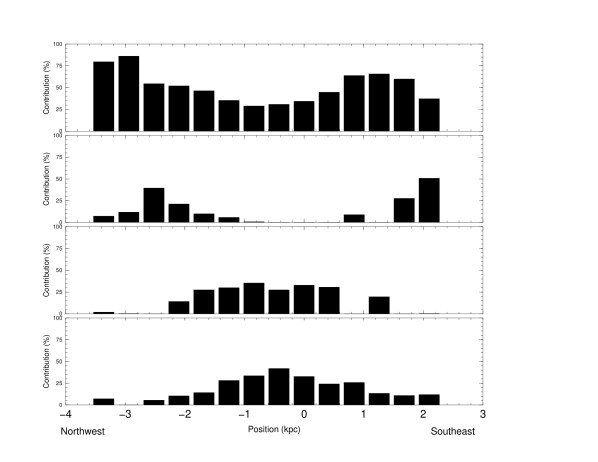
Fig. 9 shows an example of the observed spectra corrected by reddening, the model stellar population spectra and the pure emission spectra for AM 2322A and AM 2322B. The results of the synthesis are summarized in Tables 4 and 5 for the individual spatial bins in each galaxy, stated as the percentual contribution of each base element to the flux at .
Following the prescription of Cid Fernandes et al. (2005), we defined a condensed population vector, by binning the stellar populations according to the flux contributions into very young, (t yr), young, ( yr), intermediate-age, ( yr) and old, (t yr) components. The same bins were used to represent the mass components of the population vector (, , and ). The metallicity, an important parameter to characterize the stellar population content, is weighted by light fraction, and the results point out to a mean value around solar. The quality of the fitting result is measured by the parameters and . The latter gives the percentual mean deviation over all fitted pixels, where and are the observed and model spectra, respectively.
The spatial variation in the contribution of the stellar-population components are shown in 10 and 12 for the galaxies AM 2322A and AM 2322B, respectively.
As can be seen in Fig. 10, the stellar population of AM 2322A is heterogenous along both slit positions. It does not show age gradient: the very young , intermediate and old populations contribute significantly to the optical flux at . In a mass-weighted context, the bulge is predominantly composed of old population, in agreement with the results obtained by (MacArthur et al., 2009).
AM 2322B is dominated, by the very young population component . This component has a systematic variation along the slit, increasing outwards. Instead the fraction of old and intermediate stellar population components is decreasing from the centre to the outer regions. The young star-formation episode ocurred in this galaxy could be related with the perigalactic passage, that is, about 90 Myr after perigalacticum. The effects of the galaxy interaction in the star formation history are much more conspicuous in the secondary galaxy than in the main galaxy. This is expected as the triggering of star formation events by tidal interactions appears to be more efficient in less massive systems. Similar results were also found for the pair AM 2306-721 (Krabbe et al., 2008).
6 Gas phase O/H abundance
Once the stellar population contribution has been determined, the underlying absorption line spectrum can be subtracted to allow the measurement and analysis of the line emission from the gaseous component. The line intensities were measured using Gaussian line profile fitting on the pure emission spectra. We used the IRAF splot routine to fit the lines, with the associated error being given as , where and are the continuum rms and the Poisson error of the line flux, respectively. The relative error in the flux estimates of the emission lines are lower than 20 %. The residual extinction associated with the gaseous component for each spatial bin was calculated comparing the observed and ratios to the theoretical values in Hummer & Storey (1987) for an electron temperature of 10 000 and a electron density of 100 . The observed emission line intensities were then corrected by this residual extinction using the Howarth (1983) reddening function.
| Pos. (kpc) | [1] | |||||||||||
|---|---|---|---|---|---|---|---|---|---|---|---|---|
| (%) | (%) | (%) | (%) | (%) | (%) | (%) | (%) | (mag) | ||||
| AM 2322A (PA=59°) | ||||||||||||
| -7.98 | 14.3 | 22.8 | 18.2 | 40.6 | 0.4 | 2.3 | 3.1 | 94.2 | 0.014 | 1.4 | 5.83 | 0.15 |
| -7.56 | 21.1 | 26.3 | 0.0 | 49.9 | 0.5 | 1.8 | 0.0 | 97.7 | 0.028 | 0.1 | 7.98 | 0.00 |
| -7.14 | 19.9 | 13.7 | 10.2 | 56.6 | 0.8 | 1.8 | 5.7 | 91.6 | 0.010 | 0.1 | 24.79 | 0.00 |
| -6.72 | 9.7 | 25.9 | 40.2 | 21.2 | 0.2 | 4.0 | 12.4 | 83.4 | 0.024 | 0.1 | 10.96 | 0.00 |
| -5.88 | 14.8 | 0.0 | 61.8 | 20.7 | 0.3 | 0.0 | 37.0 | 62.7 | 0.007 | 0.1 | 13.14 | 0.42 |
| -5.46 | 13.2 | 25.6 | 29.6 | 29.4 | 0.1 | 3.8 | 10.2 | 85.9 | 0.019 | 0.0 | 10.20 | 0.48 |
| -5.04 | 8.8 | 33.4 | 18.1 | 37.4 | 0.1 | 3.3 | 3.5 | 93.1 | 0.016 | 0.1 | 7.65 | 0.24 |
| -4.62 | 10.9 | 38.9 | 0.0 | 46.8 | 0.1 | 2.2 | 0.0 | 97.7 | 0.021 | 0.1 | 5.59 | 0.25 |
| -4.20 | 32.3 | 33.7 | 14.2 | 16.8 | 1.7 | 10.7 | 9.4 | 78.2 | 0.022 | 0.1 | 4.88 | 0.34 |
| -3.78 | 19.7 | 25.5 | 22.4 | 31.0 | 0.4 | 2.0 | 5.8 | 91.8 | 0.033 | 0.1 | 4.95 | 0.12 |
| -3.36 | 13.4 | 6.9 | 39.1 | 39.5 | 0.1 | 0.7 | 7.9 | 91.2 | 0.022 | 0.1 | 5.54 | 0.18 |
| -2.52 | 8.8 | 8.5 | 43.7 | 37.6 | 0.1 | 0.9 | 10.3 | 88.8 | 0.021 | 1.2 | 3.88 | 0.38 |
| -2.10 | 0.7 | 0.0 | 64.6 | 33.7 | 0.0 | 0.0 | 11.9 | 88.1 | 0.021 | 0.1 | 12.37 | 0.05 |
| -1.68 | 0.0 | 17.8 | 29.5 | 51.8 | 0.0 | 0.8 | 4.6 | 94.5 | 0.017 | 0.2 | 22.41 | 0.21 |
| -1.26 | 0.0 | 28.4 | 26.5 | 43.7 | 0.0 | 1.5 | 5.1 | 93.4 | 0.031 | 0.1 | 19.28 | 0.51 |
| -0.84 | 1.9 | 25.8 | 1.0 | 69.7 | 0.0 | 1.3 | 0.2 | 98.5 | 0.025 | 0.0 | 15.76 | 0.78 |
| -0.42 | 22.6 | 28.8 | 30.8 | 17.2 | 2.1 | 5.4 | 21.0 | 71.6 | 0.018 | 0.1 | 7.19 | 1.40 |
| 0 | 7.1 | 21.3 | 10.7 | 60.7 | 0.1 | 1.1 | 2.9 | 95.9 | 0.023 | 0.0 | 2.77 | 0.46 |
| 0.42 | 12.5 | 15.5 | 21.9 | 50.6 | 0.1 | 0.8 | 7.8 | 91.3 | 0.024 | 0.0 | 3.25 | 0.39 |
| 0.84 | 6.5 | 17.9 | 24.0 | 51.4 | 0.0 | 0.9 | 7.3 | 91.7 | 0.028 | 0.1 | 8.98 | 0.53 |
| 1.26 | 2.3 | 9.4 | 35.7 | 50.8 | 0.1 | 0.7 | 9.2 | 90.1 | 0.029 | 0.1 | 16.82 | 0.46 |
| 2.10 | 6.2 | 27.0 | 16.0 | 48.1 | 0.1 | 2.4 | 2.7 | 94.8 | 0.021 | 0.2 | 31.91 | 0.24 |
| 2.52 | 9.7 | 36.7 | 18.8 | 33.9 | 0.1 | 2.3 | 3.3 | 94.3 | 0.020 | 0.2 | 12.53 | 0.29 |
| 2.94 | 28.4 | 45.1 | 0.0 | 24.4 | 0.5 | 3.6 | 0.0 | 95.9 | 0.015 | 0.2 | 7.64 | 0.35 |
| 3.36 | 35.8 | 23.5 | 0.0 | 37.2 | 0.3 | 1.6 | 0.0 | 98.1 | 0.032 | 0.2 | 7.87 | 0.23 |
| 3.78 | 28.7 | 25.0 | 7.8 | 37.3 | 0.6 | 4.3 | 2.2 | 92.9 | 0.029 | 0.2 | 19.06 | 0.22 |
| AM 2322A (PA=28°) | ||||||||||||
| -4.20 | 25.2 | 8.9 | 0.0 | 69.0 | 0.9 | 1.2 | 0.0 | 97.8 | 0.012 | 0.1 | 16.85 | 0.17 |
| -3.78 | 25.3 | 0.0 | 0.0 | 73.8 | 0.4 | 0.0 | 0.0 | 99.6 | 0.004 | 0.1 | 21.13 | 0.00 |
| -3.36 | 21.0 | 16.1 | 6.6 | 56.0 | 0.1 | 1.5 | 1.1 | 97.2 | 0.013 | 0.1 | 11.01 | 0.09 |
| -2.94 | 16.6 | 6.6 | 29.9 | 51.6 | 0.1 | 0.6 | 11.5 | 87.8 | 0.012 | 0.1 | 9.93 | 0.10 |
| -2.52 | 11.4 | 24.6 | 6.1 | 64.1 | 0.3 | 2.7 | 3.3 | 93.7 | 0.010 | 0.1 | 9.77 | 0.28 |
| -2.1 | 21.2 | 56.2 | 0.0 | 26.1 | 0.4 | 7.4 | 0.0 | 92.2 | 0.026 | 0.1 | 9.64 | 0.53 |
| -1.68 | 29.0 | 0.0 | 73.0 | 0.0 | 2.5 | 0.0 | 97.3 | 0.2 | 0.022 | 0.1 | 7.99 | 0.41 |
| -1.26 | 10.1 | 0.0 | 23.5 | 68.8 | 0.2 | 0.0 | 8.2 | 91.5 | 0.009 | 0.1 | 11.85 | 0.19 |
| -0.84 | 16.2 | 0.0 | 34.5 | 52.9 | 0.5 | 0.0 | 8.6 | 90.9 | 0.007 | 0.1 | 8.10 | 0.37 |
| -0.42 | 26.6 | 12.8 | 3.5 | 58.4 | 0.4 | 1.4 | 0.9 | 97.3 | 0.020 | 0.1 | 7.93 | 0.12 |
| 0 | 14.4 | 0.0 | 41.9 | 42.2 | 0.6 | 0.0 | 14.3 | 85.1 | 0.012 | 0.1 | 8.07 | 0.42 |
| 0.42 | 26.9 | 8.2 | 14.4 | 50.0 | 0.3 | 0.8 | 4.3 | 94.6 | 0.018 | 0.1 | 7.50 | 0.45 |
| 0.84 | 12.5 | 47.9 | 0.0 | 41.8 | 0.4 | 3.6 | 0.0 | 96.0 | 0.026 | 0.1 | 6.90 | 0.54 |
| 1.26 | 30.2 | 23.6 | 10.1 | 36.3 | 0.5 | 4.2 | 5.8 | 89.5 | 0.015 | 0.1 | 7.32 | 0.68 |
| 1.68 | 21.3 | 3.3 | 49.0 | 26.0 | 0.3 | 0.6 | 37.0 | 62.2 | 0.016 | 0.1 | 9.91 | 0.56 |
| 2.10 | 5.8 | 44.3 | 0.9 | 52.2 | 0.2 | 5.4 | 0.3 | 94.1 | 0.007 | 0.1 | 39.77 | 0.76 |
| 2.52 | 19.6 | 9.7 | 56.6 | 8.6 | 0.8 | 2.2 | 46.1 | 51.0 | 0.016 | 0.1 | 18.30 | 0.80 |
| 3.36 | 18.4 | 31.9 | 0.0 | 59.3 | 0.5 | 5.9 | 0.0 | 93.6 | 0.019 | 0.1 | 22.39 | 0.00 |
| 3.78 | 16.8 | 0.0 | 45.6 | 41.0 | 0.7 | 0.0 | 21.4 | 77.9 | 0.022 | 0.1 | 30.54 | 0.23 |
| 4.62 | 22.2 | 0.6 | 80.7 | 0.1 | 1.6 | 0.2 | 97.9 | 0.2 | 0.038 | 0.1 | 54.97 | 0.66 |
[1] Abundance by mass with Z☉=0.02
| Pos. (kpc) | [1] | |||||||||||
|---|---|---|---|---|---|---|---|---|---|---|---|---|
| (%) | (%) | (%) | (%) | (%) | (%) | (%) | (%) | (mag) | ||||
| AM 2322B (PA=318°) | ||||||||||||
| -3.36 | 79.7 | 7.1 | 1.8 | 7.1 | 5.5 | 2.3 | 1.3 | 91.0 | 0.021 | 1.30 | 3.94 | 0.37 |
| -2.94 | 86.1 | 11.8 | 0.2 | 0.0 | 47.3 | 49.4 | 3.2 | 0.0 | 0.020 | 0.01 | 4.01 | 0.00 |
| -2.52 | 54.4 | 39.4 | 0.0 | 5.6 | 4.0 | 13.9 | 0.0 | 82.1 | 0.022 | 0.01 | 3.49 | 0.16 |
| -2.10 | 51.9 | 21.2 | 14.1 | 10.6 | 2.3 | 5.3 | 7.7 | 84.6 | 0.026 | 0.01 | 3.49 | 0.10 |
| -1.88 | 46.3 | 9.9 | 27.5 | 14.2 | 2.6 | 2.9 | 15.6 | 78.9 | 0.022 | 0.01 | 3.26 | 0.00 |
| -1.26 | 35.4 | 5.7 | 29.9 | 28.3 | 0.5 | 0.9 | 7.1 | 91.6 | 0.018 | 0.01 | 2.77 | 0.00 |
| -0.84 | 28.8 | 0.8 | 35.4 | 33.7 | 0.4 | 0.1 | 8.2 | 91.3 | 0.019 | 0.01 | 2.71 | 0.12 |
| -0.42 | 30.7 | 0.1 | 27.3 | 42.0 | 0.4 | 0.0 | 5.0 | 94.6 | 0.022 | 0.01 | 2.74 | 0.28 |
| 0 | 34.2 | 0.0 | 32.9 | 32.9 | 0.5 | 0.0 | 6.9 | 92.7 | 0.021 | 0.01 | 2.67 | 0.54 |
| 0.42 | 44.7 | 0.0 | 30.6 | 24.2 | 0.9 | 0.0 | 7.8 | 91.3 | 0.022 | 0.01 | 2.67 | 0.53 |
| 0.84 | 63.8 | 8.8 | 0.0 | 26.0 | 1.7 | 2.2 | 0.0 | 96.2 | 0.025 | 0.01 | 2.83 | 0.46 |
| 1.26 | 65.8 | 0.0 | 19.5 | 13.5 | 2.3 | 0.0 | 7.1 | 90.6 | 0.021 | 0.01 | 3.02 | 0.32 |
| 1.68 | 59.9 | 27.6 | 0.0 | 10.9 | 5.3 | 11.2 | 0.0 | 83.5 | 0.018 | 0.01 | 2.96 | 0.32 |
| 2.10 | 37.1 | 50.7 | 0.1 | 11.9 | 3.2 | 21.6 | 0.3 | 75.0 | 0.018 | 0.01 | 3.89 | 0.53 |
[1] Abundance by mass with Z☉=0.02
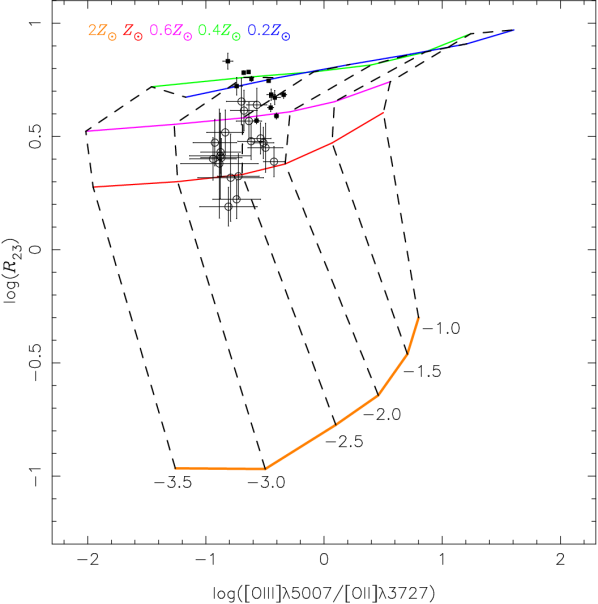
Determining accurate element abundances of the gas phase from optical spectra is critically dependent on measuring temperature sensitive line ratios, such as [\textO iii]. However, when doing spectroscopy of \textH ii regions with high metallicity and/or low excitation, temperature sensitive lines such as [\textO iii] are found to be weak or unobservable, and empirical indicators based on more easily measured line ratios have to be used to estimate metal abundances.
Because we did not detect any temperature-sensitive emission lines in our spectra, we used the =([\textO ii][\textO iii] [\textO iii] H vs. [\textO iii]/[\textO ii] (McGaugh, 1991) diagnostic diagram to estimate the metallicity of the gas in the star forming regions by comparing the observed values with a grid of photoionization models. The [\textN ii]/[\texto ii] line ratio was used to break the degeneracy for our data, as suggested by (Kewley & Ellison, 2008) . We verify that all observed star forming regions of our galaxies have log([\textN ii]/[\texto ii] , thus they are placed in the upper branch.
The photoionization models were built using the code Cloudy/08.00 (Ferland, 2002). In each model, a stellar cluster was assumed as the ionizing source with the stellar energy distribution obtained from the synthesis models Starburst99 (Leitherer et al., 1999). We calculated models with metallicities of 2.0,1.0, 0.6, 0.4, and 0.2 , ionization parameter , , , , , and , with the stellar cluster having an upper stellar mass limit of = 100 , age of 2.5 Myr and formed by an instantaneous burst. The solar value of is taken from Allende Prieto et al. (2001). Similar models have been used to describe observational data of \textH ii regions in interacting (Krabbe et al., 2007, 2008) as well as in isolated galaxies (Dors & Copetti, 2005). The reader is referred to Dors & Copetti (2006) for a full description of the models. Fig. 13 shows the vs. [\textO iii]/[\textO ii] diagram, with the observed values superposed in the grid of computed models. Filled squares correspond to regions in AM 2322A and open squares to regions in AM 2322B. Figs. 14 and 15 show the estimated O/H abundance distribution as a function of the galactocentric distance for AM 2322A and AM 2322B, respectively.
As we can see in Figs. 14 and 15, the oxygen abundances derived from the vs. [O III]/[O II] diagram suggest an relatively homogenous O/H value of 8.6 and 8.40 across the disc of the galaxies AM 2322A and AM 2322B, respectively.
The central O/H values of for the two galaxies are lower than those obtained for field galaxies of the same luminosity, in agreement with the results obtained by Kewley et al. (2006) for galaxy pair members with small projected separations (s 20 kpc). This result provides strong observational evidence for the hypothesis that the galaxy interactions create gas flows towards the central regions, carrying less enriched gas from the outskirts of the galaxy into the central regions, mixing and homogenizing the chemical composition of the interstellar medium (Kewley et al., 2006). This is also similar to the result previously found for the AM 2306-721 pair (Krabbe et al., 2008), where the companion galaxy also presented an oxygen abundance relatively homogeneous across the disc.
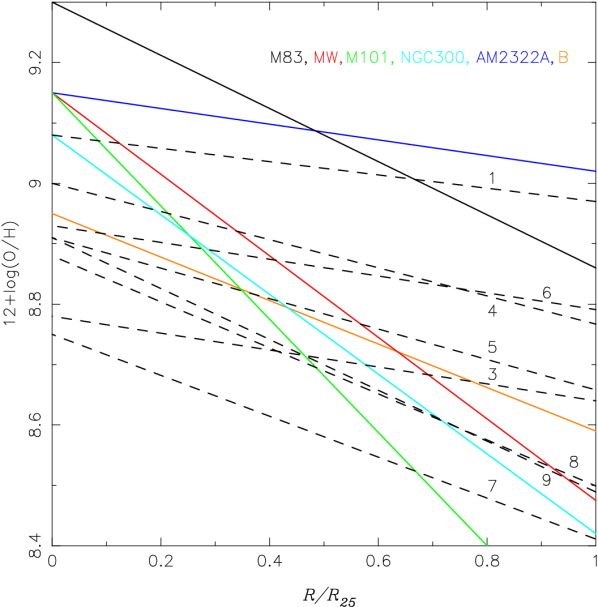
We compare the metallicity gradients obtained for AM2322A and AM2322B with the gradients for the sample of close pairs derived by Kewley et al. (2010) and for the isolated galaxies M 101, Milk Way, M 83, and NGC 300. The galactocentric distance is given in units of , where is the B-band isophote at a surface brightness of 25 mag . The adopted for AM2322A and AM2322B are 13.5 kpc and 4.2 kpc, respectively. Kewley et al. (2010) computed the gradients using the [\textN ii]6584/[\textO ii]3727-O/H relation for the first three isolated galaxies and for their sample pair. The metallicity gradient in NGC 300 was computed using the emission line intensities of \textH ii regions obtained by Bresolin et al. (2009) and also using the method cited above. These gradients are shown in Fig. 16. For consistency, we recalculate the gradients in the AM2322A and AM2322B using the same method and found and , respectively. As can be seen in Fig. 16, these gradients have about the same slope as close pairs () and are flatter than the gradients in the isolated galaxies (). These results are in agreement with those found by Kewley et al. (2010) in galaxy pairs. We interpreted that this shallower gradients can be explained by the action of inward and outward radial flows of interstellar gas (Krabbe et al., 2008). In isolated spirals, this mechanism seems to be weak or non existent.
N-body/SPH numerical simulations of equal-mass mergers predict that the radial metallicity gradients of the disk galaxies should flatten shortly after the first pericenter, due to radial mixing of gas (Rupke et al., 2010). Although AM 2322-821 is a system composed by galaxies of quite different mass ( 11 from the models in Section 4), our numerical simulations indicate that the current stage of the merger is be about 90 Myr after first passage, which agrees with the scenario proposed by the above authors.


In our previous work (Krabbe et al., 2008), we found that for the AM 2306-721 pair only the companion galaxy presented an oxygen abundance relatively homogeneous across the disc, while the main galaxy showed a clear radial oxygen abundance gradient. Both systems, AM 2306-721 and AM 2322-821, are morphologically similar. Each system is composed by a spiral and an irregular galaxy. However, the mass ratios estimated from the numerical simulations for AM 2306-721 is 2 and for AM 2322-821 is about 11; and the numerical simulations predicted that the evolution of the encounter was more violent and slower in AM 2306-721. Then if we assumed that there was an oxygen abundance gradient before the encounter in the main galaxies in both systems, why the gradient was not destroyed or flattened by the gas inflow in the main galaxy in AM 2306-721? One important point is that star-formation rate in the nuclear region of the main galaxy of AM 2306-721 is about 10 times higher than the one derived for AM 2322-821. These highest star-formation rate could have increased the heavy element content in the central regions and thus could have produced steeper gradients, and in these case, high gas inflow rate would be necessary to destroy or flatt the abundance gradient in the main galaxy of AM 2306-721.
7 Conclusions
An observational study of the effects of the interaction in the kinematics, stellar population, and abundances of the galaxy pair AM 2322-821 was conducted. The data consist of long-slit spectra in the wavelength range of 3 350 to7 130Å obtained with the Gemini Multi-Object Spetrograph at Gemini South. The main findings are the following:
-
1.
A fairly symmetric rotation curve for the companion (AM 2322B) galaxy with a deprojected velocity amplitude of 110 km s-1 is obtained, and a dynamical mass of within a radius of 4 kpc can be estimated using this deprojected velocity.
-
2.
Asymmetries in the radial velocity field were detected for companion, very likely due the interaction between the galaxies.
-
3.
In order to reconstruct the history of the AM 2322-821 system and to predict the evolution of the encounter, we modeled the interaction between AM 2322A and AM 2322B through numerical N-body/hydrodynamical simulations. The orbit that best reproduces the observational properties is found to be hyperbolic, with an eccentricity and perigalacticum of kpc; the current stage of the system would be about 90 Myr after perigalacticum.
-
4.
The companion galaxy is dominated by a very young (t yr) population, with the fraction of this population to the total flux at , increasing outwards in the galaxy disk.
-
5.
The stellar population of AM 2322A is heterogenous along of the slit positions observed.
-
6.
The oxygen abundance spatial profiles obtained for both galaxies are relatively homogeneous across the galaxy discs. The absence of an abundance gradient in these galaxies is interpreted as it having been destroyed by interaction-induced gas flows from the outer parts to the centre of the galaxy.
Acknowledgments
Based on observations obtained at the Gemini Observatory, which is operated by the Association of Universities for Research in Astronomy, Inc., under a cooperative agreement with the NSF on behalf of the Gemini partnership: the National Science Foundation (United States), the Science and Technology Facilities Council (United Kingdom), the National Research Council (Canada), CONICYT (Chile), the Australian Research Council (Australia), Ministério da Ciencia e Tecnologia (Brazil), and SECYT (Argentina).
The authors would like to thank Volker Springel for providing them with GADGET-2. I.Rogrigues also acknowledges Instituto Nacional de Pesquisas Espaciais - INPE/MCT, Brazil, for providing computer time in one of its clusters to run the simulations presented here. A. C. Krabbe thanks the support of FAPESP, process 2010/01490-3.q
We also thank Ms. Alene Alder-Rangel for editing the English in this manuscript.
References
- Allende Prieto et al. (2001) Allende Prieto, C., Lambert, D. L., & Asplund, M. 2001, ApJ, 556, L63
- Arp & Madore (1987) Arp, H. C., & Madore, B. F. 1987, A Catalogue of Southern Peculiar Galaxies and Associations 2 volume set, by Halton C. Arp and Barry F. Madore, pp. 504. ISBN 0521343364. Cambridge, UK: Cambridge University Press, May 1987
- Asari et al. (2007) Asari, N. V., Cid Fernandes, R., Stasińska, G., Torres-Papaqui, J. P., Mateus, A., Sodré, L., Schoenell, W., & Gomes, J. M. 2007, MNRAS, 381, 263
- Barton et al. (2000) Barton, E. J., Geller, M. J., & Kenyon, S. J. 2000, ApJ, 530, 660
- Barton Gillespie et al. (2003) Barton Gillespie, E., Geller, M. J., & Kenyon, S. J. 2003, ApJ, 582, 668
- Bender & Moellenhoff (1987) Bender, R., & Moellenhoff, C. 1987, A & A, 177, 71
- Bertola et al. (1991) Bertola, F., Bettoni, D., Danziger, J., Sadler, E., Sparke, L., & de Zeeuw, T. 1991, ApJ, 373, 369
- Bruzual & Charlot (2003) Bruzual, G., & Charlot, S. 2003, MNRAS, 344, 1000
- Cardelli et al. (1989) Cardelli, J. A., Clayton, G. C., & Mathis, J. S. 1989, ApJ, 345, 245
- Chabrier (2003) Chabrier, G. 2003, PASP, 115, 763
- Cid Fernandes et al. (2004) Cid Fernandes, R., Gu, Q., Melnick, J., Terlevich, E., Terlevich, R., Kunth, D., Rodrigues Lacerda, R., & Joguet, B. 2004, MNRAS, 355, 273
- Cid Fernandes et al. (2005) Cid Fernandes, R., Mateus, A., Sodré, L., Stasińska, G., & Gomes, J. M. 2005, MNRAS, 358, 363
- de Vaucouleurs et al. (1991) de Vaucouleurs, G., de Vaucouleurs, A., Corwin, H. G., Jr., Buta, R. J., Paturel, G., & Fouqué, P. 1991, Third Reference Catalogue of Bright Galaxies. Volume III: Data for galaxies between and ., by de Vaucouleurs, G.; de Vaucouleurs, A.; Corwin, H. G., Jr.; Buta, R. J.; Paturel, G.; Fouqué, P.. Springer, New York, NY (USA), 1991.
- Donzelli & Pastoriza (1997) Donzelli, C. J., & Pastoriza, M. G. 1997, ApJS, 111, 181
- Dors & Copetti (2005) Dors, O. L., Jr., & Copetti, M. V. F. 2005, A&A, 437, 837
- Dors & Copetti (2006) Dors, O. L., Jr., & Copetti, M. V. F. 2006, A&A, 452, 473
- Ellison et al. (2008) Ellison, S. L., Patton, D. R., Simard, L., & McConnachie, A. W. 2008, AJ, 135, 1877
- Faber & Gallagher (1979) Faber, S. M., & Gallagher, J. S. 1979, ARA&A, 17, 135
- Ferland (2002) Ferland, G. J. 2002, Hazy, a brief introduction to Cloudy 96.03, Univ. Kentucky, Dept. Phys., Astron. internal report
- Ferreiro & Pastoriza (2004) Ferreiro, D. L., & Pastoriza, M. G. 2004, A & A, 428, 837
- Ferreiro et al. (2008) Ferreiro, D. L., Pastoriza, M. G., & Rickes, M. 2008, A & A , 481, 645
- Friedli et al. (1994) Friedli, D., Benz, W., & Kennicutt, R. 1994, ApJ, 430, L105
- Geller et al. (2006) Geller, M. J., Kenyon, S. J., Barton, E. J., Jarrett, T. H., & Kewley, L. J. 2006, AJ, 132, 2243
- Henry & Worthey (1999) Henry, R. B. C., & Worthey, G. 1999, PASP, 111, 919
- Hernquist (1993) Hernquist, L. 1993, ApJS, 86, 389
- Howarth (1983) Howarth, I. D. 1983, MNRAS, 203, 301
- Hummer & Storey (1987) Hummer, D. G., & Storey, P. J. 1987, MNRAS, 224, 801
- Kennicutt et al. (1987) Kennicutt, R. C., Jr., Roettiger, K. A., Keel, W. C., van der Hulst, J. M., & Hummel, E. 1987, AJ, 93, 1011
- Kewley et al. (2001) Kewley, L. J., Dopita, M. A., Sutherland, R. S., Heisler, C. A., & Trevena, J. 2001, ApJ, 556, 121
- Kewley & Dopita (2002) Kewley, L. J., & Dopita, M. A. 2002, ApJS, 142, 35
- Kewley et al. (2006) Kewley, L. J., Geller, M. J., & Barton, E. J. 2006, AJ, 131, 2004
- Kewley & Ellison (2008) Kewley, L. J., & Ellison, S. L. 2008, ApJ, 681, 1183
- Kewley et al. (2010) Kewley, L. J., Rupke, D., Jabran Hahid, H., Geller, M. J., & Barton, E. J. 2010, ApJ,721,L48
- Krabbe et al. (2007) Krabbe, A. C., Rembold, S. B., & Pastoriza, M. G. 2007, MNRAS, 378, 569
- Krabbe et al. (2008) Krabbe, A. C., Pastoriza, M. G., Winge, C., Rodrigues, I., & Ferreiro, D. L. 2008, MNRAS, 389, 1593
- Lambas et al. (2003) Lambas, D. G., Tissera, P. B., Alonso, M. S., & Coldwell, G. 2003, MNRAS, 346, 1189
- Leitherer et al. (1999) Leitherer, C., et al. 1999, ApJS, 123, 3
- MacArthur et al. (2009) MacArthur, L. A., González, J. J., & Courteau, S. 2009, MNRAS, 395, 28
- Márquez et al. (2003) Márquez, I., Masegosa, J., Moles, M., Varela, J.,Bettoni, D., & Galletta, G. 2003, Ap&SS, 284, 711
- Mateus et al. (2006) Mateus, A., Sodré, L., Cid Fernandes, R., Stasińska, G., Schoenell, W., & Gomes, J. M. 2006, MNRAS, 370, 721
- McGaugh (1991) McGaugh, S. S. 1991, ApJ, 380, 140
- Michel-Dansac et al. (2008) Michel-Dansac, L., Lambas, D. G., Alonso, M. S., & Tissera, P. 2008, MNRAS, 386, L82
- Nikolic et al. (2004) Nikolic, B., Cullen, H., & Alexander, P. 2004, MNRAS, 355, 874
- Pagel et al. (1992) Pagel, B. E. J., Simonson, E. A., Terlevich, R. J., & Edmunds, M. G. 1992, MNRAS, 255, 325
- Peeples et al. (2009) Peeples, M. S., Pogge, R. W., & Stanek, K. Z. 2009, ApJ, 695, 259
- Pérez-Montero & Contini (2009) Pérez-Montero, E., & Contini, T. 2009, MNRAS, 398, 949
- Roy & Walsh (1997) Roy, J.-R., & Walsh, J. R. 1997, MNRAS, 288, 715
- Rupke et al. (2008) Rupke, D. S. N., Veilleux, S., & Baker, A. J. 2008, ApJ, 674, 172
- Rupke et al. (2010) Rupke, D. S. N., Kewley, L. J., & Barnes, J. E. 2010, ApJ, 710, L156
- Schlegel et al. (1998) Schlegel, D. J., Finkbeiner, D. P., & Davis, M. 1998, ApJ, 500, 525
- Sekiguchi & Wolstencroft (1992) Sekiguchi, K., & Wolstencroft, R. D. 1992, MNRAS, 255, 581
- Vila-Costas & Edmunds (1992) Vila-Costas, M. B., & Edmunds, M. G. 1992, MNRAS, 259, 121
- Sellwood & Wilkinson (1993) Sellwood, J. A., & Wilkinson, A. 1993, Reports on Progress in Physics, 56, 173
- Springel (2005) Springel, V. 2005, MNRAS, 364, 1105
- Woods & Geller (2007) Woods, D. F., & Geller, M. J. 2007, AJ, 134, 527