THE COMPLEXITY THAT THE FIRST STARS BROUGHT TO THE UNIVERSE: FRAGILITY OF METAL ENRICHED GAS IN A RADIATION FIELD
Abstract
The initial mass function (IMF) of the first (Population III) stars and Population II (Pop II) stars is poorly known due to a lack of observations of the period between recombination and reionization. In simulations of the formation of the first stars, it has been shown that, due to the limited ability of metal-free primordial gas to cool, the IMF of the first stars is a few orders of magnitude more massive than the current IMF. The transition from a high-mass IMF of the first stars to a lower-mass current IMF is thus important to understand. To study the underlying physics of this transition, we performed several simulations using the cosmological hydrodynamic adaptive mesh refinement code Enzo for metallicities of 10-4, 10-3, 10-2, and 10-1 . In our simulations, we include a star formation prescription that is derived from a metallicity dependent multi-phase interstellar medium (ISM) structure, an external UV radiation field, and a mechanical feedback algorithm. We also implement cosmic ray heating, photoelectric heating, and gasdust heating/cooling, and follow the metal enrichment of the ISM. It is found that the interplay between metallicity and UV radiation leads to the coexistence of Pop III and Pop II star formation in non-zero metallicity ( 10-2) gas. A cold (100 K) and dense (10-22 g cm-3) gas phase is fragile to ambient UV radiation. In a metal-poor ( 10-3) gas, the cold and dense gas phase does not form in the presence of a radiation field of 10-510-4 erg cm-2 s-1. Therefore, metallicity by itself is not a good indicator of the Pop IIIPop II transition. Metal-rich (10-2) gas dynamically evolves two to three orders of magnitude faster than metal-poor gas (10-3). The simulations including supernova explosions show that pre-enrichment of the halo does not affect the mixing of metals.
1 INTRODUCTION
In the last two decades, cosmological simulations have become an important tool for theoreticians to simulate the structure formation in the universe from the primordial density fluctuations. The cosmological model that currently matches the observations of the cosmic microwave background (CMB) best is the so-called cold dark matter (CDM) model. According to hierarchical structure formation (Press & Schechter, 1974), small clumps are the first to collapse and form structures, and then through mergers and the accretion of matter they build up larger structures. Cosmological simulations, based on the CDM model of hierarchical structure formation, predict that the first stars (30300 ) have formed at redshifts 20-30, in dark matter halos with masses of 106 (Tegmark et al., 1997; Abel et al., 2002; Bromm et al., 2002; Yoshida et al., 2003; O’Shea & Norman, 2007).
In the current literature, the first stars are called Population III (Pop III) stars. The metallicity of Pop III stars is so low that metal cooling does not have any effect on their formation. In the simulations of the formation of Pop III stars, it has been shown that, due to the limited ability of metal-free primordial gas to cool, the initial mass function (IMF) of Pop III stars is a few orders of magnitude more massive than the current IMF (Abel et al., 2002; Yoshida et al., 2006; Bromm et al., 2002). More recently, it has been suggested that Pop III stars are not necessarily that massive and can be in the range 10100 (Tumlinson, 2006, 2007a, 2007b). On the other hand, from observations of the nearby universe we know that the present day stellar mass scale is 0.3 (Kroupa, 2002; Chabrier, 2003).
The chemistry of zero metallicity (primordial) gas has been studied by a number of authors (Dalgarno & Lepp, 1987; Abel et al., 1997; Galli & Palla, 1998; Abel et al., 2001; Glover, 2008; Glover & Abel, 2008; Turk et al., 2011a). Once the gas has virialized in the potential wells of dark matter halos, additional cooling is required for the further collapse of the gas and to form stars. The formation of a star depends on the ability of interstellar gas to cool and form dense molecular clouds. The modest cooling ability of primordial gas leads to high masses for Pop III stars. The cooling efficiency of star forming gas will be significantly affected by the addition of radiation and metals after the formation of the first stars. Hence, the chemical composition and the radiation environment of interstellar gas are the key parameters to study.
The main coolants for primordial gas with temperatures 104 K are Ly emission of neutral atomic hydrogen (H I, 1216 Å), and ionized helium (He II, 304 Å). Below this temperature, the dominant coolant in primordial gas is molecular hydrogen (H2). Saslaw & Zipoy (1967) realized the importance of gas phase H2 formation in a primordial gas for the formation of protogalactic objects. At low densities ( 108 cm-3), H2 can form via intermediate ions H and H-. The cooling rate of H2 () scales with density as at low densities (), where radiative de-excitation dominates, and as at high densities ( 104 cm-3), where collisional de-excitation dominates. Molecular hydrogen does not have a permanent electric dipole moment while the hydrogen deuteride (HD) molecule does, which makes HD a better coolant than H2. Although the primordial deuterium abundance is small relative to hydrogen ( = 410-5), chemical fractionation leads to an enhancement of the ratio, 10-3 (Puy et al. (1993); Galli & Palla (1998); Stancil et al. (1998)). If primordial gas is significantly ionized then HD cooling can lower the temperature to the level of the CMB at 1020 (Johnson & Bromm, 2006).
When the first stars form, the universe becomes much more complex. According to their initial masses, they will either explode as core-collapse supernovae (10 140 ) or as pair instability supernovae (PISN; 140 260 , Heger & Woosley (2002)). Through these supernova explosions (SNe), the interstellar medium (ISM), and the intergalactic medium (IGM) will be enriched with metals. From that point on one has to take into account the cooling from the fine-structure lines of metals and the rotational transitions of molecules like CO. Moreover, gasdust heating/cooling can be important as well, in the sense that dust grains will be heated to at least the CMB temperature. Dust allows the efficient formation of H2 and HD (Cazaux & Spaans, 2004, 2009), and may collisionally heat/cool the gas depending on the sign of gas temperature minus dust temperature (Schneider et al., 2002). Also, dust grains attenuate UV radiation. For 10, CMB photons can be an excitation source (radiative pumping) of atomic and molecular levels (Smith et al., 2009). This allows the CMB temperature to act as a thermodynamic floor, below which gas cannot cool, provided that collisional de-excitation dominates the removal of population from excited states (Spaans & Silk (2000, 2005)). Furthermore, SNe will initiate shock waves that propagate through the ISM. These shock waves can heat up the ISM and cause a delay in the formation of the next generation of stars or can compress the gas, which makes it collapse and hence give rise to further star formation (Bromm et al., 2003; Springel & Hernquist, 2003; Whalen et al., 2008) .
The aim of this work is to (1) compute at what metallicity a cold and dense gas phase emerges and (2) assess the sensitivity of this phase to background UV radiation. This paper is structured as follows. In Section 2, we detail our cosmological/hydrodynamic simulation. Specifically, we discuss the relevant cooling and heating processes for star formation and the global characteristics of early star formation in primordial galaxies. In Section 3, we highlight the implications of our findings. Finally, in Section 4 we discuss our results and present our conclusions.
2 SIMULATIONS
In this work, we use the cosmological adaptive mesh refinement code Enzo (Bryan & Norman, 1997; O’Shea et al., 2004). We perform simulations in a three-dimensional periodic box with a side length of 1 , initialized at 99. The size of the root grid is 1283 with three nested subgrids, each refined by a factor of two. The finest grid has an effective resolution of 10243 with a side length of 125 . This resolution results in a dark matter and baryonic matter resolution of 2 and 0.4 , respectively. Refinement is restricted to the finest grid and occurs during the simulations whenever the baryonic matter, or dark matter density, is greater than the mean density by a factor of four or eight, respectively. The maximum level of refinement that is reached in the finest grid is eight. Refinement occurs such that the Jean length is always resolved by at least eight cells, this ensures that we meet the Truelove criterion, which requires the Jeans length to be resolved by at least four cells on each axis (Truelove et al., 1997). The virial mass of our progenitor halo at redshift 21 is = 3.4106 , where is the mass in a sphere that encloses an average dark matter overdensity of 200. We use Wilkinson Microwave Anisotropy Probe five-year cosmological parameters (Komatsu et al., 2009), which have the following values: = 0.7208, = 0.233, = 0.0462, = 0.9, and 0.701. Here, is the vacuum energy, is the matter density, is the baryon density, is the variance of random mass fluctuations in a sphere of radius 8 Mpc, and is the Hubble parameter in units of 100 km s-1 Mpc-1. We focus on a single halo with a dark matter mass of at 5 which is expected to be a typical mass for the halo population at that redshift.
For the analysis of our cosmological simulations we use YT, a cross-platform analysis toolkit written in Python(Turk, 2008; Turk et al., 2011b).
2.1 Cooling and Heating Processes in the ISM
Metal enriched gas cools more efficiently by fine-structure lines of [C II] (157.74 m), [O I] (63.18 m, 145.5 m), [Si II] (34.8 m), [Fe II] (25.99 m, 35.35 m), and rotational lines of CO than by HD or H2 emission (Santoro & Shull, 2006). In the outermost layers of a star-forming cloud, the so-called photon dominated region (PDR), temperatures can increase up to 1000 K due to a strong UV radiation field, and cooling results from the fine-structure lines of [C II] and [O I]. Deeper into the cloud, the temperature decreases to 30 K through the balance between cosmic ray and dust heating and low- CO rotational line cooling.
In our simulations, the gas is homogeneously pre-enriched to some non-zero metallicity at redshift of 30. We perform a series of simulations using cooling models for four different metallicities, 10-4, 10-3, 10-2, and 10-1 , derived from the chemical network of Meijerink & Spaans (2005). In their PDR code, they include cooling from fine-structure lines of carbon (C+ and C), oxygen (O), molecular lines from species like carbon monoxide (CO), H2, HD, and water (H2O). All level populations are computed under statistical equilibrium and the chemistry includes gas phase and grain surface formation of H2 and HD (Cazaux & Spaans, 2004, 2009) and line trapping using the multi-zone escape probability method of Poelman & Spaans (2005). The cooling tables that we use, depend on FUV radiation field strength, ambient gas velocity dispersion, temperature, metallicity, and H2 abundance. As such, they provide an accurate treatment of the thermal and chemical balance of low-metallicity PDRs. The radiation field strength () here is the flux between 6100 eV and it extends beyond 13.6 eV according to a starburst99 spectrum for a Salpeter IMF, i.e., the H II region is computed as part of the PDR. Typically, the UV flux diminishes very quickly beyond 13.6 eV. The cooling tables enjoy a range in irradiation (=10-2, 10-1, 100, 101, 102, 103, 104), H2 abundance (= 10-5, 10-4, 10-3, 10-2, 10-1, 0.2, 0.4, 0.5) and metallicity (10-4, 10-3, 10-2, 10-1, 1 ). We adopt Milky Way like abundance ratios based on the values of Asplund et al. (2005) and Jenkins (2004). A summary of our simulations is listed in Table 1.
At high column densities cooling and heating can be suppressed due to optical depth and dust opacity effects. In the case of an optically thick medium, a large part of the emitted photons are thus reabsorbed. This results in a lower critical density where the critical density is defined as the density at which the radiative de-excitation rate equals the collisional de-excitation rate. At densities much below the critical density (), radiative de-excitation dominates over collisional de-excitation, whereas at high densities (), collisions dominate the de-excitation process and the gas is in local thermodynamic equilibrium (LTE). Radiation is trapped if the opacity is concentrated on small physical scales which is the case in our simulations for the warm and dense gas. Since we do not resolve these PDR sub-structures in our simulations we approximate these opacity effects as follows.
We adopt a turbulent coherence length of 0.3 pc and a local turbulent velocity dispersion of 3 km s-1 to mimic the properties of a turbulent region. This yields a formal velocity gradient for scales larger than . When the cooling is either optically thin ( 1) or optically thick ( 1) the choice of and is not important. For the radiative transfer in the cooling lines (under statistical equilibrium), we use the multi-zone escape probability code of Poelman & Spaans (2005) . Each zone in a PDR is treated this way, and a correction to the cooling and heating rates due to line trapping and optical depth effects is derived. See Wada et al. (2009) for more details.
For an incident UV radiation field, photo-electric emission from (small) dust grains and polycyclic aromatic hydrocarbons is the dominant heating source in the neutral ISM. Dust grains can absorb an FUV photon which leads to the ejection of an electron, carrying some of the photon energy away in the form of kinetic energy. Then, through elastic collisions this excess kinetic energy heats up the gas. In our simulations we add photoelectric heating through
| (1) |
Here, is the radiation field attenuated by dust absorption and is given by
| (2) |
where 1, in Habing units, corresponds to a flux of 1.610-3 erg cm-2s-1, is the line-of-sight visual extinction at optical wavelengths caused by interstellar dust and the total number density of hydrogen is, = (H) + 2(H2) (Bakes & Tielens, 1994; Meijerink & Spaans, 2005). is the heating efficiency, dependent on , the kinetic gas temperature , and the electron density as /, and is given by
| (3) |
On the other hand, gas and dust temperatures are not equal in the ISM. At high number densities, 10 4.5 , gasdust heating/cooling becomes important and therefore we add gasdust heating/cooling into our simulations as given by (Meijerink & Spaans, 2005);
| (4) |
where is the dust temperature, is the gas temperature, and is the minimum grain size which we take as 1 m (Nozawa et al., 2003).
Deeper into a cloud the UV radiation is attenuated by dust and cosmic ray heating becomes important. Ionization by cosmic rays produces energetic electrons. Glassgold & Langer (1973) and Cravens & Dalgarno (1978) calculated that about 8 eV of heat is deposited in a molecular gas per primary ionization. Including helium ionization, Tielens & Hollenbach (1985) find for the heating rate
| (5) |
where is the cosmic ray ionization rate per H2 molecule. In our simulations, we scale with the derived star formation rate (SFR) of our simulations such that for an SFR of 1 yr-1 and a Salpeter-like IMF between 1 and 100 , we take to be 310-17s-1 (Spaans & Silk, 2005).
| Run | Metallicity | SFFB | G0 | |
|---|---|---|---|---|
| (Mpc) | () | (Habing) | ||
| Z1-G1 | 1 | 10-1 | No | 10-2 |
| Z2-G1 | 1 | 10-2 | No | 10-2 |
| Z3-G1 | 1 | 10-3 | No | 10-2 |
| Z4-G1 | 1 | 10-4 | No | 10-2 |
| Z1-G10 | 1 | 10-1 | No | 10-1 |
| Z2-G10 | 1 | 10-2 | No | 10-1 |
| Z3-G10 | 1 | 10-3 | No | 10-1 |
| Z4-G10 | 1 | 10-3 | No | 10-1 |
| ZS2 | 1 | 10-2 | Yes | 10-2 |
| ZS4 | 1 | 10-4 | Yes | 10-2 |
Note. — Column 1: Simulation name; Column 2: Simulation box size; Column 3: Simulation pre-enrichment; Column 4: Star formation and feedback; Column 5: UV background strength.
2.2 Star Formation
In order to understand the underlying physics of the transition from a high-mass IMF of Pop III stars to a lower mass current IMF we have run simulations for different metallicities and different UV radiation backgrounds and have incorporated the metal yields of SNe.
In our simulations where star formation is included, a star particle is formed when a grid cell has a density exceeding 0.01 cm-3 and a temperature below 104 K. We follow the hydrodynamic transport of metals produced by the SNe to the enrichment of halos. We do not use the chemical network of Enzo, except for the non-equilibrium formation of (rate
equation method of Anninos et al. (1997)) but our (, , Z/) cooling tables instead.
In order to compute the metal yield by the first stars we need to decide on some parameters like the mass of the halo, IMF of the first stars, star formation efficiency, and the number of SNe. From their simulations of pre-galactic structure formation, Machacek et al. (2001) determined that the minimum mass of a halo that hosts a massive primordial star is
| (6) |
where is the minimum halo mass that contains a cold dense core; is the fraction of gas that is cold ( 0.5 ) and dense ( 330 cm-3);,and is the flux within the LymanWerner (LW) bands in units of 10-21 erg s-1 cm-2 Hz-1. We choose = 0.02 for a typical UV background of 10-21 erg s-1 cm-2 Hz-1 sr-1, so that a halo with a minimum mass of 4.16106 can support cold dense gas which will eventually form a primordial star. Note here that = corresponds to a total UV flux of 4 erg s-1 cm-2 or 2.5. For a Salpeter like IMF, 1 corresponds to an SFR of about 3 yr-1 (10 kpc)-2.
High redshift, low mass galaxies are conjectured to have properties similar to those of local dwarf galaxies. In these galaxies the star formation efficiency, , ranges from 0.02 to 0.08 (Taylor et al., 1999). In this work we take 0.05.
3 RESULTS
3.1 Multi-phase ISM
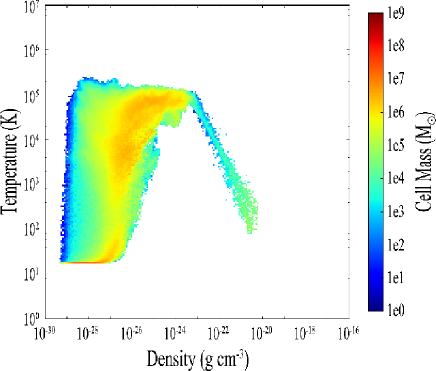
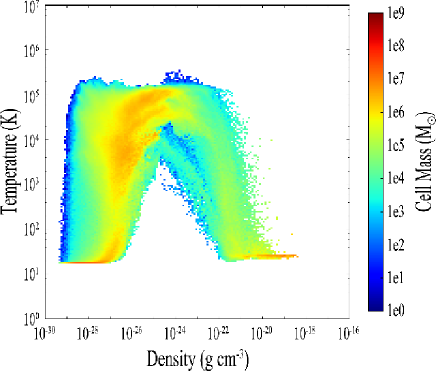
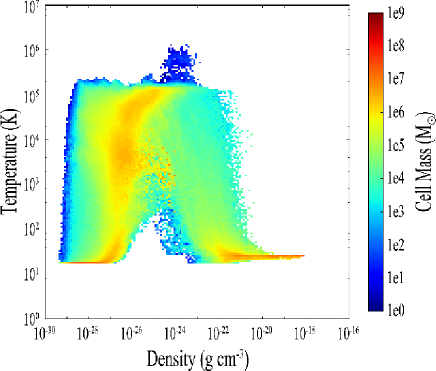
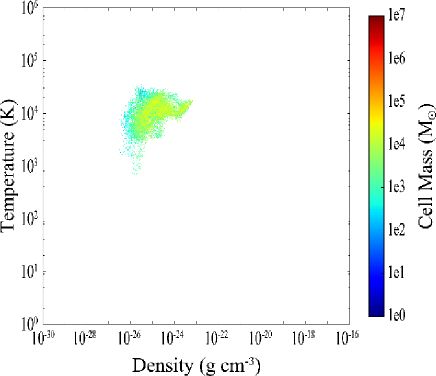
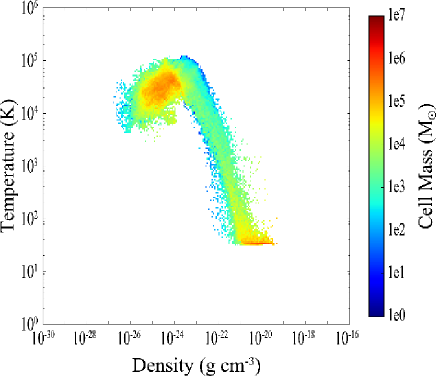
In our cosmological simulations for the Z2G1 and Z4G1 runs we find (as expected) that gas in the high-metallicity case cools down to lower temperatures and has higher densities than in the low-metallicity case. This is shown in Figure 1 where we plot the densitytemperature profile of a halo at redshift 5 for metallicities of Z = 10-4 (left) and =10-2 (right) and a radiation field of =10-2. In the high-metallicity case there is more gas in the central 50 kpc. This is because the cooling is more efficient, so that the gas has less pressure support against gravity and the halo accretes more material. When we look at the high densities ( 10-23 g cm-3) in these plots it is clear that in the high-metallicity case there is a lot more gas at low temperatures than in the low-metallicity case. This gas is identified as the cold and dense gas phase of the multi-phase ISM. The key feature here is that the redshift at which a multi-phase ISM is established depends on metallicity. This is shown in Figure 2 where we plot the densitytemperature profile of the same halo as shown in Figure 1 at 20 for metallicities of = 10-4 (left) and = 10-2 (right). We see here that the cold dense phase is completely lacking in the Z4G1 run whereas it is already present in the Z2G1 run. This means that metal-rich gas cools more efficiently and therefore the multi-phase ISM is established at earlier times in the higher metallicity case than in the lower metallicity case. These results are consistent with those of Jappsen et al. (2009), although they did not include background radiation.
Due to the shorter cooling time a halo in the metal-rich case evolves dynamically faster and becomes more compact at 5 compared to a metal-poorer halo. The effect of metallicity on a halo can be seen in Figure 3, which shows slices of the density, temperature, and the Jeans mass () of the central 1 kpc of a halo for the Z4G1 (top), Z2G1 (middle), and Z1G1 (bottom) runs in the (left column) and (right column) planes at redshift 5. We compute the Jeans mass as
| (7) |
where is the mass density, is the gravitational constant, is the Boltzmann constant, is the temperature, is the mass per particle, and is the hydrogen mass.
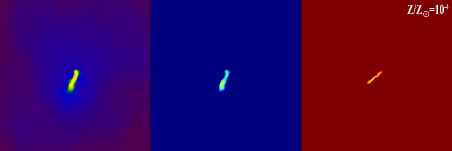
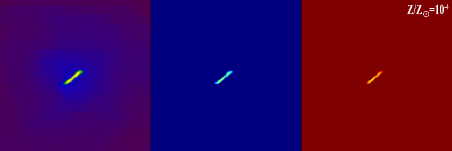
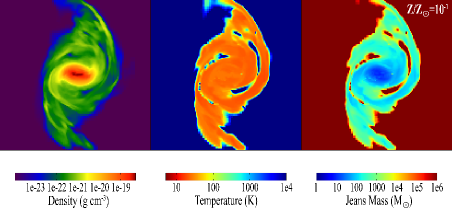
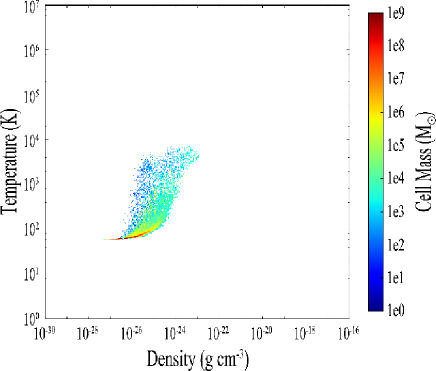
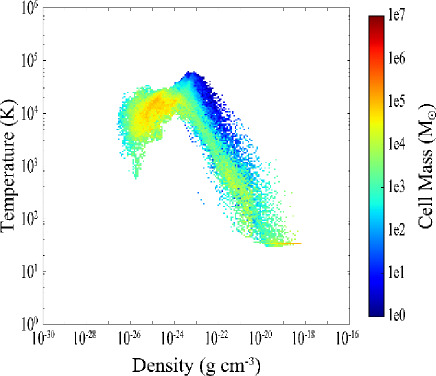
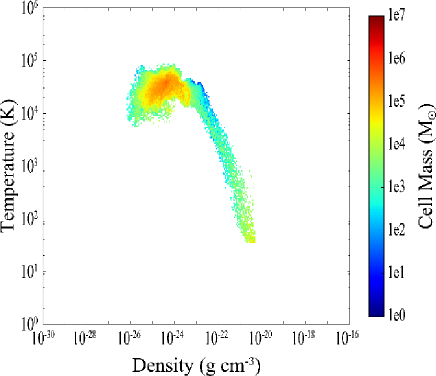
Because the high-metallicity gas ( 10-2) cools to lower temperatures, the Jeans mass in those runs is two orders of magnitude smaller than in the low-metallicity ( = 10-4) case. We also see that the Jeans masses for metallicities = 10-2 and = 10-1 are comparable. This is because above a metallicity of about = 10-2 the cooling efficiency of ambient gas no longer increases strongly with a rise in metallicity (Spaans & Meijerink, 2008). In Figure 4, we plot the densitytemperature profile of the central 50 kpc of a halo at 5 for the Z1G1 run. The phase diagrams of the runs Z1G1 (Figure 4) and Z2G1 (Figure 1, right) are indeed similar.
3.2 UV Background Radiation
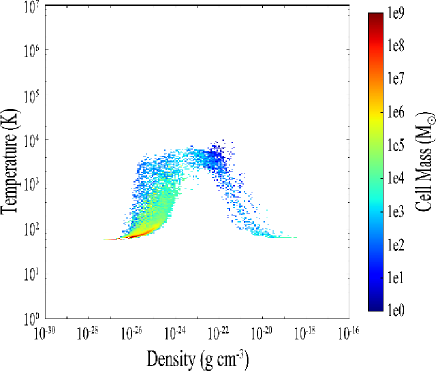
In order to see the effect of a UV radiation field on the evolution of gas we performed multiple simulations with different background radiation fields for the same metallicity. In Figure 5, we plot the densitytemperature profile of the central 2 kpc of a halo at 8 for metallicities of = 10-3 (top) and = 10-2 (bottom) with two different background radiation fields of = 10-2 (left) and = 10-1 (right). When we increase the radiation field for a metallicity of = 10-3, the cold and dense phase does not form anymore, which is clearly seen in the phase diagrams of Figure 5 : At densities above = 10-23 g cm-3 there is no cold gas present anymore in the Z3-G10 run (top right). This is because gas cannot cool down as efficiently as in the lower radiation field case due to more heat input and dissociation of H2 and CO. Thus, the halo takes more time to collapse and become condensed. In our simulations we followed the halo until redshift 5, and in the Z3G10 run the gas has still not collapsed at this redshift. On the other hand, in the = 10-2 case the cold dense phase survives regardless of irradiation. This indicates that the cold dense phase is fragile to UV radiation for metallicities of 10-3 and robust to UV radiation for metallicities of 10-2.
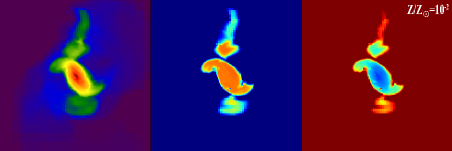
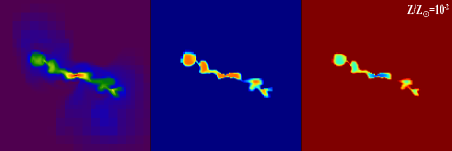
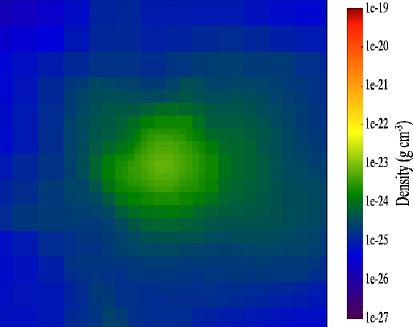
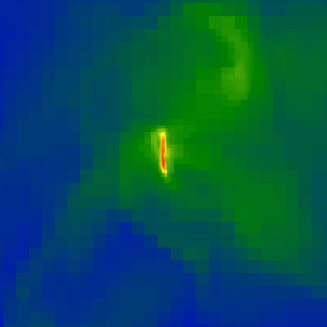
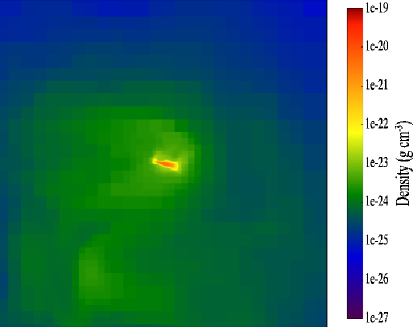
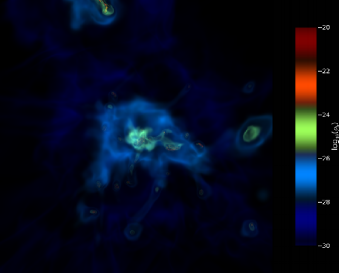
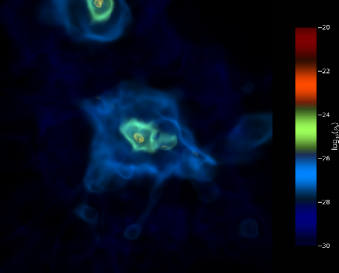
As is shown in Figure 6, where we plot the density profile of the central 2 kpc of a halo for the Z3G1 (top left), Z3G10 (top right), Z2G1 (bottom left), and Z2G10 (bottom right) runs, the effect of UV irradiation on the model galaxy morphology is large for = 10-3 and quite modest for = 10-2. In fact, we see that in the case of low metallicity and strong radiation field (Z3G10, top right) the compact disk-like structure is no longer formed, while in the higher metallicity and strong radiation field (Z2G10, bottom right) the disk-like structure is still present. This is because the high-metallicity gas is able to cool faster so that it collapses and reaches higher densities earlier in its evolution, and thus builds up column density to protect the cold and dense phase.
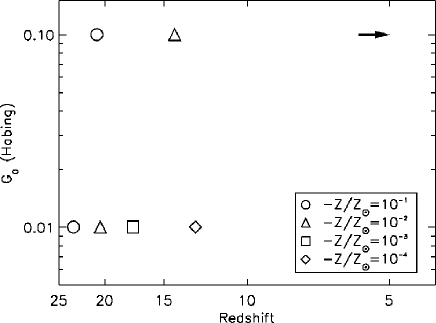
In Figure 7, we plot the redshift at which a multi-phase ISM is established depending on the metallicity and the radiation field. We find that, to first order, the cold and dense phase survives if the ratio / is smaller than 10-2 erg cm-2 s-1 in solar units.
All this has a significant influence on the subsequent star formation. The Jeans mass sets a typical value for a cloud to collapse gravitationally and fragment, depending on both temperature and density of the medium. Although the metal-enriched gas has a higher cooling efficiency than metal-poor gas, under the influence of a background radiation field the gas will stay hot and the Jeans mass will remain high. Therefore, the UV radiation background is a key parameter to take into account when studying the transition from Pop III to Pop II stars. In our simulations we see that including a constant radiation background raises the critical density value for this transition from 10-3.5 to 10-2 if 10-2 erg s-1 cm-2.
3.3 Dynamics
When we look at the density slices of the Z1G1 and Z2G1 runs in Figure 3 in the plane we see an elliptical spiral structure and in the plane a flattened structure. This is a disk-like distribution in three dimensions and is more extended and massive in the Z1G1 run ( 5109 ) than in the Z2G1 run ( 3.4109 ). Because the gas cools faster in the halo of the Z1G1 run, more gas is accreted and it settles faster into a disk than in the Z2G1 run.
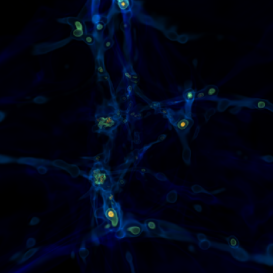
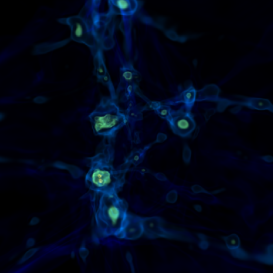
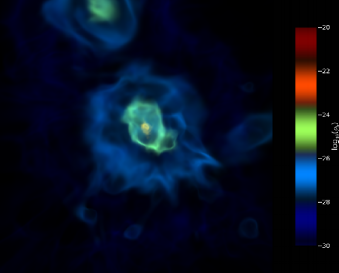
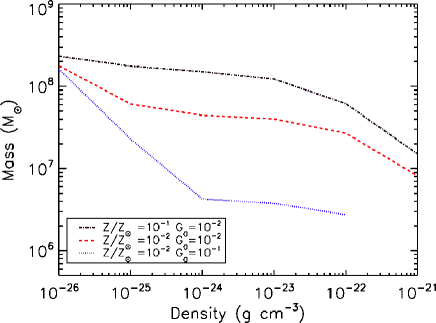
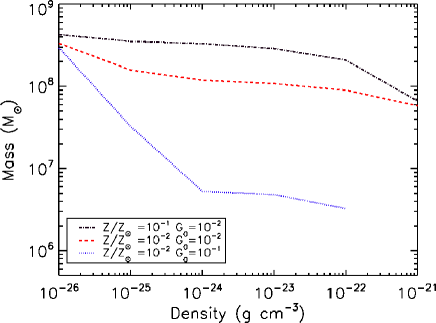
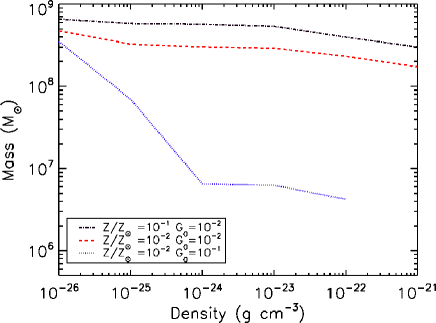
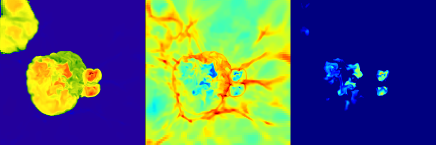
In Figure 8, which is a volume rendering plot, we show the three dimensions density snapshots of the Z1G1 (top), Z2G1 (middle), and Z2G10 (bottom) runs for redshifts 7.88 (left), 6.24 (middle), and 5 (right). We see that in the Z1G1 run more structures are formed and generally they have higher densities than in the Z2G1 and Z2G10 runs. When we look at the middle and bottom plots we clearly see the effect of UV irradiation on the evolution of a halo. In the Z2G10 run, structures are more fluffy and take more time to become dense and compact due to the heat input. In these plots fluffiness is represented by the spatial extent of the different colors. Although the halo in the Z1G1 run experiences multiple and more violent mergers as well as a higher rate of gas accretion, due to the faster cooling the halo at redshift 5 is denser and more compact than the Z2G1 case. In Figure 9, we plot the amount of mass for the densities indicated along the -axis and for redshifts 7.88 (left), z=6.24 (middle), and 5 (right). In these plots it is clearly seen that there is more mass at higher densities in the Z1G1 run than the Z2G1 run.


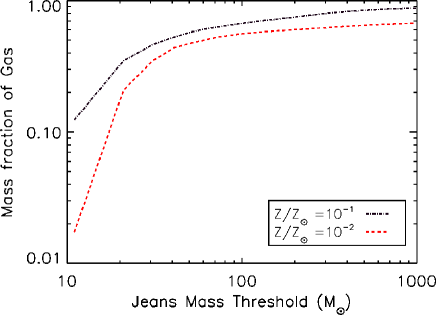
In Figure 10, we plot the fraction of the halo gas mass that has a Jeans mass () below a certain threshold value for the Z1G1 (blackdashes) and Z2G1 (reddots) runs. The profile of the low-metallicity case starts with a much steeper rise at low Jeans mass thresholds but then levels off for higher Jeans mass thresholds more rapidly than the high metallicity case. This initial steep rise seems to be due to a lack of low Jeans masses ( 30 ) in the central 1 kpc halo of the Z2G1 run. The fact that at any given threshold there is always a larger fraction of gas in the Z1G1 run shows that the Jeans mass is generally lower in the high metallicity case than in the low-metallicity case.
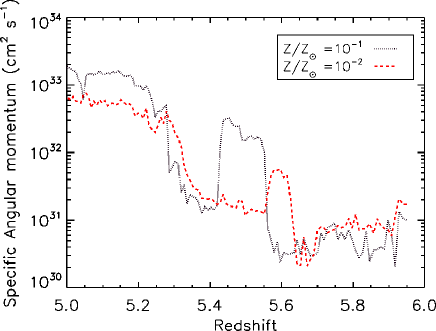
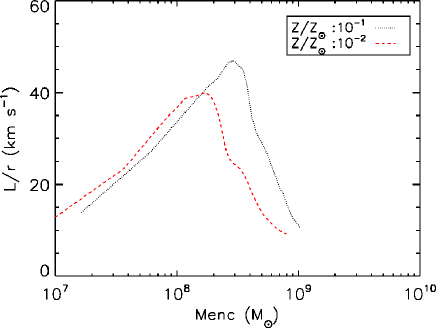
As previously mentioned, Figure 3 shows a disk-like structure for metallicities = 10-2 and = 10-1. In order to see if this disk-like structure is stable we plot the time evolution of specific angular momentum (see Figure 11). In this plot we see that the specific angular momentum increases with time indicating that the disk-like structure becomes more rotationally supported. We also see several peaks which are caused by recent merger events.
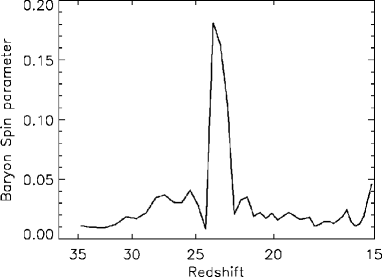
Next, we plot the spin parameter evolution of our main halo for the Z4G1 run (see Figure 12) . The spin parameter represents the degree of rotational support available in a gravitational system. We compute the dimensionless spin parameter (Peebles, 1969) as
| (8) |
where is the angular momentum, is the energy, is the mass of the object, and is the gravitational constant. Barnes & Efstathiou (1987) have calculated that the mean spin parameter is = 0.05 and it has been shown that halos which have suffered a recent major merger tend to have a higher spin parameter than the average (e.g., Hetznecker & Burkert (2006)). As is shown in Figure 12, the spin parameter of our halo peaks around redshift 24, where a recent major merger occurred, and overall it has a value of 0.04.
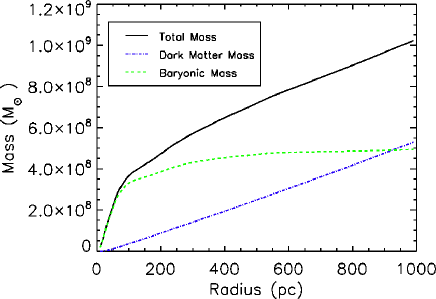
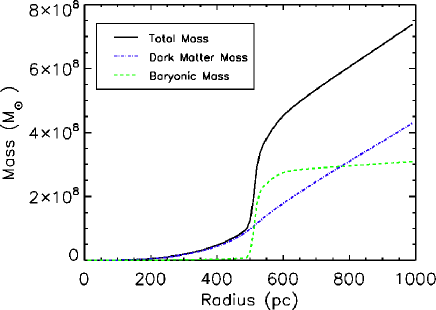
In Figure 13, we show the mass radial profiles of the Z1G1 and Z2G1 runs, top and bottom, respectively. In both runs, the inner parts of the halo are dominated by baryonic matter. On the other hand, in the Z2G1 run dark matter takes over at a smaller radius (700 pc) than in the Z1G1 run (950 pc). This is because in the Z1G1 run the halo is larger and more massive baryonically than in the Z2G1 run. Once more, this shows that the halo evolves dynamically slower in the low metallicity run.
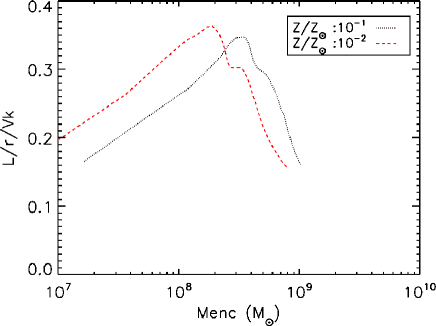
In Figure 14, we plot the mass-weighted rotational velocity () versus enclosed gas mass (top) and the ratio of rotational velocity to circular velocity versus enclosed gas mass (bottom) for the Z1G1 and Z2G1 runs. In both cases the typical rotational speed is 23 times lower than the circular velocity which means that the collapse of the halo is not delayed by rotational support (Wise et al., 2008).
3.4 Star Formation and Feedback
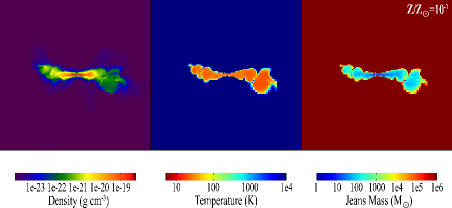
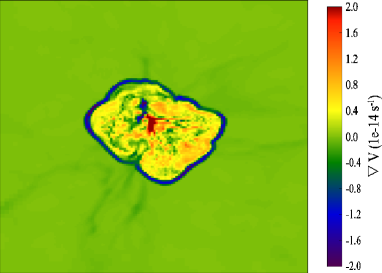
When we include star formation and mechanical feedback in our simulations we see that, in the case of = 10-4 pre-enrichment, the halo is further enriched up to = 10-1 by the SNe of the first stars as early as 18. In Figure 15, we present the metal fraction (top) and the velocity divergence (bottom) of the central 10 kpc around the halo a short time after the first Pop III SN exploded. In the velocity divergence plot, we see a clear ring-like structure with a large velocity gradient. This is due to the multiple outflows driven by SNe that collide with inflowing material. Also, the highest outflow velocities are right behind the shock front as expected.
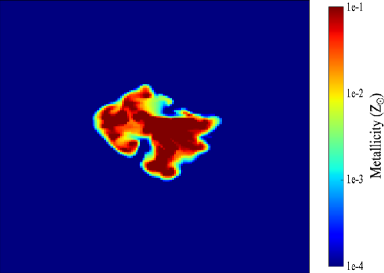
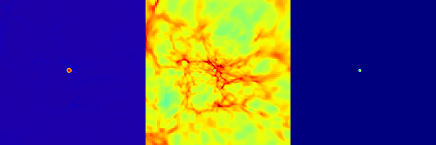
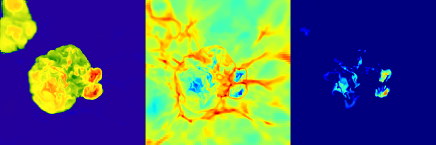
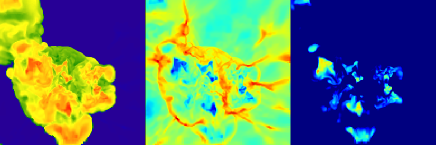
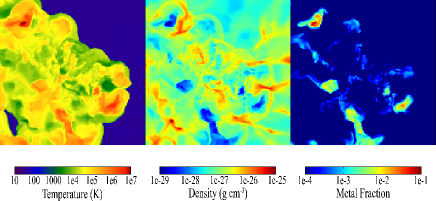
In Figure 16, where we plot time snapshots of temperature, density, and metallicity fraction of the central 25 kpc right after the first SNe, it is seen that the gas is heated to 104 K and expelled from the halo and hence infall of the outer halo gas onto the central core of the halo is quenched. The distribution of metals, provided by SNe, is very patchy. In the center of the halo, there are regions present with high metallicities, = 0.1, while in the outskirts of the halo the gas is still poor in metals. This indicates that SN feedback efficiently suppresses star formation in our enriched halos, irrespective of the ambient UV field.
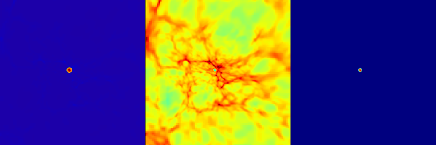
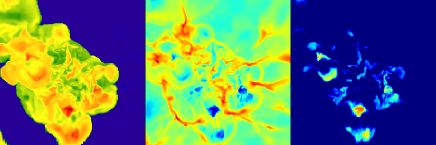
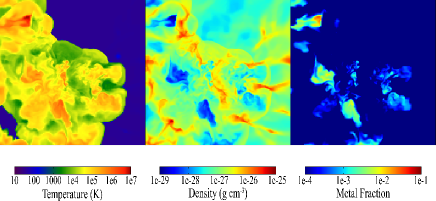
On the other hand, after the first SNe go off we do not see any significant difference in the distribution of metals in the halo for the pre-enriched runs with = 10-4 and = 10-2, as shown in Figure 16. This indicates that the higher densities in the high-metallicity run do not have any effect on the mixing of metals in the halo. There might be a cooling instability effect on the mixing of the metals produced by the SNe with the surroundings that we are not taking into account, but since the SN feedback is strong we think that this effect is negligible.
4 CONCLUSIONS AND CAVEATS
We summarize our results as follows.
- 1)
-
2)
Above a metallicity of 1 Solar the cooling efficiency of ambient gas no longer increases with a rise in metallicity (Spaans & Meijerink, 2008), and therefore the Jeans masses in halos that are pre-enriched to metallicities of = 10-2 and = 10-1 are comparable.
-
3)
The cold dense gas phase is fragile to UV radiation for metallicities of 10-3 and robust to UV radiation for metallicities of 10-2. Thus, the metal-poor star-forming ISM is fragile to UV radiation, and inclusion of a constant radiation background raises the critical metallicity value for the Pop IIIPop II transition from Zcr 10-3.5 to 10-2 when 10-5 erg s-1 cm-2, which is in good agreement with the values that are found for the suppression of H2 by Shang et al. (2010). This is because H2 is one of the main drivers of ionmolecule chemistry in metal-enriched gas and without it cooling is dominated by the fine-structure lines of [C II] and [O I] rather than CO.
-
4)
All the indicators for the dynamical evolution show that the halo evolves dynamically faster for 10-2 and that the cold and dense gas phase in high metallicity halos survives (violent) mergers due to the enhanced cooling.
-
5)
Pre-enrichment does not affect mixing of the metals that are produced by the first SNe.
For future work, our simulations can be improved in several ways. We reach down to a maximum resolution of 75 and 7 pc with and without star formation feedback in our simulations, respectively. This is not enough to resolve the smallest gas fragments that will eventually turn into stars. Our simulations also assume a constant ambient UV background field which might not be realistic because the UV radiation will originate from specific stellar sources. These sources are most likely to form in high-density areas and it would therefore be better to tie the UV background radiation to these sources at the time of their formation.
Another improvement can be made by adjusting the way we pre-enrich the simulations. Currently we assume one metallicity for a specific simulation. We do this so that we can confidently study specifically the metallicity effects on the evolution of our halo. However, the distribution of metals, that are formed by the first SNe, is not uniform but inhomogeneous. Therefore, in the near future we will perform simulations that consider patchy pre-enriched halos.
References
- Abel et al. (1997) Abel, T., Anninos, P., Zhang, Y., & Norman, M. L. 1997, New A, 2, 181
- Abel et al. (2001) Abel, T., Bryan, G. L., & Norman, M. L. 2001, in Astronomical Society of the Pacific Conference Series, Vol. 222, The Physics of Galaxy Formation, ed. M. Umemura & H. Susa, 129–+
- Abel et al. (2002) Abel, T., Bryan, G. L., & Norman, M. L. 2002, Science, 295, 93
- Anninos et al. (1997) Anninos, P., Zhang, Y., Abel, T., & Norman, M. L. 1997, New A, 2, 209
- Asplund et al. (2005) Asplund, M., Grevesse, N., & Sauval, A. J. 2005, in Astronomical Society of the Pacific Conference Series, Vol. 336, Cosmic Abundances as Records of Stellar Evolution and Nucleosynthesis, ed. T. G. Barnes III & F. N. Bash, 25–+
- Bakes & Tielens (1994) Bakes, E. L. O., & Tielens, A. G. G. M. 1994, ApJ, 427, 822
- Barnes & Efstathiou (1987) Barnes, J., & Efstathiou, G. 1987, ApJ, 319, 575
- Bromm et al. (2002) Bromm, V., Coppi, P. S., & Larson, R. B. 2002, ApJ, 564, 23
- Bromm & Loeb (2003) Bromm, V., & Loeb, A. 2003, Nature, 425, 812
- Bromm et al. (2003) Bromm, V., Yoshida, N., & Hernquist, L. 2003, ApJ, 596, L135
- Bryan & Norman (1997) Bryan, G. L., & Norman, M. L. 1997, in Astronomical Society of the Pacific Conference Series, Vol. 123, Computational Astrophysics; 12th Kingston Meeting on Theoretical Astrophysics, ed. D. A. Clarke & M. J. West, 363–+
- Cazaux & Spaans (2004) Cazaux, S., & Spaans, M. 2004, ApJ, 611, 40
- Cazaux & Spaans (2009) —. 2009, A&A, 496, 365
- Chabrier (2003) Chabrier, G. 2003, PASP, 115, 763
- Cravens & Dalgarno (1978) Cravens, T. E., & Dalgarno, A. 1978, ApJ, 219, 750
- Dalgarno & Lepp (1987) Dalgarno, A., & Lepp, S. 1987, in IAU Symposium, Vol. 120, Astrochemistry, ed. M. S. Vardya & S. P. Tarafdar, 109–118
- Galli & Palla (1998) Galli, D., & Palla, F. 1998, A&A, 335, 403
- Glassgold & Langer (1973) Glassgold, A. E., & Langer, W. D. 1973, ApJ, 179, L147+
- Glover (2008) Glover, S. 2008, in American Institute of Physics Conference Series, Vol. 990, First Stars III, ed. B. W. O’Shea & A. Heger, 25–29
- Glover & Abel (2008) Glover, S. C. O., & Abel, T. 2008, MNRAS, 388, 1627
- Heger & Woosley (2002) Heger, A., & Woosley, S. E. 2002, ApJ, 567, 532
- Hetznecker & Burkert (2006) Hetznecker, H., & Burkert, A. 2006, MNRAS, 370, 1905
- Jappsen et al. (2009) Jappsen, A., Klessen, R. S., Glover, S. C. O., & Mac Low, M. 2009, ApJ, 696, 1065
- Jenkins (2004) Jenkins, E. B. 2004, Origin and Evolution of the Elements, 336
- Johnson & Bromm (2006) Johnson, J. L., & Bromm, V. 2006, MNRAS, 366, 247
- Komatsu et al. (2009) Komatsu, E., et al. 2009, ApJS, 180, 330
- Kroupa (2002) Kroupa, P. 2002, Science, 295, 82
- Machacek et al. (2001) Machacek, M. E., Bryan, G. L., & Abel, T. 2001, ApJ, 548, 509
- Meijerink & Spaans (2005) Meijerink, R., & Spaans, M. 2005, A&A, 436, 397
- Nozawa et al. (2003) Nozawa, T., Kozasa, T., Umeda, H., Maeda, K., & Nomoto, K. 2003, ApJ, 598, 785
- O’Shea et al. (2004) O’Shea, B. W., Bryan, G., Bordner, J., Norman, M. L., Abel, T., Harkness, R., & Kritsuk, A. 2004, ArXiv Astrophysics e-prints
- O’Shea & Norman (2007) O’Shea, B. W., & Norman, M. L. 2007, ApJ, 654, 66
- Peebles (1969) Peebles, P. J. E. 1969, ApJ, 155, 393
- Poelman & Spaans (2005) Poelman, D. R., & Spaans, M. 2005, A&A, 440, 559
- Press & Schechter (1974) Press, W. H., & Schechter, P. 1974, ApJ, 187, 425
- Puy et al. (1993) Puy, D., Alecian, G., Le Bourlot, J., Leorat, J., & Pineau Des Forets, G. 1993, A&A, 267, 337
- Santoro & Shull (2006) Santoro, F., & Shull, J. M. 2006, ApJ, 643, 26
- Saslaw & Zipoy (1967) Saslaw, W. C., & Zipoy, D. 1967, Nature, 216, 976
- Schneider et al. (2002) Schneider, R., Ferrara, A., Natarajan, P., & Omukai, K. 2002, ApJ, 571, 30
- Shang et al. (2010) Shang, C., Bryan, G. L., & Haiman, Z. 2010, MNRAS, 402, 1249
- Smith & Sigurdsson (2007) Smith, B. D., & Sigurdsson, S. 2007, ApJ, 661, L5
- Smith et al. (2009) Smith, B. D., Turk, M. J., Sigurdsson, S., O’Shea, B. W., & Norman, M. L. 2009, ApJ, 691, 441
- Spaans & Meijerink (2008) Spaans, M., & Meijerink, R. 2008, ApJ, 678, L5
- Spaans & Silk (2000) Spaans, M., & Silk, J. 2000, ApJ, 538, 115
- Spaans & Silk (2005) —. 2005, ApJ, 626, 644
- Springel & Hernquist (2003) Springel, V., & Hernquist, L. 2003, MNRAS, 339, 289
- Stancil et al. (1998) Stancil, P. C., Lepp, S., & Dalgarno, A. 1998, ApJ, 509, 1
- Taylor et al. (1999) Taylor, C. L., Hüttemeister, S., Klein, U., & Greve, A. 1999, A&A, 349, 424
- Tegmark et al. (1997) Tegmark, M., Silk, J., Rees, M. J., Blanchard, A., Abel, T., & Palla, F. 1997, ApJ, 474, 1
- Tielens & Hollenbach (1985) Tielens, A. G. G. M., & Hollenbach, D. 1985, ApJ, 291, 722
- Truelove et al. (1997) Truelove, J. K., Klein, R. I., McKee, C. F., Holliman, II, J. H., Howell, L. H., & Greenough, J. A. 1997, ApJ, 489, L179+
- Tumlinson (2006) Tumlinson, J. 2006, ApJ, 641, 1
- Tumlinson (2007a) —. 2007a, ApJ, 665, 1361
- Tumlinson (2007b) —. 2007b, ApJ, 664, L63
- Turk (2008) Turk, M. 2008, in Proceedings of the 7th Python in Science Conference, ed. G. Varoquaux, T. Vaught, & J. Millman, Pasadena, CA USA, 46 – 50
- Turk et al. (2011a) Turk, M. J., Clark, P., Glover, S. C. O., Greif, T. H., Abel, T., Klessen, R., & Bromm, V. 2011a, ApJ, 726, 55
- Turk et al. (2011b) Turk, M. J., Smith, B. D., Oishi, J. S., Skory, S., Skillman, S. W., Abel, T., & Norman, M. L. 2011b, ApJS, 192, 9
- Wada et al. (2009) Wada, K., Papadopoulos, P. P., & Spaans, M. 2009, ApJ, 702, 63
- Whalen et al. (2008) Whalen, D., van Veelen, B., O’Shea, B. W., & Norman, M. L. 2008, ApJ, 682, 49
- Wise et al. (2008) Wise, J. H., Turk, M. J., & Abel, T. 2008, ApJ, 682, 745
- Yoshida et al. (2003) Yoshida, N., Abel, T., Hernquist, L., & Sugiyama, N. 2003, ApJ, 592, 645
- Yoshida et al. (2006) Yoshida, N., Omukai, K., Hernquist, L., & Abel, T. 2006, ApJ, 652, 6