X-ray selected Narrow-Line Seyfert 1 Galaxies
Abstract:
We present and discuss the properties of a complete and well defined sample of X-ray selected type 1 AGNs including 26 Narrow-Line Seyfert 1 and 129 Broad-Line Seyfert 1 galaxies derived from the XMM-Newton Bright Serendipitous Survey (XBS). We study the differences between the two classes of AGNs for what concerns the X-ray properties (the photon-index) and the main physical parameters, like the Black-Hole mass and the Eddington ratio. We then consider the two classes together and look for statistical correlations between observed and physical parameters. We find a significant dependence of the photon-index with the Eddington ratio and a weaker (possibly secondary) correlation between the photon index and the Black-Hole Mass.
1 Introduction
Narrow-Line Seyfert 1 (NLS1s) Galaxies have been identified as a peculiar AGN sub-class on the basis of their relatively narrow Balmer lines ([14]) and, in some cases, strong optical Fe II lines (e.g. [19]). Subsequently, it has been shown that NLS1 are statistically different from Broad-Line Seyfert 1 (BLS1) galaxies also for what concerns their X-ray properties, having - on average - steeper photon indices and a stronger soft-excess (e.g. [12], [7], [8], [1]), [9]). Considering the global class of type 1 AGN (NLS1+BLS1) a strict anti-correlation between the X-ray photon-index and the H width has been observed, with NLS1 occupying one extreme of the distribution ([2], [11], [8], [18], [17], [9]). The current interpretation of this result is that the physical driver of the correlation is the normalized accretion-rate, i.e. the Eddington ratio (L/LEdd), although it cannot be excluded that other parameters (like the Black-Hole Mass, MBH) can play an important role ([16], [15]). Clearly, the study of these correlations can shed light on the physical mechanisms at work in the inner part of an AGN, like the disk-corona connection (e.g. [10]).
Statistically complete and well-defined samples of type 1 AGNs are instrumental to study these fundamental correlations and their physical implications. The critical requirement of these samples, however, is to contain enough information, both in the optical and in the X-rays, to allow the computation of the main physical parameters (MBH, L/LEdd), from the one hand, and to carry out a reliable X-ray spectral analysis for all the sources, on the other hand. The joint availability of hard X-ray data, from XMM-Newton and Chandra, and of statistical relations that allow the systematic computation of MBH on large numbers of AGNs, has produced in the very recent years a big leap forward on this kind of study, allowing to extend the analysis on significantly larger samples, including up to a few hundreds of sources. Some of these studies are based on the exploitation of the large XMM-Newton database, concentrating either on the targets of the XMM-Newton observations (e.g. [1], [21], [18]) or on the serendipitous XMM-Newton detections of AGN included in the SDSS DR5 spectroscopic database ([17]). Usually, these studies are not based on purely flux-limited samples so the selection effects cannot be fully controlled.
We present here the analysis of the type 1 AGNs selected in the XMM-Newton Bright Serendipitous (XBS) survey ([6]). The XBS is a flux-limited survey with a very high identification (spectroscopic) level, something that makes its statistical exploitation highly reliable. Thanks to the relatively high flux limit of the survey all the sources are detected with a number of net-counts that is reasonably large to perform a reliable X-ray spectral analysis. The analysis of all the 300 AGN has been already concluded and published ([5]) and we can now study the statistical dependences of the photon index (computed in the XMM-Newton 0.5-12 keV energy range) with other physical parameters. In Section 2 we present the sample and the classification criteria adopted to separate NLS1 from BLS1. We also briefly outline the procedure used to estimate of the physical parameters (MBH and L/LEdd). In Section 3 we study the statistical correlations observed between the computed photon-index and both the Black-Hole Mass and the Eddington ratio. The conclusions are summarized in Section 4.
2 NLS1 and BLS1 in the XBS survey
The XMM-Newton Bright Serendipitous Survey (XBS survey, [6]) is a wide-angle (28 sq. deg) high Galactic latitude (20 ) survey based on the XMM-Newton archival data. It is composed of two samples both flux-limited (710-14 erg cm-2 s-1) in two separate energy bands: the 0.5-4.5 keV band (the Bright Serendipitous Sample, BSS) and the “hard” 4.5-7.5 keV band (the Hard Bright Serendipitous Sample, HBSS). A total of 237 (211 for the HBSS sample) independent fields have been used to select 400 sources, 389 belonging to the BSS sample and 67 to the HBSS sample (56 sources are in common). The details on the fields selection strategy, the source selection criteria and the general properties of the 400 objects are discussed in [6]. To date, the spectroscopic identification level has reached 92% but, for what concerns the type 1 AGN, the identification level is close to 100%. The results of the spectroscopic campaigns are discussed in [4], [3].
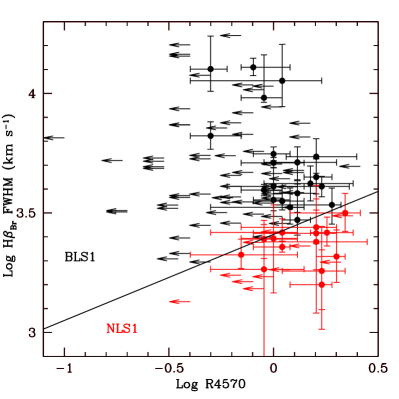
In total, the XBS sample contains about 300 AGN out of which 170 have a redshift low enough (below 0.8) to allow the sampling of the spectral region around the H line. This region is important to correctly classify an AGN as NLS1. We adopt here the classification criterion suggested by [19] which is based on the strenght of the Fe4570Å in respect to the H total (broad+narrow) flux (the R4570 parameter) and the width of the H broad component. According to the authors, this classification criterion is physically more meaningful to separate NLS1 from BLS1 in respect to a method based on the H width alone. In any case, it is clear also from the analysis of the XBS sample that type 1 AGN are uniformly distributed in the R4570/H FWHM parameter space so a separation between NLS1 and BLS1 is always somewhat arbitrary. To compute these quantities we have first subtracted from the spectrum an iron template and fitted the resulting data with a model composed by 4 Gaussians plus a PL continuum. Two Gaussians are used to model the narrow and the broad H line and two are used to model the 2 narrow [OIII] lines. In Fig. 1 we report the R4570 and the H width for all the type 1 AGN of the sample together with the dividing line proposed by [19] to separate NLS1 from BLS1. Using these criteria, we have found 26 NLS1 (26 in the BSS and 7 in the HBSS) and 129 BLS1. NLS1 represent about 17% (1 range [14%-20%]) of the AGN1 in the XBS for which the classification can be applied (i.e. with z0.8). No significant difference in terms of fraction of NLS1 between BSS and HBSS has been found, considering the statistical errors.
For all the NLS1 and BLS1 of the survey we have determined both the fundamental physical parameters (Black-Hole Masses and Eddington ratios) and the X-ray properties. A few details are given below.
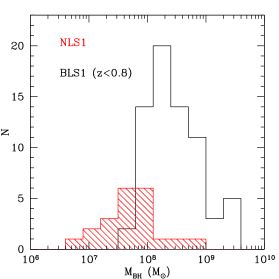
Black-Hole Mass - We have estimated the Black-Hole Masses using the broad H component and applying the recipes discussed in [20]. No correction for the radiation pressure has been applied. As expected, the MBH distribution of NLS1 and BLS1 (Fig. 2, top-left) are significantly (KS D=0.71, probability1%) different.
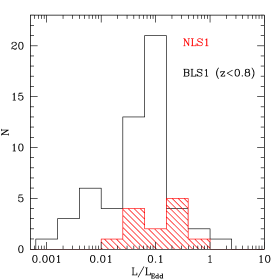
Eddington-ratio - To compute the Eddington-ratios we have used the bolometric luminosities calculated by [13] by fitting the optical/UV Spectral Energy Distributions built using the available UV (GALEX) and optical data. Again, the two distributions of Eddington-ratio of NLS1 and BLS1 are statistically different (K-S test D=0.47, probability1%, Fig. 2, top-right).
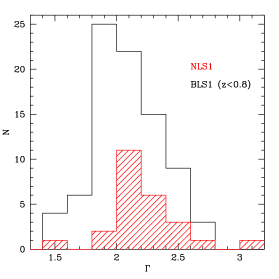
Photon-index - A systematic X-ray analysis has been carried out on all the AGN of the XBS survey. The X-ray spectra have been fitted using, as basic model, an absorbed power-law plus, in some cases, additional components like a soft excess, an emission line or a reflected component (see [5] for details). In Fig. 2 (bottom) we show the distribution of the photon indices computed for the BLS1 and NLS1 (with z0.8) separately. The two distributions are statistically different (K-S test D=0.32, probability = 2.7%) although we clearly observe a large spread of values in both samples: even if the NLS1 preferentially have steep (2) spectral indices, we still observe a small number of flat indices. At the same time, many BLS1 show steep indices similar to those observed in NLS1. The presence of relatively “flat” NLS1s has been already pointed out in the literature (e.g. [21]).
3 X-ray spectral index vs. physical parameters: the role of NLS1s
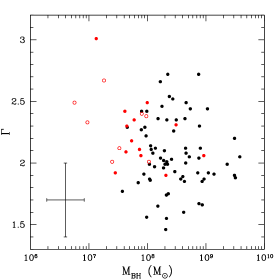
In Fig. 3 we show the values of versus the estimated values of MBH and L/LEdd while, in Tab. 1, we report the significance of the correlations. For a small number of objects the computation of L/LEdd was not possible because of the lack of UV data. A significant (95%)/highly significant (99%) anti-correlation/correlation is found between and MBH and L/LEdd respectively. We have tested the importance of the NLS1 in the observed correlations, by excluding them from the analysis. If we consider just the BLS1 the only existing correlation is the one between and L/Ledd although the significance is marginal (90%). The fact that /MBH correlation disappears when we consider only the BLS1 is probably related to the fact that the lowest values of MBH (5107 M) are covered almost exclusively by the NLS1 and, therefore, their exclusion limits significantly the dynamic range of the distribution. This is not the case for what concerns the L/LEdd ratio whose dynamic range is not significantly affected by the exclusion of NLS1s.
Since MBH and L/LEdd are clearly coupled, it is possible that the two observed correlations are not independent. In order to establish if this is the case and in order to assess which is the primary correlation, we have run the Spearman rank test between and one of the two parameters, by excluding the dependence of the third one (see Tab. 1). While the –L/Ledd correlation remains significant even after the exclusion of the dependence on MBH, the –MBH correlation strongly weakens when the dependence on L/Ledd is considered. We conclude that the –L/Ledd correlation is probably the primary dependence while the –MBH could be just a secondary one. These results are consistent with recent studies based on XMM-Newton or Swift-XRT data ([18], [17], [9]).
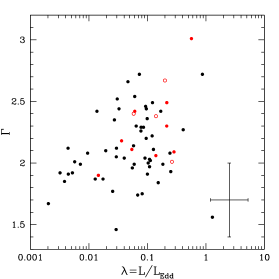
A similar correlation between the soft (E2.4 keV) and L/LEdd has been found a few years ago by [11] and [8] using ROSAT data. Since the soft X-rays are potentially contaminated by the soft-excess a possible interpretation of the observed correlation was that the soft-excess, and not the intrinsic slope of the X-ray spectrum, was related to the Eddington ratio. The fact that this correlation is now confirmed also using hard (0.5-12 keV) X-ray data, where the contamination from the soft-excess is lower, supports the idea that it is the intrinsic spectral slope that correlates with the Eddington ratio. The physical implications of this result are many. It is possible, for instance, that the large number of seeds photons from the accretion disk, connected to a high accretion rate, are responsible for a more efficient cooling of the corona electrons thus producing a steeper X-ray spectrum, as recently suggested by [10].
| vs MBH | vs L/LEdd | vs MBH | vs L/LEdd | |
|---|---|---|---|---|
| (excluding L/LEdd) | (excluding MBH) | |||
| (1) | (2) | (3) | (4) | |
| BLS1+NLS1 | significant | highly significant | no correlation | significant |
| (95%) | (99%) | (95%) | ||
| BLS1 | no correlation | marginal | no correlation | marginal |
| (90%) | (90%) |
4 Summary and conclusions
We have presented the properties of a sample of 26 NLS1 and 129 BLS1 extracted from the XBS survey that has a complete optical and X-ray spectral characterization. We have compared the X-ray photon-indices, derived from the XMM-Newton data, of NLS1 and BLS1 and searched for possible correlations between and the fundamental physical parameters, like the Black-Hole Mass and the Eddington ratio. The conclusions can be summarized as follows:
-
•
The NLS1/AGN1 fraction in our X-ray selected sample is 17% (1=[14%-20%]), taking into account the limit of applicability of the classification criteria (z¡0.8). We do not observe any significant dependence of this fraction with the X-ray selection band (0.5-4.5 keV vs. 4.5-7.5 keV);
-
•
The NLS1 are characterized by a photon-index which is (on average) steeper when compared to BLS1, by a higher Eddington ratio and by a smaller Black-Hole Mass;
-
•
We find that the X-ray spectral index significantly correlates with the Eddington ratio. This result is in line with recent studies based on XMM-Newton/Swift-XRT data ([18], [17], [9]) and with similar results based on the analysis of the soft (2keV) photon index ([11], [8]). The fact that NLS1s have, on average, steeper X-ray spectral indices than BLS1 is probably the consequence of their (on-average) high values of L/LEdd;
-
•
We find another possible correlation of with MBH although the partial correlation analysis shows that this is likely a secondary correlation induced by the -L/LEdd dependence.
Acknowledgments
The authors acknowledge financial support from ASI (grant n. I/088/06/0, COFIS contract and grant n. I/009/10/0).
References
- [1] S. Bianchi, N. F. Bonilla, M. Guainazzi, G. Matt, and G. Ponti: CAIXA: a catalogue of AGN in the XMM-Newton archive. II. Multiwavelength correlations, A&A 501 (2009) 915.
- [2] T. Boller, W. N. Brandt, and H. Fink: Soft X-ray properties of narrow-line Seyfert 1 galaxies., A&A 305 (1996) 53 .
- [3] A. Caccianiga, and 14 colleagues: The XMM-Newton bright serendipitous survey. Identification and optical spectral properties, A&A 477 (2008) 735.
- [4] A. Caccianiga, P. Severgnini, R. Della Ceca, T. Maccacaro, F. J. Carrera, and M. J. Page: Elusive AGN in the XMM-Newton bright serendipitous survey, A&A 470 (2007) 557.
- [5] A. Corral, R. Della Ceca, A. Caccianiga, P. Severgnini, H. Brunner, F. J. Carrera, M. J. Page, and A. D. Schwope: The X-ray spectral properties of the AGN population in the XMM-Newton bright serendipitous survey, A&A 530 (2011) A42.
- [6] R. Della Ceca et al.:Exploring the X-ray sky with the XMM-Newton bright serendipitous survey, A&A 428 (2004) 383.
- [7] I. M. George, T. J. Turner, T. Yaqoob, H. Netzer, A. Laor, R. F. Mushotzky, K. Nandra, and T. Takahashi: X-Ray Observations of Optically Selected, Radio-quiet Quasars. I. The ASCA Results, ApJ 531 (2000) 52 .
- [8] D. Grupe: A Complete Sample of Soft X-Ray-selected AGNs. II. Statistical Analysis, AJ 127 (2004) 1799.
- [9] D. Grupe, S. Komossa, K. M. Leighly, and K. L. Page: The Simultaneous Optical-to-X-Ray Spectral Energy Distribution of Soft X-Ray Selected Active Galactic Nuclei Observed by Swift, ApJS 187 (2010) 64.
- [10] W. Ishibashi and T. J.-L. Courvoisier: X-ray power law spectra in active galactic nuclei, A&A 512 (2010) A58.
- [11] A. Laor, F. Fiore, M. Elvis, B. J. Wilkes, and J. C. McDowell: The Soft X-Ray Properties of a Complete Sample of Optically Selected Quasars. II. Final Results, ApJ 477 (1997) 93.
- [12] K. M. Leighly: A Comprehensive Spectral and Variability Study of Narrow-Line Seyfert 1 Galaxies Observed by ASCA. II. Spectral Analysis and Correlations, ApJS 125 (1999) 317 .
- [13] E. Marchese et al. 2011, in preparation
- [14] D. E. Osterbrock and R. W. Pogge: The spectra of narrow-line Seyfert 1 galaxies, ApJ 297 (1985) 166.
- [15] E. Piconcelli, E. Jimenez-Bailón, M. Guainazzi, N. Schartel, P. M. Rodríguez-Pascual, and M. Santos-Lleó: The XMM-Newton view of PG quasars. I. X-ray continuum and absorption, A&A 432 (2005) 15.
- [16] D. Porquet, J. N. Reeves, P. O’Brien, and W. Brinkmann: XMM-Newton EPIC observations of 21 low-redshift PG quasars, A&A 422 (2004) 85.
- [17] G. Risaliti, M. Young, and M. Elvis: The Sloan Digital Sky Survey/XMM-Newton Quasar Survey: Correlation Between X-Ray Spectral Slope and Eddington Ratio, ApJ 700 (2009) L6.
- [18] O. Shemmer, W. N. Brandt, H. Netzer, R. Maiolino, and S. Kaspi: The Hard X-Ray Spectrum as a Probe for Black Hole Growth in Radio-Quiet Active Galactic Nuclei, ApJ 682 (2008) 81.
- [19] M.-P. Véron-Cetty, P. Véron, and A. C. Gonçalves: A spectrophotometric atlas of Narrow-Line Seyfert 1 galaxies, A&A 372 (2001) 730.
- [20] M. Vestergaard and B. M. Peterson: Determining Central Black Hole Masses in Distant Active Galaxies and Quasars. II. Improved Optical and UV Scaling Relationships, ApJ 641 (2006) 689.
- [21] X.-L. Zhou and S.-N. Zhang: A Comparison of Hard X-ray Photon Indices and Iron K Emission Lines in X-ray Luminous Narrow- and Broad-line Seyfert 1 Galaxies, ApJ 713 (2010) L11.