Present address: ]Department of Applied & Computational Math, California Institute of Technology, Pasadena, CA 91125
Dynamical Behavior Near a Liquid-Liquid Phase Transition in Simulations of Supercooled Water
Abstract
We examine the behavior of the diffusion coefficient of the ST2 model of water over a broad region of the phase diagram via molecular dynamics simulations. The ST2 model has an accessible liquid-liquid transition between low-density and high-density phases, making the model an ideal candidate to explore the impacts of the liquid-liquid transition on dynamics. We locate characteristic dynamical loci in the phase diagram and compare them with the previously investigated thermodynamic loci. The low-density liquid phase shows a crossover from non-Arrhenius to Arrhenius behavior, signaling the onset of a crossover from fragile-to-strong behavior. We explain this crossover in terms of the asymptotic approach of the low-density liquid to a random tetrahedral network, and show that the temperature dependence of the diffusion coefficient over a wide temperature range can be simply related to the concentration of defects in the network. Our findings thus confirm that the low-density phase of ST2 water is a well-defined metastable liquid.
I Introduction
It has long been appreciated that water, the most important of all liquids, defies description in terms of simple liquid behavior in most respects Eisenberg and Kauzmann (1969); Franks (1972). Many of the anomalies of the thermodynamic and transport properties can be attributed to the hydrogen bonds that dominate the intermolecular interactions Stanley and Teixeira (1980); Geiger and Stanley (1982); Blumberg et al. (1984); Sciortino et al. (1990); Starr et al. (1999); Han et al. (2009). Of the many important studies of water conducted over the last several decades, the 1992 proposal that a liquid-liquid phase transition (LLPT) occurs in supercooled water has had a particularly significant impact on water research Poole et al. (1992). In this proposal, two phases of liquid water, a low density liquid (LDL) and a high density liquid (HDL), become distinct below a critical point located in the supercooled regime of the phase diagram. H. E. Stanley and co-workers have pursued the implications of this proposal over the last 20 years Sastry et al. (1993); Poole et al. (1993, 1993, 1994); Sastry et al. (1996); Harrington et al. (1997); Sciortino et al. (1997); Sadr-Lahijany et al. (1998); Mishima and Stanley (1998); Starr et al. (1999); Meyer and Stanley (1999); Scala et al. (2000); Franzese et al. (2001); Giovambattista et al. (2002); Yamada et al. (2002); Starr et al. (2003); Buldyrev and Stanley (2003); Giovambattista et al. (2003); Skibinsky et al. (2004); Giovambattista et al. (2005); Xu et al. (2005); Giovambattista et al. (2005); Kumar et al. (2005, 2006, 2007); Yan et al. (2008); Xu et al. (2009, 2009); Stokely et al. (2010), and much has been learned about the impact of a liquid-liquid transition on the properties of water and related systems Mishima and Stanley (1998); Debenedetti and Stanley (2003).
The LLPT proposal remains controversial because its confirmation via experiments on the bulk liquid has been thwarted by rapid ice nucleation at the conditions at which the critical point is predicted to occur; bulk studies of the ice melting lines provide indirect evidence of a transition Mishima and Stanley (1998). The central strength of the LLPT proposal is that it rationalizes the thermodynamical and dynamical anomalies of the supercooled liquid while, at the same time, it accounts for the occurrence in experiments of two widely different forms of amorphous solid water (low density and high density amorphous ice) as the sub-glass-transition manifestations of the LDL and HDL phases Mishima et al. (1985); Poole et al. (1993); Mishima (1994); Angell (2004); Giovambattista et al. (2003, 2005); Loerting and Giovambattista (2006). Indeed, the possibility of a LLPT has now been investigated across the entire class of liquids in which tetrahedral bonding dominates the local structure. This class of systems includes water, Si Sastry and Angell (2003), SiO2 Poole et al. (1997), and BeF2 Hemmati et al. (2001), as well as nanoparticle liquids tailored to exhibit tetrahedral interactions Hsu et al. (2008); Dai et al. (2010). Additionally, it has also been shown that liquids with symmetric interactions, but with a competition between low density and high density packings, may also exhibit LLPT behavior Franzese et al. (2001); Buldyrev and Stanley (2003); Skibinsky et al. (2004); Kumar et al. (2005).
Due to the challenges imposed by crystallization on experiments of supercooled water, computer simulations have played a central role in the development of the LLPT proposal for water, and other tetrahedral liquids. While a LLPT occurs in a variety water models, one of the most accessible and clearest examples is in the venerable ST2 model Stillinger and Rahman (1974), one of the earliest point-charge models for water. “ST2 water” has been extensively studied to clarify the nature of such a LLPT, in particular with regard to thermodynamic and structural properties Poole et al. (1992, 1993); Sciortino et al. (1997); Harrington et al. (1997); Paschek and Geiger (1999); Poole et al. (2005); Liu et al. (2009); Cuthbertson and Poole (2011). While much is known about the dynamics of ST2 water Sciortino and Fornili (1989); Sciortino et al. (1992, 1990, 1990, 1991); Paschek and Geiger (1999); Becker et al. (2006); Kumar et al. (2007) a comprehensive study of the dynamical properties comparable in scope to the thermodynamic studies is lacking. Therefore, in the present work, we focus on the dynamical properties of the ST2 model over a wide range of states that encompasses the vicinity of the LLPT. We show that there are striking differences in the nature of the dynamics of the HDL and LDL phases. The LDL phase presents a particular challenge, as the relaxation time of the liquid increases extremely rapidly with decreasing temperature . However, our results demonstrate that the equilibrium dynamical properties of the LDL phase can be understood from the behavior observed in the region accessible to our simulations. These results emphasize the central role of the developing network of hydrogen bonds for understanding the behavior of the liquid, especially of the LDL phase.
II Simulations
Our data are generated via molecular dynamics simulations of the ST2 potential Stillinger and Rahman (1974). The simulations follow the same protocol as those in Ref. Poole et al. (2005). Specifically, we attempt simulations at thermodynamic state points in the density range g/cm3 to 1.20 g/cm3 at intervals g/cm3, and the temperature range K to 400 K at intervals of K. At each state point considered, we simulate molecules, unless noted otherwise. We are able to equilibrate the liquid at all chosen densities for K; for K, the lowest density studied is limited by the extreme length of simulation required. In total, we examine more than 1500 different state points. The configurations used to start simulations are the final configurations from Ref. Poole et al. (2005), where a detailed equation of state (EOS) of ST2 water was evaluated. Each simulation is run until the mean-squared displacement (MSD) of oxygen atoms reaches 1 nm2 (roughly three interparticle spacings), much longer than needed to observe diffusive behavior. We use an integration time step of 1 fs and employ the Berendsen heat bath with a time constant of 2 ps to control during the production run, in order to compensate for a possible minor drift of the energy in the very long simulation runs. The electrostatic potential is truncated at 7.8 Å and the energy and pressure are corrected using the reaction field method Allen and Tildesley (1987); periodic boundaries are used to minimize size effects. Trajectory information was written to disk every 100 fs for K, and every 10 ps for K.
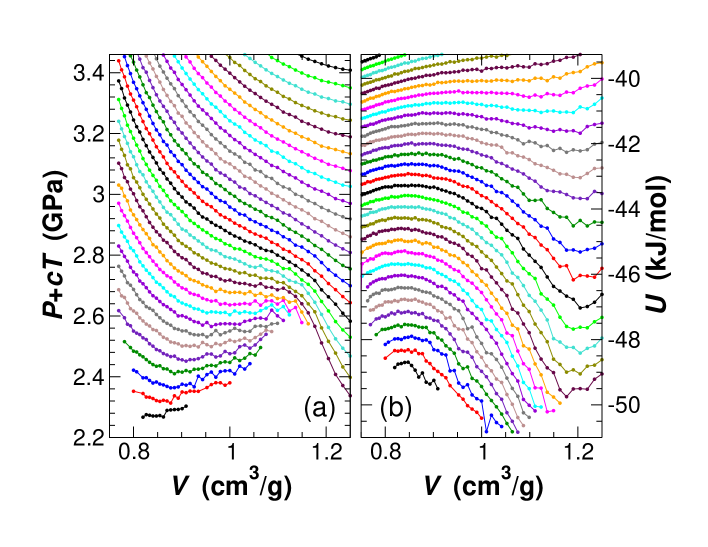
Figure 1 summarizes the thermodynamic properties of the ST2 liquid in the region examined here. Fig. 1(a) shows the pressure as a function of volume along isotherms. As decreases, these isotherms first inflect, and then become progressively flatter, leading to the realization of a liquid-liquid critical point at which . The critical point conditions in ST2 water have been estimated to occur at K, MPa, and g/cm3 Liu et al. (2009); Cuthbertson and Poole (2011).
Figure 1(b) presents the variation of the potential energy as a function of along isotherms of the liquid. As noted in previous work Sciortino et al. (1997); DeMichele et al. (2006), the emergence with decreasing of significant negative curvature in these isotherms is a thermodynamic signature of the approaching liquid-liquid instability: To be stable with respect to phase separation, the Helmholtz free energy must have positive curvature . Since (where is entropy), the negative curvature shown in Fig. 1(b) indicates an energetic driving force for phase separation that becomes dominant for Sciortino et al. (1997). It is also interesting to observe the minima of occurring at low and in the vicinity of cm3/g ( g/cm3). The presence of this minimum has also been observed in several other models of tetrahedral liquidsSciortino et al. (1997); DeMichele et al. (2006); De Michele et al. (2006); Zaccarelli et al. (2007) and signals the optimal network volume (or density), i.e. the conditions at which a particularly well developed random tetrahedral network occurs in the liquid. Indeed, hydrogen bonding requires a well-defined distance and orientation to be effective, and at the optimal density (which is usually close to the fully bonded open crystal density) geometric constraints allow the establishment of a fully bonded disordered network.
III Diffusivity of the ST2 Model
For each state point simulated, we calculate the mean-squared displacement and evaluate the diffusion coefficient from the Einstein relation
| (1) |
Here represents an average over possible time origins. Since we have more than 1500 state points to consider, we automate the evaluation of by a linear fit of for all data such that nm2, a restriction that ensures that all fitted data are well within the diffusive regime.
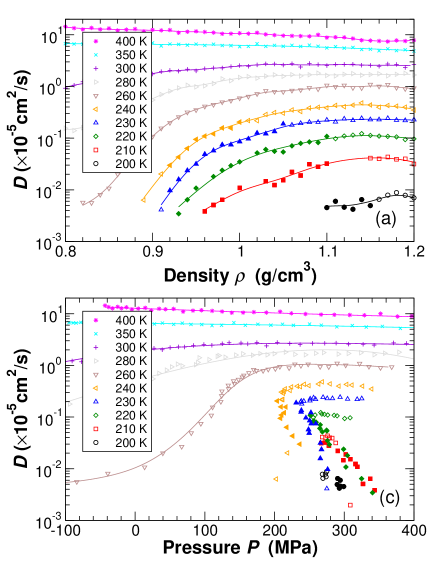
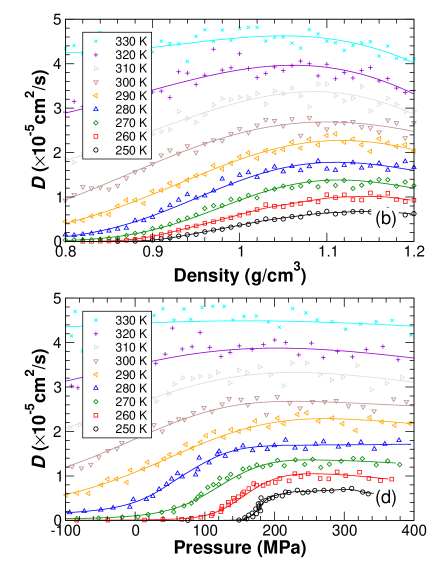
We first consider along isotherms, as shown in Fig. 2. For K, exhibits a (weak) maximum with increasing or , as known experimentally Prielmeier et al. (1987, 1988). This feature is normally attributed to the breaking of hydrogen bonds with increasing density, which allows for increased diffusion, until packing considerations become dominant and decreases. As compared with water, the ST2 model overestimates the pressure of the maximum in , which is not surprising given that ST2 overemphasizes the tetrahedral structure relative to water Harrington et al. (1997). Hence, there exists a locus of points (which we denote ) on the EOS surface at which is a maximum along isotherms; the shape of this locus in the phase diagram is discussed below. Fig. 2 also includes data obtained for . The filled data points indicate simulations in the unstable regime where our system (simulated at constant volume) is phase separated into regions of LDL and HDL. The values of in this region thus reflect a weighted average over the LDL and HDL phases. We note that decreases by nearly two orders of magnitude as the system progressively transforms from pure HDL to pure LDL along the lowest isotherms.
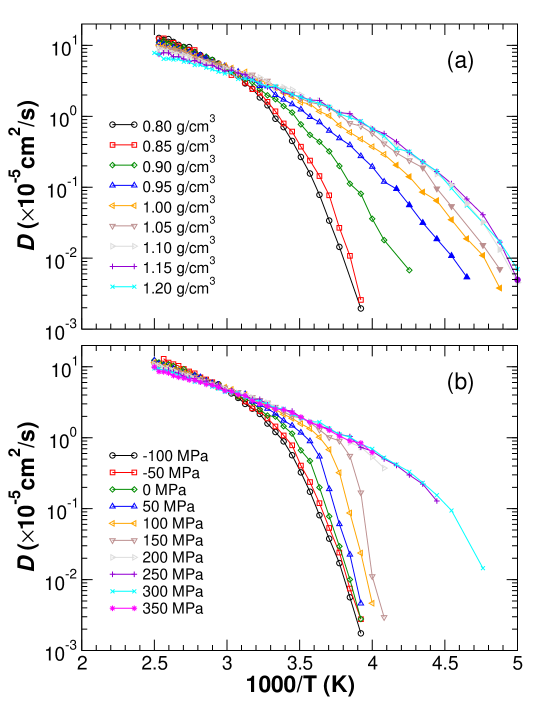
We next present the -dependence of along isochores and isobars in Fig. 3. At high , is described by the expected Arrhenius behavior
| (2) |
where is the activation energy for diffusion and is the limiting high- diffusion coefficient (both determined from fitting eq. 2 to the data). On cooling below a temperature , exhibits so-called “super-Arrhenius” behavior, where decreases faster than expected relative to the high- behavior. This rapid decrease is typical of glass-forming liquids as they approach the glass transition temperature . We estimate for along either isochores or isobars by finding that at which ; by construction, this quantity must equal unity for high- Arrhenius behavior Sastry et al. (1998).
The non-Arrhenius behavior of for many glass-forming liquids is well-accounted for by the mode-coupling theory (MCT) for the glass transitionGötze (1991), which predicts that
| (3) |
where is the temperature of an avoided vitrification of the ideal MCT. Although discussion continues concerning the region of validity of the MCT approach, the phenomenological appearance of power-law behavior immediately below is widely acknowledged. Moreover, power-law behavior of in water at atmospheric pressure has been appreciated since the 1970’s Angell (1982). This power-law behavior of in water was first interpreted as possible evidence for an underlying spinodal singularity, but more recently it has been connected with the MCT approachGallo et al. (1996); Sciortino et al. (1996); Starr et al. (1999, 1999). Accordingly, we fit separately the isobaric and isochoric data for to eq. 3 to evaluate the locus of in the phase diagram, which we discuss below. Fits must be considered along both isochoric and isobaric paths, since the diffusivity exponent will depend on the path of the approach to . Additionally, care must be taken when making this fit, since it is apparent from Fig. 3 that it appears may return to Arrhenius behavior at lower , a phenomenon which we will discuss in detail in the following section. Therefore, we have excluded data where the behavior may revert to Arrhenius.
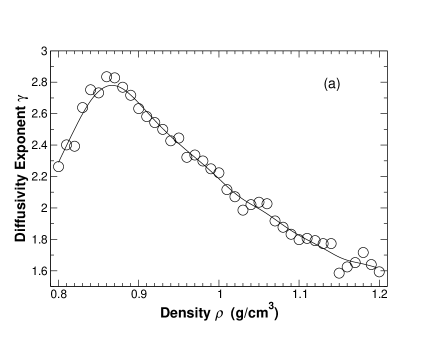
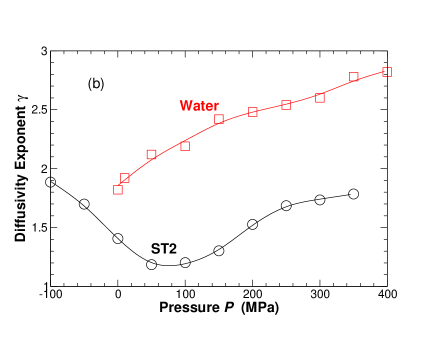
We find that the diffusivity exponent is non-monotonic with density, reaching a maximum of at g/cm3 (Fig. 4). The exponent is also non-monotonic as a function of pressure. A comparison with experimental data for shows that the behavior of for ST2 is roughly parallel in the region where both experimental and simulation data are available. This is in contrast with the SPC/E model of water, where the opposite pressure dependence occurs Starr et al. (1999).
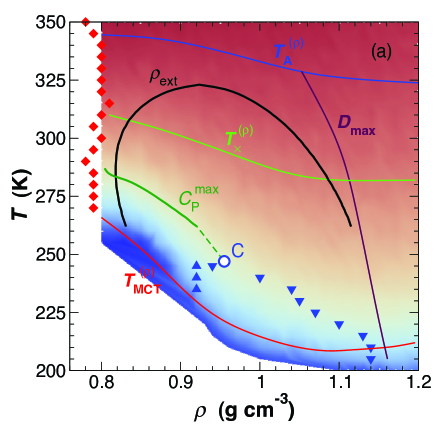
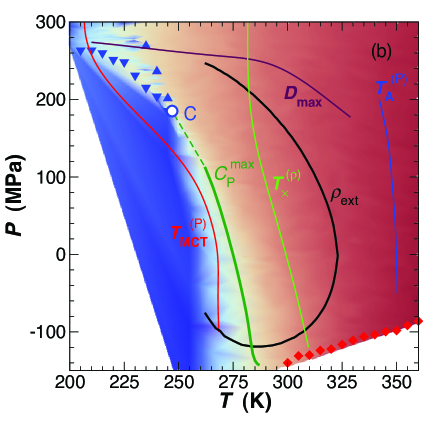
To summarize the properties of , we collect the resulting characteristic features from the isothermal, isochoric, and isobaric plots (Fig. 2 and Fig. 3) and plot them together with the known thermodynamic features. We show these features, along with a colormap for , in the plane and in the plane in Fig. 5. As expected from Ref. Errington and Debenedetti (2001), the locus lies outside the region of negative entropy-volume correlations, delineated by the locus of extrema of density . The existence of a maximum in also results in non-monotonic behavior of and , since these temperatures represent a nearly constant value of . The locus of is nearly coincident with the lower bound of our simulated data, since this also represents the time scale where simulations become prohibitively lengthy. We also show the locus of the breakdown of the Stokes-Einstein (SE) relationship from Ref.Becker et al. (2006); Kumar et al. (2007). It is interesting to note that , since the breakdown of the SE relation is often linked with . For low pressure, is correlated with (but not coincident with) the extrema of the specific heat Kumar et al. (2007). Finally, the shape of the loci , and are all similar, with the non-monotonic behavior becoming more pronounced with lower .
IV Structure and Dynamics of the Low Density Liquid Phase
One of the most challenging aspects of the liquid-liquid phase transition in ST2 water is characterizing the properties of the LDL phase. As shown in the previous section, at low density ( or ) the value of decreases far more rapidly as decreases than for . Obtaining equilibrium values for both structural and dynamical properties of the LDL phase is therefore particularly demanding of computational resources. In this section, we examine the behavior of the liquid in this low density regime, and show that many properties of the LDL phase can be determined from the behavior observed in the region accessible to our simulations.
In particular, we focus on states along the optimal density g/cm3 isochore. As shown in Fig. 1(b), this density approximately corresponds to a minimum in isotherms of versus , indicating that the structure of the random tetrahedral network (RTN) is particularly well developed at this density. We therefore expect that the characteristic properties of the LDL phase will be most prominent at this density.
To complement the simulation results described in the previous section, we examine an ensemble of 40 independently initialized and equilibrated simulations along the g/cm3 isochore for a system of size . The smaller system size allows us to probe longer time scales than for . In addition, by averaging our results at each over the 40 independent runs, we can significantly reduce the statistical error of our results. We thus use these smaller systems to carefully parse the behavior of the low-density liquid.
To evaluate the dynamical behavior of the system at g/cm3, in each of the 40 runs, the diffusion coefficient is estimated from , where is the mean squared displacement at the end of the run, and is the time of the run. All our production runs for are carried out until nm2, or ns, which ever takes longer to achieve. At the lowest (255 K), the longest runs require up to 350 ns. We then average the results over the 40 runs.
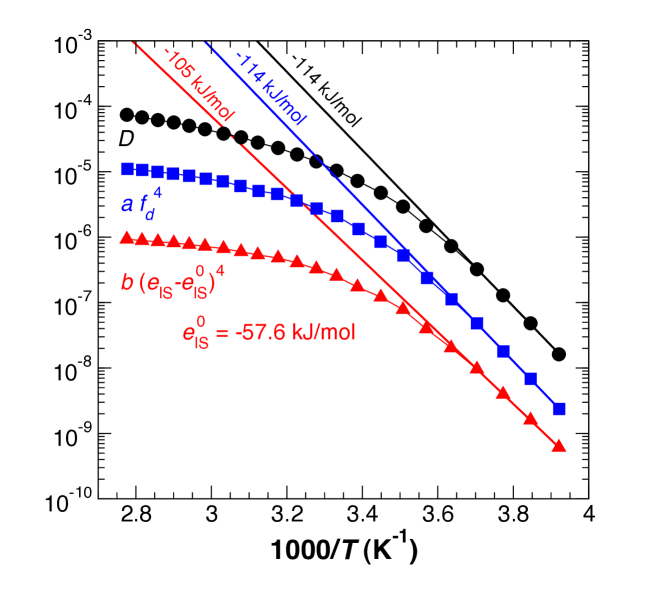
The results for as a function of are shown in an Arrhenius plot in Fig. 6. Consistent with the results of Fig. 3, we find that the -dependence of crosses over from non-Arrhenius (fragile) at higher to Arrhenius at the lowest with an activation energy kJ/mol. This appears to be the beginning of a “fragile-to-strong crossover” (FSC); such behavior has been observed and studied in a number of systems in which RTN-like structure emerges at low Starr et al. (1999, 2003); Horbach and Kob (1999); Saika-Voivod et al. (2001); DeMichele et al. (2006); De Michele et al. (2006); Xu et al. (2005). Since we have not yet reached the low energy RTN, the activation energy has not reached its low- asymptotic value. The approach to the RTN can exhibit intermediate Arrhenius behavior over several decades in before reaching the asymptotic limit Starr et al. (2003).
To support our interpretation that we are approaching strong liquid behavior as decreases, we test the expectation that the FSC is associated with the approach to the lowest lying minima of the liquid’s potential energy landscape (PEL). To confirm this behavior in ST2 water, we carry out conjugate gradient quenches of a large number of configurations (at least 400 for each value of studied) in order to evaluate the average energy of a liquid configuration when quenched to its nearest local minimum of the PEL, referred to as the average inherent structure energy, .
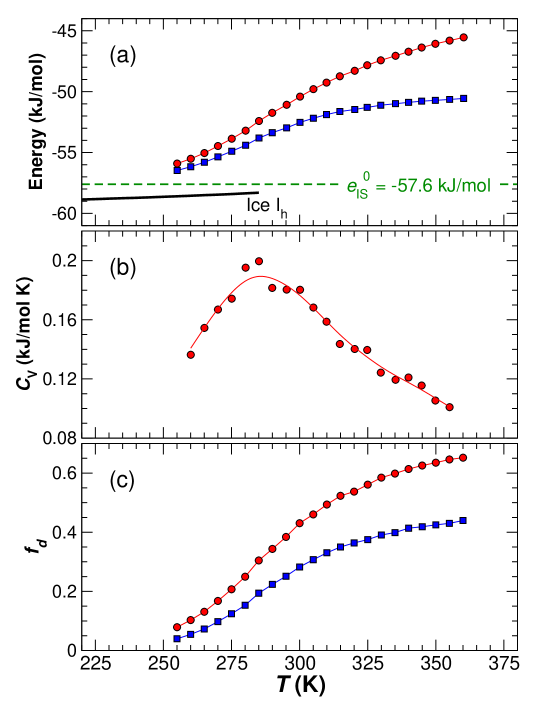
In Fig. 7(a) we show both and as a function of for g/cm3. In both cases we find that an inflection occurs in the vicinity of K, and that at lower the rate of decrease of the energy slows with decreasing . Fig. 7(a) also shows for the ice Ih crystal, the value of which sets a lower bound on for the liquid. The relative shape and position of these curves suggests that the energy of the low density liquid is approaching a low limit associated with the “bottom” of the liquid PEL that lies above the crystal state.
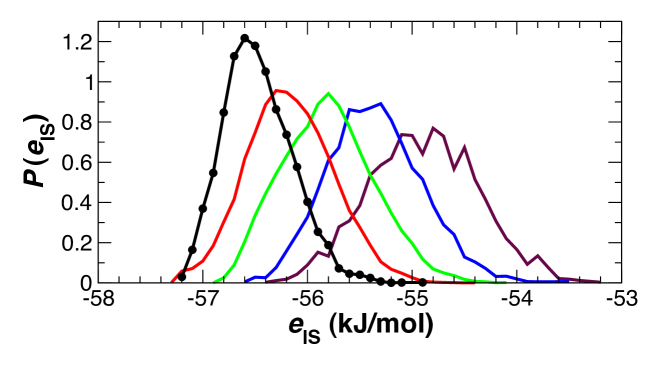
The approach of the liquid to the bottom of the PEL is also confirmed in Fig. 8, which plots the sampled probability distribution of the set of values obtained at low . While at high the distributions are approximately Gaussian, at the lowest K the distribution has become distinctly skewed and narrower, reflecting the approach to a finite lower bound for the possible values of . We assume that the approach of toward its minimum value obeys
| (4) |
and estimate by fitting to this form over the range of in which appears to follow an Arrhenius behavior. We approximate this range as the lowest four shown in Fig. 6, and obtain kJ/mol. As expected for a liquid, this value is above that of the value of for the crystal, ice Ih. The limiting strong behavior will only be apparent when the system nears . We notice that the value of is almost exactly half of the value of the activation energy for diffusion, supporting the view that is strongly related to the single particle energy. Since each bond connects two molecules, we can evaluate the binding energy per bond kJ/mol, which is larger than the bare HB energy kJ/mol Sciortino and Fornili (1989); Sciortino et al. (1992), since includes non-bonded interactions.
We also note in Fig. 7(b) that a maximum in the isochoric heat capacity occurs in the vicinity of K, and as expected, coincides with the inflections of and shown in Fig. 7(a). This thermodynamic signature emphasizes that even though all our data at g/cm3 lie above , for K we have crossed into the regime in which the properties of the liquid are increasingly dominated by the LDL phase, which is distinct from the HDL phase for .
In order to provide some structural insight into the dynamical behavior along the g/cm3 isochore, we examine the role of defects in the RTN structure of the liquid. In a perfect RTN, all molecules would have exactly four nearest neighbors (nn’s) within a distance given by the first minimum of the oxygen-oxygen radial distribution function. This distance is approximately 0.35 nm in ST2 water at g/cm3 Sciortino et al. (1992). We thus define the fraction of RTN defects as the average fraction of molecules in the system that do not have four nn’s within a distance of 0.35 nm; hence such defect molecules will either have more than, or less than, four nn’s. is plotted as a function of in Fig. 7(c), as obtained from both instantaneous liquid configurations, as well as from inherent structures. In both cases we find that decreases as decreases, passes through an inflection near K, and approaches zero at our lowest . Indeed, as shown in Fig. 6, we find that the approach of to zero at low closely follows an exponential decay, and in particular, that the defect activation energy obtained by plotting is approximately equal to the value of obtained by fitting to an Arrhenius law at low . Since , is approximately proportional to the exponential of ; hence, essentially measures the probability that a single bond is broken.
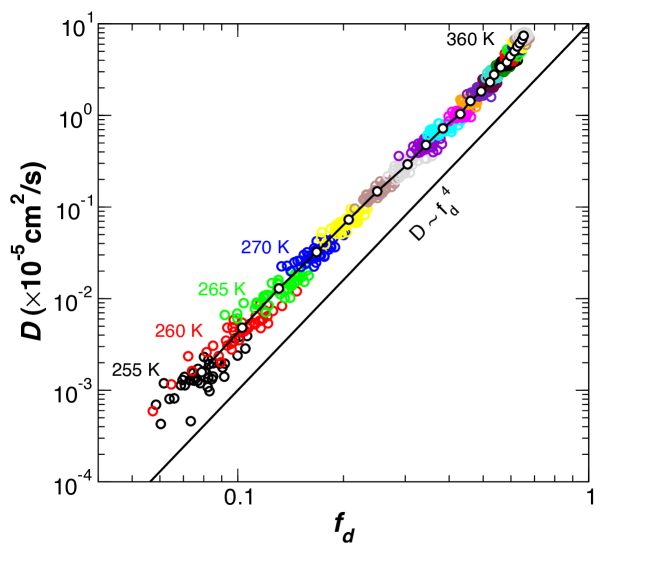
To test if the relation between and holds at higher (where the behavior is non-Arrhenius) we present in Fig. 9 a parametric plot of versus over the entire range studied at g/cm3, from K to 255 K. Except for some deviations at the highest , we find a remarkably consistent behavior in which varies as a power law in over almost four decades, and with an exponent very close to 4. This result strongly suggests that the liquid at this density can be understood as a disrupted RTN, and that the localized excitations of this RTN (i.e. the defects) control the transport properties of the liquid.
The relation between and can be anticipated by works on colloids and nanoparticles with highly directional interactions. In particular, it was found that in systems of patchy colloids with four sticky-spots in a tetrahedral geometryDeMichele et al. (2006) and in nanoparticles linked by DNA with tetrahedral orientationStarr and Sciortino (2006); Largo et al. (2006) is given by the fourth power of the fraction of broken bonds, . One possible explanation for this behavior is that is controlled by the diffusion process of the particles which have four broken bonds, and which are thus free to wander around in the available empty space, searching for the rare free dangling ends — i.e. for the rare sites of the network with incomplete bonding — to stick. Indeed, if this is the case, is proportional in a first approximation to the fraction of un-bonded particles, and this fraction scales with . It is important to remember that liquid water at this density belongsSciortino (2007) to the category of so-called empty liquidsBianchi et al. (2006), i.e. liquids in which the fraction of space occupied by a space-filling representation of the molecules is significantly smaller than the close packing value. For the case of liquid water, the corresponding effective packing fraction, when molecules are considered as hard-spheres of diameter nm (the mean hydrogen bond length), is .
The comparison between water and these tailored tetrahedral systems DeMichele et al. (2006); Starr and Sciortino (2006); Largo et al. (2006) can also help clarify the connection between the activation energy of the dynamics and the bonding energy. Indeed, in these systems, it is clear that the activation energy for diffusion is given by four times the bond energy, since the interactions are short-ranged and there is no energy contribution from non-bonded neighbors. For ST2, each hydrogen bond has a strength of kJ/mol Sciortino and Fornili (1989); Sciortino et al. (1992), significantly less (by 9 kJ/mol) than the overall binding energy per bond at the lowest simulated. If breaking of HBs are the limiting factor in diffusion, we can anticipate that the asymptotic activation energy for diffusion may decrease to a limiting value of kJ/mol, similar to the low- value (74 kJ/mol) estimated for water Starr et al. (2003).
V Summary
In conclusion, we have provided a comprehensive survey of the diffusive properties of the ST2 water model in the vicinity of the liquid-liquid transition. Our results demonstrate that the structural and dynamical properties of the LDL phase that becomes a thermodynamically distinct liquid phase for are already well established in the liquid at low density for . The LDL phase is here revealed as a highly structured liquid, whose properties are dominated by the progressive emergence of a RTN structure as decreases. In this sense, the properties of the LDL phase are entirely consistent with those of low density amorphous ice, as determined in experiments. Finally, we show that the dynamics of the LDL appears to be fully controlled by the presence of defects of the network, whose concentration is controlled by the bond energy.
VI Acknowledgments
PHP thanks NSERC and the CRC Program for financial support, and ACEnet for computational resources. FS acknowledges support from grant ERC-226207-PATCHYCOLLOIDS. FWS thanks the NSF for support from grant number CNS-0959856.
References
- Eisenberg and Kauzmann (1969) Eisenberg, D.; Kauzmann, W. The Structure and Properties of Water; Oxford Univ. Press: New York, 1969.
- Franks (1972) Franks, F., Ed. Water: A Comprehensive Treatise, Vols. 1–7; Plenum Press: New York, 1972.
- Stanley and Teixeira (1980) Stanley, H. E.; Teixeira, J. J. Chem. Phys. 1980, 73, 3404–3422.
- Geiger and Stanley (1982) Geiger, A.; Stanley, H. E. Phys. Rev. Lett. 1982, 49, 1749–1752.
- Blumberg et al. (1984) Blumberg, R. L.; Stanley, H. E.; Geiger, A.; Mausbach, P. J. Chem. Phys. 1984, 80, 5230–5241.
- Sciortino et al. (1990) Sciortino, F.; Poole, P.; Stanley, H. E.; Havlin, S. Phys. Rev. Lett. 1990, 64, 1686–1689.
- Starr et al. (1999) Starr, F. W.; Nielsen, J. K.; Stanley, H. E. Phys. Rev. Lett. 1999, 82, 2294–2297.
- Han et al. (2009) Han, S.; Kumar, P.; Stanley, H. E. Phys. Rev. E 2009, 79, 041202.
- Poole et al. (1992) Poole, P. H.; Sciortino, F.; Essmann, U.; Stanley, H. E. Nature 1992, 360, 324–328.
- Sastry et al. (1993) Sastry, S.; Sciortino, F.; Stanley, H. E. J. Chem. Phys. 1993, 98, 9863–9872.
- Poole et al. (1993) Poole, P. H.; Sciortino, F.; Essmann, U.; Stanley, H. E. Phys. Rev. E 1993, 48, 3799–3817.
- Poole et al. (1993) Poole, P. H.; Essmann, U.; Sciortino, F.; Stanley, H. E. Phys. Rev. E 1993, 48, 4605–4610.
- Poole et al. (1994) Poole, P. H.; Sciortino, F.; Grande, T.; Stanley, H. E.; Angell, C. A. Phys. Rev. Lett. 1994, 73, 1632–1635.
- Sastry et al. (1996) Sastry, S.; Debenedetti, P.; Sciortino, F.; Stanley, H. E. Phys. Rev. E 1996, 53, 6144–6154.
- Harrington et al. (1997) Harrington, S. T.; Zhang, R.; Poole, P. H.; Sciortino, F.; Stanley, H. E. Phys. Rev. Lett. 1997, 78, 2409–2412.
- Sciortino et al. (1997) Sciortino, F.; Poole, P. H.; Essmann, U.; Stanley, H. E. Phys. Rev. E 1997, 55, 727–737.
- Sadr-Lahijany et al. (1998) Sadr-Lahijany, M. R.; Scala, A.; Buldyrev, S. V.; Stanley, H. E. Phys. Rev. Lett. 1998, 81, 4895–4898.
- Mishima and Stanley (1998) Mishima, O.; Stanley, H. E. Nature 1998, 392, 192.
- Starr et al. (1999) Starr, F. W.; Bellissent-Funel, M.-C.; Stanley, H. E. Phys. Rev. E 1999, 60, 1084–1087.
- Meyer and Stanley (1999) Meyer, M.; Stanley, H. E. J. Phys. Chem. B 1999, 103, 9728–9730.
- Scala et al. (2000) Scala, A.; Starr, F. W.; Nave, E. L.; Stanley, H. E.; Sciortino, F. Phys. Rev. E 2000, 62, 8016–8020.
- Franzese et al. (2001) Franzese, G.; Malescio, G.; Skibinsky, A.; Buldyrev, S. V.; Stanley, H. E. Nature 2001, 409, 692–695.
- Giovambattista et al. (2002) Giovambattista, N.; Starr, F. W.; Sciortino, F.; Buldyrev, S. V.; Stanley, H. E. Phys. Rev. E 2002, 65, 041502.
- Yamada et al. (2002) Yamada, M.; Mossa, S.; Stanley, H. E.; Sciortino, F. Phys. Rev. Lett. 2002, 88, 195701.
- Starr et al. (2003) Starr, F. W.; Angell, C. A.; Stanley, H. E. Physica A 2003, 323, 51 – 66.
- Buldyrev and Stanley (2003) Buldyrev, S. V.; Stanley, H. E. Physica A 2003, 330, 124–129.
- Giovambattista et al. (2003) Giovambattista, N.; Stanley, H. E.; Sciortino, F. Phys. Rev. Lett. 2003, 91, 115504.
- Skibinsky et al. (2004) Skibinsky, A.; Buldyrev, S. V.; Franzese, G.; Malescio, G.; ; Stanley, H. E. Phys. Rev. E 2004, 69, 061206.
- Giovambattista et al. (2005) Giovambattista, N.; Stanley, H. E.; Sciortino, F. Phys. Rev. Lett. 2005, 94, 107803.
- Xu et al. (2005) Xu, L.; Kumar, P.; Buldyrev, S. V.; Chen, S.-H.; Poole, P. H.; Sciortino, F.; Stanley, H. E. Proc. Natl. Acad. Sci. 2005, 102, 16558–16562.
- Giovambattista et al. (2005) Giovambattista, N.; Stanley, H. E.; Sciortino, F. Phys. Rev. E 2005, 72, 031510.
- Kumar et al. (2005) Kumar, P.; Buldyrev, S. V.; Starr, F.; Giovambattista, N.; Stanley, H. E. Phys. Rev. E 2005, 72, 051503.
- Kumar et al. (2006) Kumar, P.; Yan, Z.; Xu, L.; Mazza, M. G.; Buldyrev, S. V.; Sastry, S.-H. C. S.; Stanley, H. E. Phys. Rev. Lett. 2006, 97, 177802.
- Kumar et al. (2007) Kumar, P.; Buldyrev, S. V.; Becker, S. L.; Poole, P. H.; Starr, F. W.; Stanley, H. E. Proc. Natl. Acad. Sci. USA 2007, 104[23], 9575–9579.
- Yan et al. (2008) Yan, Z.; Buldyrev, S. V.; Kumar, P.; Giovambattista, N.; Stanley, H. E. Phys. Rev. E 2008, 77, 042201.
- Xu et al. (2009) Xu, L.; Buldyrev, S. V.; Giovambattista, N.; Angell, C. A.; Stanley, H. E. J. Chem. Phys. 2009, 130, 054505.
- Xu et al. (2009) Xu, L.; Mallamace, F.; Yan, Z.; Starr, F. W.; Buldyrev, S. V.; Stanley, H. E. Nature Physics 2009, 5, 565–569.
- Stokely et al. (2010) Stokely, K.; Mazza, M. G.; Stanley, H. E.; Franzese, G. Proc. Natl. Acad. Sci. USA 2010, 107, 1301–1306.
- Mishima and Stanley (1998) Mishima, O.; Stanley, H. E. Nature 1998, 396, 329.
- Debenedetti and Stanley (2003) Debenedetti, P. G.; Stanley, H. E. Physics Today 2003, 56, 40–46.
- Mishima et al. (1985) Mishima, O.; Calvert, L. D.; Whalley, E. Nature 1985, 314, 76.
- Mishima (1994) Mishima, O. J. Chem. Phys. 1994, 100, 5910–5912.
- Angell (2004) Angell, C. A. Annu Rev Phys Chem 2004, 55, 559–583.
- Loerting and Giovambattista (2006) Loerting, T.; Giovambattista, N. J. Phys.: Condens. Matter 2006, 18, R919–R977.
- Sastry and Angell (2003) Sastry, S.; Angell, C. A. Nature materials 2003, 2, 739–43.
- Poole et al. (1997) Poole, P. H.; Hemmati, M.; Angell, C. A. Phys. Rev. Lett. 1997, 79, 2281–2284.
- Hemmati et al. (2001) Hemmati, M.; Moynihan, C.; Angell, C. J. Chem. Phys. 2001, 115, 6663–6671.
- Hsu et al. (2008) Hsu, C. W.; Largo, J.; Sciortino, F.; Starr, F. W. Proc Natl Acad Sci USA 2008, 105, 13711–13715.
- Dai et al. (2010) Dai, W.; Hsu, C. W.; Sciortino, F.; Starr, F. W. Langmuir 2010, 26, 3601–3608.
- Kumar et al. (2005) Kumar, P.; Buldyrev, S.; Sciortino, F.; Zaccarelli, E.; Stanley, H. Phys Rev E 2005, 72, 021501.
- Stillinger and Rahman (1974) Stillinger, F. H.; Rahman, A. J. Chem. Phys. 1974, 60, 1545.
- Poole et al. (1993) Poole, P. H.; Sciortino, F.; Essmann, U.; Stanley, H. E. Phys. Rev. E 1993, 48, 3799.
- Sciortino et al. (1997) Sciortino, F.; Poole, P. H.; Essmann, U.; Stanley, H. E. Phys. Rev. E 1997, 55, 727.
- Paschek and Geiger (1999) Paschek, D.; Geiger, A. J. Phys. Chem. B 1999, 103, 4139.
- Poole et al. (2005) Poole, P. H.; Saika-Voivod, I.; Sciortino, F. J. Phys.: Condens. Matter 2005, 17, L431–L437.
- Liu et al. (2009) Liu, Y.; Panagiotopoulos, A. Z.; Debenedetti, P. G. J. Chem. Phys. 2009, 131, 104508.
- Cuthbertson and Poole (2011) Cuthbertson, M.; Poole, P. H. Phys Rev Lett 2011, 106, 115706.
- Sciortino and Fornili (1989) Sciortino, F.; Fornili, S. L. J. Chem. Phys. 1989, 90, 2786–2792.
- Sciortino et al. (1992) Sciortino, F.; Geiger, A.; Stanley, H. E. J. Chem. Phys. 1992, 96, 3857.
- Sciortino et al. (1990) Sciortino, F.; Geiger, A.; Stanley, H. E. Phys. Rev. Lett. 1990, 65, 3452–3455.
- Sciortino et al. (1991) Sciortino, F.; Geiger, A.; Stanley, H. E. Nature 1991, 354, 218–221.
- Becker et al. (2006) Becker, S. R.; Poole, P. H.; Starr, F. W. Phys Rev Lett 2006, 97, 055901.
- Allen and Tildesley (1987) Allen, M. P.; Tildesley, D. J. Computer Simulation of Liquids; Oxford Univ. Press: Oxford, 1987.
- DeMichele et al. (2006) DeMichele, C.; Gabrielli, S.; Tartaglia, P.; Sciortino, F. Journal of Physical Chemistry B 2006, 110, 8064–8079.
- De Michele et al. (2006) De Michele, C.; Tartaglia, P.; Sciortino, F. J. Chem. Phys. 2006, 125, 204710.
- Zaccarelli et al. (2007) Zaccarelli, E.; Sciortino, F.; Tartaglia, P. J. Chem. Phys. 2007, 127, 174501.
- Prielmeier et al. (1987) Prielmeier, F. X.; Lang, E. W.; Speedy, R. J.; Lüdemann, H.-D. Phys. Rev. Lett. 1987, 59, 1128–1131.
- Prielmeier et al. (1988) Prielmeier, F. X.; Lang, E. W.; Speedy, R. J.; Lüdemann, H.-D. Ber. Bunsenges. Phys. Chem. 1988, 92, 1111.
- Harrington et al. (1997) Harrington, S.; Poole, P. H.; Sciortino, F.; Stanley, H. E. J. Chem. Phys. 1997, 107, 7443–7450.
- Sastry et al. (1998) Sastry, S.; Debenedetti, P. G.; Stillinger, F. H. Nature 1998, 393, 554.
- Götze (1991) Götze, W. In Les Houches Summer Schools of Theoretical Physics Session LI (1989); J.P.Hansen,, D.Levesque,, J.Zinn-Justin,, Eds.; North-Holland Amsterdam, 1991; pp 287–503.
- Angell (1982) Angell, C. A. In Water: A Comprehensive Treatise; Franks, F., Ed.; Plenum: New York, 1982.
- Gallo et al. (1996) Gallo, P.; Sciortino, F.; Tartaglia, P.; Chen, S. H. Phys. Rev. Lett. 1996, 76, 2730.
- Sciortino et al. (1996) Sciortino, F.; Gallo, P.; Tartaglia, P.; Chen, S.-H. Phys. Rev. E 1996, 54, 6331–6343.
- Starr et al. (1999) Starr, F. W.; Harrington, S.; Sciortino, F.; Stanley, H. E. Phys. Rev. Lett. 1999, 82, 3629–3632.
- Starr et al. (1999) Starr, F. W.; Sciortino, F.; Stanley, H. E. Phys. Rev. E 1999, 60, 6757–6768.
- Errington and Debenedetti (2001) Errington, J.; Debenedetti, P. G. Nature 2001, 409, 318–321.
- Kumar et al. (2007) Kumar, P.; Buldyrev, S. V.; Becker, S. R.; Poole, P. H.; Starr, F. W.; Stanley, H. E. Proc Natl Acad Sci USA 2007, 104, 9575–9.
- Horbach and Kob (1999) Horbach, J.; Kob, W. Phys. Rev. B 1999, 60, 3169–3181.
- Saika-Voivod et al. (2001) Saika-Voivod, I.; Poole, P. H.; Sciortino, F. Nature 2001, 412, 514–517.
- Xu et al. (2005) Xu, L.; Kumar, P.; Buldyrev, S.; Chen, S.; Poole, P. H.; Sciortino, F.; Stanley, H. Proc Natl Acad Sci USA 2005, 102, 16558–16562.
- Starr and Sciortino (2006) Starr, F. W.; Sciortino, F. J. Phys.: Condens. Matter 2006, 18, L347–L353.
- Largo et al. (2006) Largo, J.; Starr, F. W.; Sciortino, F. Langmuir 2006, 23, 5896–5905.
- Sciortino (2007) Sciortino, F. Eur. Phys. J. B 2007, 64, 505–509.
- Bianchi et al. (2006) Bianchi, E.; Largo, J.; Tartaglia, P.; Zaccarelli, E.; Sciortino, F. Phys. Rev. Lett. 2006, 97, 168301–168304.