Constraints on cosmological models from lens redshift data
Abstract
Strong lensing has developed into an important astrophysical tool for probing both cosmology and galaxies (their structures, formations, and evolutions). Now several hundreds of strong lens systems produced by massive galaxies have been discovered, which may form well-defined samples useful for statistical analyses. To collect a relatively complete lens redshift data from various large systematic surveys of gravitationally lensed quasars and check the possibility to use it as a future complementarity to other cosmological probes. We use the distribution of gravitationally-lensed image separations observed in the Cosmic Lens All-Sky Survey (CLASS), the PMN-NVSS Extragalactic Lens Survey (PANELS), the Sloan Digital Sky Survey (SDSS) and other surveys, considering a singular isothermal ellipsoid (SIE) model for galactic potentials as well as improved new measurements of the velocity dispersion function of galaxies based on the SDSS DR5 data and recent semi-analytical modeling of galaxy formation, to constrain two dark energy models (CDM and constant ) under a flat universe assumption. We find that the current lens redshift data give a relatively weak constraint on the model parameters. However, by combing the redshift data with the baryonic acoustic oscillation peak and the comic macrowave background data, we obtain more stringent results, which show that the flat CDM model is still included at 1.
1 Introduction
The discovery of strong gravitational lensing in Q0957+561 (Walsh et al.1979) opened up the vast possibility to use strong lens systems in the study of cosmology and astrophysics. Up to now, strong lensing has developed into an important astrophysical tool for probing both cosmology (Fukugita et al., 1992; Kochanek, 1993; Zhu, 2000a, b; Chae et al., 2002; Chae, 2003; Chae et al., 2004; Mitchell et al., 2005; York et al., 2005; Zhu & Mauro, 2008a; Zhu et al., 2008b) and galaxy structures, formations, and evolutions (Zhu & Wu, 1997; Mao & Schneider, 1998; Jin et al., 2000; Keeton, 2001; Kochanek & White, 2001; Chae & Mao, 2003; Ofek et al., 2003; Rusin & Kochanek, 2005; Chae, 2005; Chae et al., 2006; Koopmans et al., 2006; Treu et al., 2006). Now several hundreds of strong lens systems produced by massive galaxies have been discovered, but only galactic-scale strong lenses with known redshift of source and image separation can form well-defined samples useful for statistical analyses.
These well-defined strong lenses are particularly useful not only for constraining the statistical properties of galaxies such as optical region velocity dispersions (Chae, 2005; Chae et al., 2006) and galaxy evolutions (Chae & Mao, 2003; Ofek et al., 2003), but also for constraining cosmological parameters such as the present matter density and the equation of state of dark energy (Chae, 2003; Mitchell et al., 2005). For example, the CLASS statistical sample (Browne et al., 2003; Chae, 2003) containing 13 lenses which strictly satisfy well-defined selection criteria was first extensively used by Chae et al. (2002) and Chae (2003), who found in a flat cosmology with non-evolving galaxy populations. Then this CLASS sample was reanalyzed with the velocity dispersion function (VDF) of early-type galaxies derived from the SDSS Data Release 1 (DR1 (Sheth et al., 2003)) galaxies Mitchell et al. (2005).
In our paper, we summarize a complete lens redshift sample from various imaging surveys including the Cosmic Lens ALL-Sky Survey (CLASS; (Browne et al., 2003; Myers et al., 2003)),the JVAS, the Sloan Digital Sky Survey (SDSS; (Oguri et al., 2006)), the PMN-NVSS Extragalactic Lens Survey (PANELS; (Winn et al., 2001))and the Snapshot survey, which accumulates 29 galactic-scale lenses so far to form a well-defined radio-selected lens sample. Newly measured J1620+1203 (Kayo et al., 2009) from SDSS is also included.
One emphasis we need to make is the measurement of the VDF of galaxies. Chae (2005) found that the Sheth et al. (2003) VDF of early-type galaxies underestimated their abundance based on the Wilkinson Microwave Anisotropy Probe (WMAP) 1st year cosmology (Spergel et al., 2003). Then, with a new method of classifying galaxies (Park & Choi, 2005), Choi et al. (2007) made a new VDF measurement of early-type galaxies based on the much larger SDSS Data Release 5 (DR5; Adelman-McCarthy et al. (2007)). Recently, Chae (2006) have determined the VDF of the late-type population using the Tully-Fisher relation and SIE galaxy model, which matches relatively well that of Sheth et al. (2003). More recently, Chae (2010) introduced a correction term for high velocity dispersions and used the Monte Carlo method to separately generate the early-type and late-type galaxies and to derive a total VDF for the entire population of galaxies (see also in Bernardi et al. (2010)). However, the simulated data points for the total population of galaxies are not fitted well by the VDF of the morphologically-typed galaxy populations, which might be due to the errors in the adopted correlations between luminosity and velocity (Chae, 2010).
Moreover, strong lensing has also been extensively applied to constrain dark energy, one of the most important issues of the modern cosmology ever since the observations of type Ia supernovae (SNe Ia) first indicating an accelerating expansion of the universe at the present stage (Riess et al., 1998). Among diverse dark energy models, the most simple candidate for the uniformly distributed dark energy is considered to be in the form of vacuum energy density or cosmological constant (). However, the cosmological constant is always entangled with (i) fine tuning problem (present amount of the dark energy is so small compared with fundamental scale) and (ii) coincidence problem (dark energy density is comparable to critical density today). Alternatively there exist other choices, for example, an X-matter component, which is characterized by an equation of state , where (Zhu, 1998; Peebles & Ratra, 2003). The goal of this work is to use the lens redshift test combined with the revised VDF of all-type galaxies based on the SDSS DR5 data to constrain two cosmological models.
This paper is organized as follows. In Section 2 we briefly describe the analysis method including assumptions about the lens population. We then present the lens redshift data from various surveys in Section 3. We further introduce two prevalent cosmologies and show the results of constraining cosmological parameters using MCMC method in Section 4. Finally, we conclude and make a discussion in Section 5.
2 Lens redshift test
The statistical lensing model used in this paper incorporates the (differential) lensing probabilities of specific image multiplicities for the multiply-imaged sources using the SIE lens model. The primary assumption we make is that the distribution of early-type galaxies in luminosity is given by the Schechter (1976) form
| (1) |
Considering a power-law relation between luminosity () and velocity dispersion (), i.e. , we can describe the distribution of galaxies in velocity dispersion in the form of the modified Schechter function (Sheth et al., 2003; Mitchell et al., 2005)
| (2) |
where is the integrated number density of galaxies, is the characteristic velocity dispersion, with the following relations: , , and .
Following Eq. (2), the particular differential probability that a source at redshift be multiply imaged by a distribution of galaxies at redshift with a image separation can be written as:
| (3) | |||||
where is the characteristic image separation given by
| (4) |
and is the angular-diameter distance between redshifts and . On the hypothesis that galaxies are not biased toward oblate or prolate shape, we choose the dynamical normalization factor for the singular isothermal ellipsoid (SIE) model (Chae, 2003, 2005). Though isothermal mass model would, in general, be too simplified to do accurate modelling of individual lenses (Chae et al., 2002), it is accurate enough as first-order approximations to the mean properties of galaxies for the analyses of statistical lensing (e.g.(Kochanek, 1993; Mao & Kochanek, 1994; Rix et al., 1994; Kochanek, 1996; King et al., 1997; Fassnacht & Cohen, 1998; Rusin & Kochanek, 2005)).
Following Chae (2003), the likelihood of the observed image separations for multiply-imaged sources reads
| (5) |
Here is the particular differential probability for the -th multiply-imaged source. (, ) is the weight factor given to the early-type or the late-type populations, which satisfies . If the lensing galaxy type is unknown, we use (, ) (Chae, 2003). Accordingly, a “”is defined as:
| (6) |
Notice that the here is free of the dimensionless Hubble constant , which makes it possible to perform as an individual cosmological probe besides SNeIa, CMB, BAO etc. The ‘best-fit’ model parameters are determined by minimizing the [Eq.(6)] and confidence limits on the model parameters are obtained by using the usual () static, where is the global minimum for the best-fit parameters. Our calculating method is based on the publicly available package CosmoMC (Lewis & Bridle, 2002).
On the side of the measurement of VDF, the first direct measurement of the VDF of early-type galaxies was the SDSS DR1 (Sheth et al., 2003):
| (7) | |||||
Then Choi et al. (2007) obtained a new VDF based on the much larger SDSS DR5:
| (8) | |||||
Obviously, the revised DR5 VDF, which has been proved to provide an efficient way to constrain dark energy models combined with gravitational lensing statistics (Zhu & Mauro, 2008a), is quite different from the DR1 VDF in the characteristic velocity dispersion at 1. While early-type galaxies dominate strong lensing, late-type galaxies cannot be neglected. However, for the late-type galaxy population, the direct measurement of the VDF is complicated by the significant rotations of the disks. Chae (2006) estimated all the parameters of equation (2) for the late-type population using the Tully-Fisher relation and SIE galaxy model:
| (9) | |||||
which matches relatively well that of Sheth et al. (2003) who determined using a Tully-Fisher relation.
Currently, it is found that simple evolutions do not significantly affect the lensing statistics if all galaxies are early-type (Mao & Kochanek, 1994; Rix et al., 1994; Mitchell et al., 2005; Capelo & Natarajan, 2007). Many previous studies on lensing statistics without evolutions of the velocity function have also got appealing results that agree with the galaxy number counts (Im et al., 2002) and the redshift distribution of lens galaxies (Chae, 2003; Ofek et al., 2003). However, in this paper, we consider galaxy evolutions both for early-type and late-type galaxies with a recent semi-analytical model of galaxy formation (Kang et al., 2005; Chae et al., 2006):
| (10) |
with the best-fit parameters of Kang et al. (2005): for early-type and for late-type galaxies.
3 Lens redshift data
Large systematic surveys of gravitationally lensed quasars provide a
large statistical lens sample appropriate for studying cosmology. In
this section, we summarize a sample both from CLASS, SDSS
observations and recent large-scale observations of galaxies, which
will be used as the input for the statistical lensing model
described in section 2. Two main sources of the lens
redshift data are the Cosmic Lens All-Sky Survey and the Sloan
Digital Sky Survey Quasar Lens Search.
A. CLASS
As the largest completed galactic mass scale gravitational lens search project, the Cosmic Lens All-Sky Survey, along with its predecessor project: the Jodrell-Bank–VLA Astrometric Survey (JVAS) has confirmed 22 multiply-imaged systems out of a total of 16521 radio sources (Browne et al., 2003). Out of the entire CLASS sample including the JVAS sources, a subsample of 8958 sources containing 13 multiply-imaged systems constitutes a statistical sample that satisfies well-defined observational selection criteria (Browne et al., 2003), which can be used for the statistical analysis of gravitational lensing in this paper.
In this work we need galactic-scale strong lens samples that satisfy
well-defined observational selection criteria. With the well-defined
selection criteria from Browne et al. (2003); Chae (2003), two out of the four
multiply-imaged sources in the JVAS, 0414+054 with a too steep
spectral index and 1030+074 with the fainter-to-brighter image
flux-density ratio of two images less than 0.1, are excluded from
the final CLASS statistical sample. Meanwhile, we stress that the
measured lens redshifts, source redshifts, image separations, image
multiplicities and the lensing galaxy types (if determined), as
shown in table 1, are all needed through the likelihood
function defined in Section 2 to constrain
cosmological parameters. Under this criterion, for the CLASS
sources, B0850+054, B0445+123, B0631+519, B1938+666 are clearly
excluded due to their unknown source redshifts, while for B0739+366,
J2004.1349, redshifts both for source and lens are unavailable
111We discard lens systems that do not have measured lens or
source redshifts, which may possibly cause biases. For many
multiply-imaged sources without measured source redshifts, a
possible strategy is to take , which is the mean source
redshift for the multiply-imaged sources with measured source
redshifts. However, in order to ensure the accuracy of constraint,
we choose to abandon such a choice in our paper.. Moreover, the
measured image separations of 1359+154, 1608+656 and 2114+022 are
not used because the observed angular sizes are due to multiple
galaxies within their critical radii.
B. SDSS
The Sloan Digital Sky Survey Quasar Lens Search (SQLS; Oguri et al. (2006)) is a photometric and spectroscopic survey covering nearly a quarter of the entire sky (York et al., 2000). We try to find suitable lens samples from the optical quasar catalog of the Sloan Digital Sky Survey (SDSS; York et al. (2000)). The first complete lens sample from Data Release 3 selected from 22,683 low-redshift () is provided in Inada et al. (2008). It consists of 11 lensed quasars satisfying the following well-defined selection criteria: 1)The image separation is between and with quasars brighter than ; 2) The flux ratio of faint to bright images is greater than for double lenses. In this paper, an additional cut is applied to select a appropriate subsample: the lensing galaxy should be fainter than the quasar components, because a too bright lens galaxy will strongly affect the colors of the quasars (Richards et al., 2002). Four lensed quasars, Q0957+561, SDSS J1004+4112, SDSS J1332+0347 and SDSS J1524+4409 are removed with this cut. Like the CLASS, due to the absence of lens redshifts, two more quasars, SDSS J1001+5027 and SDSS J1021+4913 are excluded. However, we successfully add four lens redshift data including SDSS J1620+1203, one of the eight newly discovered and confirmed two-image lensed quasars by SDSS Quasar Lens Search (Kayo et al., 2009).
In table 1, we summarize 29 Strongly-lensed Sources (redshifts both for sources and lenses, as well as the largest image separations and galaxy types) from the CLASS (JVAS), the SDSS, the PANELS and the Snapshot, which formulate a well-defined combined statistical sample for model constraints.
| Source | Lens | Maximum | Number | Lensing | ||
| Source | Survey | redshift | redshift | image | of | galaxy(-ies) |
| () | () | separation (′′) | images | type | ||
| B0414+054 | CLASS | 2.64 | 0.96 | 2.03 | 4 | early-type (1, 2) |
| B0712+472† | CLASS | 1.34 | 0.41 | 1.27 | 4 | early-type (1, 2) |
| B1030+074 | JVAS | 1.535 | 0.599 | 1.56 | 2 | 2Gs (E+?) (1, 2) |
| B1422+231† | JVAS | 3.62 | 0.34 | 1.28 | 4 | early-type (1, 2) |
| J16320033 | PANELS | 3.42 | 1 | 1.47 | 2 | early-type (1, 2) |
| J18383427 | PANELS | 2.78 | 0.36 | 1.0 | 2 | early-type (1, 2) |
| B1933+503† | CLASS | 2.62 | 0.755 | 1.17 | 4 | early-type (1, 2) |
| Q0142-100 | Snapshot | 2.72 | 0.49 | 2.23 | 2 | early-type (1, 3) |
| PG1115+080 | Snapshot | 1.72 | 0.31 | 2.43 | 4 | early-type (1, 3) |
| B1938+666 | CLASS | 1.8 | 0.88 | 0.91 | 4+2+R | early-type (1, 2, 4) |
| J02460825 | SDSS | 1.685 | 0.723 | 1.04 | 2 | early-type (5, 6) |
| SBS0909+523 | SDSS | 1.377 | 0.83 | 1.11 | 2 | early-type (7, 8) |
| J0924+0219 | SDSS | 1.523 | 0.393 | 1.78 | 4 | early-type (9, 10, 11) |
| J12260006 | SDSS | 1.125 | 0.517 | 1.24 | 2 | early-type (12, 13) |
| J1335+0118 | SDSS | 1.571 | 0.440 | 1.57 | 2 | early-type (14, 13) |
| Q0957+561 | SDSS | 1.413 | 0.36 | 6.17 | 2 | early-type (15, 16) |
| J1332+0347 | SDSS | 1.438 | 0.191 | 1.14 | 2 | early-type (17) |
| J1524+4409 | SDSS | 1.210 | 0.310 | 1.67 | 2 | early-type (18) |
| 0712+472 | CLASS | 1.34 | 0.41 | 1.27 | 4 | early-type (19) |
| B1359+154 | CLASS | 3.24 | 1 | 1.67 | 6 | 3Gs (E+?+?) (1, 2) |
| B2045+265 | CLASS | 4.3 | 0.87 | 1.91 | 4 | 2Gs (E+?) (2, 20) |
| B1608+656 | CLASS | 1.39 | 0.64 | 2.08 | 4 | 2Gs (E+L) (2, 21) |
| B0128+437 | CLASS | 3.12 | 1.15 | 0.55 | 4 | unknown (6, 14) |
| B1152+199† | CLASS | 1.019 | 0.439 | 1.56 | 2 | 2Gs [?(E)a+?] (1, 2) |
| Q1208+1011 | Snapshot | 3.80 | 1.13 | 0.48 | 2 | unknown (5, 7, 8) |
| J1620+1203 | SDSS | 1.158 | 0.398 | 2.765 | 2 | unknown (22) |
| B0218+357 | CLASS | 0.96 | 0.68 | 0.33 | 2 | late-type (1, 2) |
| B1600+434 | CLASS | 1.59 | 0.41 | 1.38 | 2 | late-type (1, 2) |
| J0134.0931 | PANELS | 2.23 | 0.76 | 0.68 | 5+2 | 2Gs (L?+L?) (1, 2, 23) |
4 DE models and constraint results
In what follows, we choose two popular dark energy models and examine whether they are consistent with the lens redshift data listed above.
-
1.
Cosmological constant model.
-
2.
Dark energy with constant equation of state.
Both of the two classes of models are currently viable candidates to explain the observed cosmic acceleration. Unless stated otherwise, throughout the paper we calculate the best fit values found, and vary the parameters within their 2 uncertainties for either class of model. Next, we shall outline the basic equations describing the evolution of the cosmic expansion in both dark energy models and calculate the best-fit parameters.
4.1 Constraint on the standard cosmological model (CDM)
4.1.1 Constraint from the lens redshift data
In the simplest scenario, the dark energy is simply a cosmological constant, , i.e. a component with constant equation of state . If flatness of the FRW metric is assumed, the Hubble parameter according to the Friedmann equation is:
| (11) |
where and parameterize the density of matter and cosmological constant, respectively. Moreover, in the zero-curvature case (), this model has only one independent parameter: .
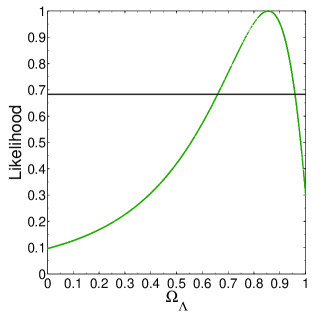
We plot the likelihood distribution function for this model in Fig. 1. The best-fit value of the parameter is: . It is obvious that the lens redshift data only give a relatively weak constraint on the model parameter , though the universally recognized value of is still included at 68.3% CL (1). To make a comparison, it is necessary to refer to the previous results: the current best fit value from cosmological observations is: in the flat case (Davis et al., 2007), which is in relatively stringent accordance with our result. Moreover, Komatsu et al. (2009) gave the best-fit parameter: for the flat CDM model from the WMAP 5-year results with the BAO and SN Union data. We find that the constraint result from the lens redshift data is marginally consistent with the previous works above.
4.1.2 Joint analysis with BAO and CMB
For the BAO data, the parameter is used, which, for a flat universe can be expressed as
| (12) |
where and is from the SDSS (Eisenstein et al., 2005).
For the CMB data, the shift parameter is used, which may provide an effective way to constrain the parameters of dark energy models due to its large redshift distribution. Derived from the CMB data, takes the form as
| (13) |
where (Komatsu et al., 2009) is the redshift of recombination and the 5-year WMAP data give (Komatsu et al., 2009).
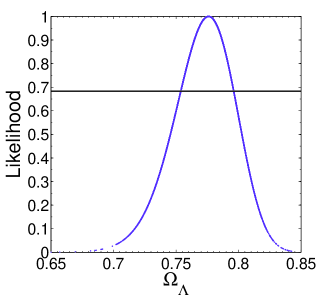
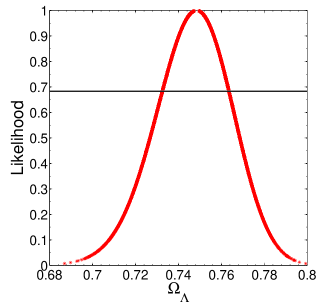
In Fig. 2 and 3, we show the result by combining the lens redshift data with CMB and CMB+BAO, respectively. The best-fit parameter is: and , a relatively satisfactory result consistent with that of Li et al. (2010). Compared with Fig. 1, it is apparent that is more tightly constrained with the joint data sets.
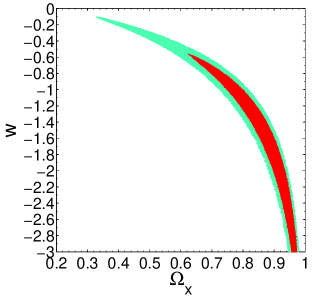
4.2 Dark energy with constant equation of state ()
4.2.1 Constraint from the lens redshift data
If allowing for a deviation from the simple , a component with a constant value for the equation of state could be introduced. The accelerated expansion can be obtained when . In a zero-curvature universe, the Hubble parameter for this generic dark energy component with density then becomes:
| (14) |
Obviously, when flatness is assumed (), it is a two-parameter model with the model parameters: .
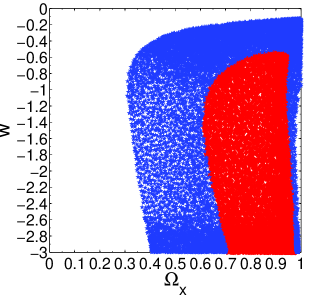
For the redshift data only, the best-fit values of the parameters are: . Fig. 4 shows the confidence limits in the plane. On the one hand, we have at 68.3% CL, which is quite different from the result of Chae (2006); on the other hand, the Einstein’s cosmological constant () is still favored within 1 error region. Therefore, it seems that the present lens redshift data do not necessarily favor the phantom DE model with (Caldwell, 2002,2003). However, it is still interesting to see whether this remains so with future lager and better lens redshift data.
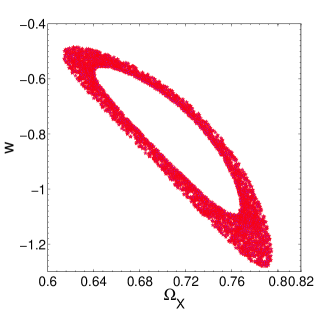
4.2.2 Joint analysis with BAO and CMB
In Fig. 5 and 6, we plot the likelihood contours with the joint data by combining the lens redshift data with CMB and CMB+BAO in the plane. The best-fit parameters are: and . Notice that both and are more stringently constrained with the joint observational data. Meanwhile, the currently preferred values of in this model still include the cosmological constant case: (Davis et al., 2007). Therefore, when the equation of state does not depend on the redshift, the dark energy is consistent with a flat cosmological constant model within 1 error region.
5 Conclusion and discussion
Recent new observations, such as SNeIa, Wilkinson Microwave Anisotropy Probe (WMAP) (Komatsu et al., 2009) and Baryon Acoustic Oscillations (BAO) (Percival et al., 2009), the time drift of subtended angles (Zhang & Zhu, 2009), the updated Gamma-ray bursts (GRB) (e.g., Gao et al., 2010; Liang et al., 2010) have provided many robust tools to study the dynamical behavior of the universe. However, it is still important to use other different probes to set bounds on cosmological parameters. In this work, we have followed this direction and used the distribution of gravitationally-lensed image separations observed in the Cosmic Lens All-Sky Survey (CLASS), the PMN-NVSS Extragalactic Lens Survey (PANELS), the Sloan Digital Sky Survey (SDSS) and other surveys to constrain cosmological models with the new measurements of the velocity dispersion function of galaxies based on the SDSS DR5 data and recent semi-analytical modeling of galaxy formation. Two dark energy models (CDM and constant ) are considered under a flat universe assumption.
For the zero-curvature CDM model, although the lens redshift data can not tightly constrain the model parameter , a stringent constraint can be obtained by combining the lens redshift data with the comic macrowave background data: and the baryonic acoustic oscillation peak data as well: . Furthermore, we consider a flat cosmology with a constant dark energy. For the lens redshift data, we have at 68.3% CL, a result different from that of Chae (2006) with (68.3% CL), therefore, this strong lensing data do not necessarily favor a super-negative equation of state for dark energy. However, the Einstein s cosmological constant () is still included within 1 error region. Likewise, adding CMB and CMB+BAO does lead to further improvements in parameter constraints with and , respectively. Therefore, it indicates that the cosmological constant model is still the best one to explain this lens redshift data, a conclusion in accordance with the previous works (Davis et al., 2007) and the results from the WMAP and the large-scale structures in the SDSS luminous red galaxies (Spergel et al., 2003; Tegmark et al., 2004; Eisenstein et al., 2005).
However, we also notice that, firstly, the implementation of singular isothermal ellipsoid model (SIE) may be a source of systematic errors. For example, a lens ellipticity of 0.4 can lead to a difference of compared with the spherical case due to the variation of magnification bias and cross section (Huterer et al., 2005). Secondly, as for the source of the lens redshift data, we simply discard lens systems that do not have measured lens or source redshifts in this paper. This could also possibly bring biases and will be considered in our future work. Thirdly, though the lens redshift test applied in this paper is free from the magnification bias arising from the uncertain source counts, it may also lose the statistical power of absolute lensing probabilities (or ”lensing rates”). Lastly, though we have used the VDF of galaxies based on a much larger SDSS Data Release in the strong lensing statistics, the accuracy of measurements on relevant parameters of VDF may also make a difference. Hopefully, Large new samples of strong lenses will be expected to be obtained in future wide-field imaging surveys such as the Large Synoptic Survey Telescope (LSST; Ivezić et al. (2000)) etc and within a few decades next generation observation tools such as the Square Kilometre Array (e.g., Blake et al. (2004)) will also improve the precision of lensing statistics by orders of magnitude. Therefore, the lens redshift test can play an important role in uncovering the physical processes of galaxy formation and universe evolution with much larger and better lens redshift data.
Summarizing, from the above discussion we may safely arrive at a conclusion that the results from the observational lens redshift data are relatively agreeable and furthermore the lens redshift test can be seen as a future complementarity to other cosmological probes.
Acknowledgments
This work was supported by the National Natural Science Foundation of China under the Distinguished Young Scholar Grant 10825313 and Grant 11073005, the Ministry of Science and Technology national basic science Program (Project 973) under Grant No.2007CB815401, the Fundamental Research Funds for the Central Universities and Scientific Research Foundation of Beijing Normal University.
References
- Adelman-McCarthy et al. (2007) Adelman-McCarthy, J., et al. 2008, ApJS, 175, 297
- Bernardi et al. (2010) Bernardi et al. 2010, MNRAS, 404, 2087
- Blake et al. (2004) Blake, C. A., Abdalla, F. B., Bridle, S. L., & Rawlings, S. 2004, NewAR, 48, 1063
- Browne et al. (2003) Browne, I. W. A., et al. 2003, MNRAS, 341, 13
- Caldwell (2002,2003) Caldwell, R. R. 2002, PLB, 545, 23; Caldwell, R. R., Kamionkowski, M., & Weinberg, N. N. 2003, PRL, 91, 071301
- Capelo & Natarajan (2007) Capelo, P. R., & Natarajan P. 2007, NJPh, 9, 445
- Chae et al. (2002) Chae, K.-H., et al. 2002, PRL, 89, 151301
- Chae & Mao (2003) Chae, K.-H., & Mao, S. D. 2003, ApJ, 599, L61
- Chae (2003) Chae, K.-H. 2003, MNRAS, 346, 746
- Chae et al. (2004) Chae, K.-H., Chen, G., Ratra, B., & Lee, D.-W. 2004, ApJ, 607, L71
- Chae (2005) Chae, K.-H. 2005, ApJ, 630, 764
- Chae et al. (2006) Chae, K.-H., Mao, S.D., & Kang, X. 2006, MNRAS, 373, 1369
- Chae (2006) Chae, K.-H. 2006, ApJL, accepted, arXiv:0611898
- Chae (2010) Chae K.-H. 2010, MNRAS, 402, 2031
- Choi et al. (2007) Choi, Y.-Y., Park, C., & Vogeley, M. S. 2007, ApJ, 884, 897
- Davis et al. (2007) Davis, T. M., et al. 2007, ApJ, 666, 716
- Eigenbrod et al. (2006a) Eigenbrod, A., Courbin, F., Dye, S., Meylan, G., Sluse, D., Vuissoz, C., & Magain, P. 2006a, A&A, 451, 74
- Eigenbrod et al. (2006b) Eigenbrod, A., Courbin, F., Meylan, G., Vuissoz, C., & Magain, P. 2006b, A&A, 451, 759
- Eigenbrod et al. (2007) Eigenbrod, A., Courbin, F., & Meylan, G. 2007, A&A, 465, 51
- Eisenstein et al. (2005) Eisenstein, D. J., et al. 2005, ApJ, 633, 560
- Faber & Jackson (1976) Faber, S. M., & Jackson, R. E. 1976, ApJ, 204, 668
- Fassnacht & Cohen (1998) Fassnacht, & Cohen, 1998, MNRAS, submitted
- Fukugita et al. (1992) Fukugita, M., Futamase, T., Kasai, M., & Turner, E. L. 1992, ApJ, 393, 3
- Gao et al. (2010) Gao, H., Liang, N., & Zhu, Z.-H. ApJ, submitted, arXiv:1003.5755
- Huterer et al. (2005) Huterer, D., Keeton, C. R., & Ma, C.-P. 2005, ApJ, 624, 34
- Im et al. (2002) Im, M., et al. 2002, ApJ, 571, 136
- Inada et al. (2003a) Inada, N., et al. 2003a, AJ, 126, 666
- Inada et al. (2003b) Inada, N., et al. 2003b, AJ, submitted
- Inada et al. (2005) Inada, N., et al. 2005, AJ, 130, 1967
- Inada et al. (2008) Inada, N., et al. 2008, AJ, 135, 496
- Ivezić et al. (2000) Ivezić, Z., et al. 2008, arXiv:0805.2366
- Jin et al. (2000) Jin, K.-J., Zhang, Y.-Z., & Zhu, Z.-H. 2000, PLA, 264,335
- Kang et al. (2005) Kang, X., Jing, Y. P., Mo, H. J., & Börner, G. 2005, ApJ, 631, 21
- Kayo et al. (2009) Kayo, I., Inada, N., Oguri, M., Morokuma, T., Hall, P. B., Kochanek, C. S., & Schneider, D. P. 2009, AJ, submitted, arXiv:0912.1462v1
- Keeton (2001) Keeton, C. R. 2001, ApJ, 561, 46
- King et al. (1997) King, L. J., Browne, I. W. A., Muxlowm T. W. B., Narasimha, D., Patnaik, A. R., Porcas, R. W., & Wilkinson, P. N. 1997, MNRAS, 289, 450
- Kochanek (1993) Kochanek, C. S. 1993, ApJ, 419, 12
- Kochanek (1996) Kochanek, C. S. 1996, ApJ, 466, 638
- Kochanek & White (2001) Kochanek, C. S., & White, M. 2001, ApJ, 559, 531
- Komatsu et al. (2009) Komatsu, E., et al. [WMAP Collaboration], 2009, AJS, 180, 330
- Koopmans et al. (2006) Koopmans, L. V. E., Treu, T., Bolton, A. S., Burles, S., & Moustakas, L. A. 2006, ApJ, 649, 599
- Lewis & Bridle (2002) Lewis, A., & Bridle, S. 2002, PRD, 66, 103, 511
- Li et al. (2010) Li, M., Li, X.-D., & Zhang, X., 2010, Sci.China Phys.Mech.Astron. 53, 1631
- Liang et al. (2010) Liang, N., Wu, P.-X., & Zhu, Z.-H., arXiv:1006.1105
- Lubin et al. (2000) Lubin, L. M., Fassnacht, C. D., Readhead, A. C. S., Blandford, R. D., & Kundi c, T. 2000, AJ, 119, 451
- Mao & Kochanek (1994) Mao, S. D., & Kochanek, C. S. 1994, MNRAS, 268, 569
- Mao & Schneider (1998) Mao, S. D., & Schneider, P. 1998, MNRAS, 295, 587
- McKean et al. (2007) McKean, J. P., et al. 2007, MNRAS, 378, 109
- Mitchell et al. (2005) Mitchell, J. L., Keeton, C. R., Frieman, J. A., & Sheth, R. K. 2005, ApJ, 622, 81
- Morokuma et al. (2007) Morokuma, T., et al. 2007, AJ, 133, 214
- Myers et al. (2003) Myers, S. T., et al. 2003, MNRAS, 341, 1
- Ofek et al. (2003) Ofek, E. O., Rix, H.-W., & Maoz, D. 2003, MNRAS, 343, 639
- Oguri et al. (2004) Oguri, M., et al. 2004, PASJ, 56, 399
- Oguri et al. (2006) Oguri, M., et al. 2006, AJ, 132, 999
- Oguri et al. (2008) Oguri, M., et al. 2008, AJ, 135, 520
- Oscoz et al. (1997) Oscoz, A., Serra-Ricart, M., Mediavilla, E., Buitrago, J., & Goicoechea, L. J. 1997, ApJ, 491, L7
- Park & Choi (2005) Park, C., & Choi, Y.-Y. 2005, ApJ, 635, L29
- Peebles & Ratra (2003) Peebles, P.J.E., & Ratra, B. 2003, Rev. Mod. Phys. 75, 559
- Percival et al. (2009) Percival, W. J., et al. 2007, MNRAS, 381, 1053
- Richards et al. (2002) Richards, G. T., et al. 2002, AJ, 123, 2945
- Riess et al. (1998) Riess, A. G., et al. 1998, AJ, 116, 1009
- Rix et al. (1994) Rix, H.-W., Mao, D., Turner, E. L., & Fukugita, M. 1994, ApJ, 435, 49
- Rusin & Kochanek (2005) Rusin, D., & Kochanek, C. S. 2005, ApJ, 623, 666
- Sheth et al. (2003) Sheth, R. K., et al. 2003, ApJ, 594, 225
- Spergel et al. (2003) Spergel, D. N., et al. 2003, ApJS, 148, 175
- Stoughton et al. (2002) Stoughton, C., et al. 2002, AJ, 123, 485
- Surpi & Blandford (2003) Surpi, G., & Blandford, R. D. 2003, ApJ, 584, 100
- Tegmark et al. (2004) Tegmark, M., et al. 2004, PRD, 69, 103
- Treu et al. (2006) Treu, T., Koopmans, L. V. E., Bolton, A. S., Burles, S., & Moustakas, L. A. 2006, ApJ, 640, 662
- Walsh et al. (1979) Walsh, D., Carswell, R. F., & Weymann, R. J. 1979, Nature, 279, 381
- Winn et al. (2001) Winn, J. N., Hewitt, J. N., & Schechter, P. L. 2001, in Gravitational Lensing: Recent Progress and Future Goals, ASP Conference Proceedings, Vol. 237, ed. Brainerd, T. G., & Kochanek, C. S. (San Francisco: ASP), p. 61
- York et al. (2000) York, D. G., et al. 2000, AJ, 120, 157
- York et al. (2005) York, T., Jackson, N., Browne, I. W. A., Wucknitz, O., & Skelton, J. E. 2005, MNRAS, 357, 124
- Young et al. (1981) Young, P., Gunn, J. E., Oke, J. B., Westphal, J. A., & Kristian, J. 1981, ApJ, 244, 736
- Zhang & Zhu (2009) Zhang, H.-B., & Zhu, Z.-H., arXiv:0911.1859v1
- Zhu & Wu (1997) Zhu, Z.-H., & Wu, X.-P. 1997, A&A, 324, 483
- Zhu (1998) Zhu, Z.-H. 1998, A&A, 338, 777
- Zhu (2000a) Zhu, Z.-H. 2000, Mod.Phys.Lett.A, 15, 1023
- Zhu (2000b) Zhu, Z.-H. 2000, Int.J.Mod.Phys.D, 9, 591
- Zhu & Mauro (2008a) Zhu, Z.-H., & Mauro Sereno, 2008, A&A, 487, 831
- Zhu et al. (2008b) Zhu, Z.-H., et al. 2008, A&A, 483, 15